
Integrating Prometheus with SONiC
Introduction
Prometheus is an open-source monitoring system that operates primarily on a pull-based model, scraping metrics from endpoints. However, Prometheus does not natively support the gNMI (gRPC Network Management Interface) streaming protocol, which is increasingly common for managing and monitoring modern network devices like those running SONiC.
In this article, we demonstrate how to deploy a Prometheus server alongside a Prometheus exporter on a SONiC device to collect telemetry data from the network operating system (NOS). We’ll walk through the process of setting up each component and show how Prometheus can be used to monitor SONiC devices by gathering and visualizing essential network metrics.
Prometheus installation
In our example, we will install the Prometheus server on a dedicated host with the IP address 172.20.166.81, while the Prometheus exporter will be deployed on the c1 SONiC router.
Download Prometheus: https://prometheus.io/download/
cisco@8ktme:~$ wget https://github.com/prometheus/prometheus/releases/download/v3.0.0-beta.1/prometheus-3.0.0-beta.1.linux-amd64.tar.gz
--2024-10-31 22:33:03--  https://github.com/prometheus/prometheus/releases/download/v3.0.0-beta.1/prometheus-3.0.0-beta.1.linux-amd64.tar.gz
Resolving proxy-wsa.esl.cisco.com (proxy-wsa.esl.cisco.com)... 173.36.240.166
Connecting to proxy-wsa.esl.cisco.com (proxy-wsa.esl.cisco.com)|173.36.240.166|:80... connected.
Proxy request sent, awaiting response... 302 Found
Location: https://objects.githubusercontent.com/github-production-release-asset-2e65be/6838921/6a74f190-c1b0-4783-b997-385eb78ab59f?X-Amz-Algorithm=AWS4-HMAC-SHA256&X-Amz-Credential=releaseassetproduction%2F20241031%2Fus-east-1%2Fs3%2Faws4_request&X-Amz-Date=20241031T223656Z&X-Amz-Expires=300&X-Amz-Signature=3526357bd9d596403e415c5d9d5aef8b316fcd99a0069ec5f90eae710f5f9ed9&X-Amz-SignedHeaders=host&response-content-disposition=attachment%3B%20filename%3Dprometheus-3.0.0-beta.1.linux-amd64.tar.gz&response-content-type=application%2Foctet-stream [following]
--2024-10-31 22:33:04--  https://objects.githubusercontent.com/github-production-release-asset-2e65be/6838921/6a74f190-c1b0-4783-b997-385eb78ab59f?X-Amz-Algorithm=AWS4-HMAC-SHA256&X-Amz-Credential=releaseassetproduction%2F20241031%2Fus-east-1%2Fs3%2Faws4_request&X-Amz-Date=20241031T223656Z&X-Amz-Expires=300&X-Amz-Signature=3526357bd9d596403e415c5d9d5aef8b316fcd99a0069ec5f90eae710f5f9ed9&X-Amz-SignedHeaders=host&response-content-disposition=attachment%3B%20filename%3Dprometheus-3.0.0-beta.1.linux-amd64.tar.gz&response-content-type=application%2Foctet-stream
Connecting to proxy-wsa.esl.cisco.com (proxy-wsa.esl.cisco.com)|173.36.240.166|:80... connected.
Proxy request sent, awaiting response... 200 OK
Length: 112787601 (108M) [application/octet-stream]
Saving to: ‘prometheus-3.0.0-beta.1.linux-amd64.tar.gz’

prometheus-3.0.0-beta.1.linux-amd64 100%[==================================================================>] 107.56M  42.4MB/s    in 2.5s

2024-10-31 22:33:07 (42.4 MB/s) - ‘prometheus-3.0.0-beta.1.linux-amd64.tar.gz’ saved [112787601/112787601]
Unpack the downloaded file
cisco@8ktme:~$ tar xfvz prometheus-3.0.0-beta.1.linux-amd64.tar.gz
prometheus-3.0.0-beta.1.linux-amd64/
prometheus-3.0.0-beta.1.linux-amd64/LICENSE
prometheus-3.0.0-beta.1.linux-amd64/NOTICE
prometheus-3.0.0-beta.1.linux-amd64/promtool
prometheus-3.0.0-beta.1.linux-amd64/prometheus.yml
prometheus-3.0.0-beta.1.linux-amd64/prometheus
cisco@8ktme:~$
cd into the unpacked folder and launch Prometheus
cd prometheus-3.0.0-beta.1.linux-amd64/
./prometheus&
Server is run on port :9090, so in our lab that would be http://172.20.166.81:9090/query
Prometheus Exporter
Test Exporter Launch
A Prometheus exporter is a component or application that collects and exposes metrics from a system, application, or service in a format that Prometheus can scrape and ingest. Exporters act as intermediaries that gather data from sources (like databases, hardware, network devices, or operating systems) and transform this data into the standard format Prometheus requires.
One of the key advantages of SONiC is that its open-source NOS runs on top of Linux Debian. This means you can run the Prometheus exporter directly on your SONiC switches, eliminating the need for separate monitoring appliances. It’s this open, flexible foundation that sets SONiC apart: because it’s essentially a Linux server under the hood, you can also install familiar DevOps tools like Salt, Puppet, or Chef agents right on your network devices to automate configurations and simplilfy operations.
This level of flexibility is a major strength of SONiC, allowing you to treat your network switches much like any other server in your infrastructure.
EXPORTERS AND INTEGRATIONS https://prometheus.io/docs/instrumenting/exporters/
Download Node Exporter for linux into a SONiC NOS: https://prometheus.io/download/#node_exporter
untar the file:
cisco@c1:~$ tar xfvz node_exporter-1.8.2.linux-amd64.tar.gz
node_exporter-1.8.2.linux-amd64/
node_exporter-1.8.2.linux-amd64/NOTICE
node_exporter-1.8.2.linux-amd64/node_exporter
node_exporter-1.8.2.linux-amd64/LICENSE
Launch the exporter:
cisco@c1:~$ ./node_exporter-1.8.2.linux-amd64/node_exporter &
[1] 2777834
cisco@c1:~$ ts=2024-11-02T21:03:03.295Z caller=node_exporter.go:193 level=info msg="Starting node_exporter" version="(version=1.8.2, branch=HEAD, revision=f1e0e8360aa60b6cb5e5cc1560bed348fc2c1895)"
ts=2024-11-02T21:03:03.295Z caller=node_exporter.go:194 level=info msg="Build context" build_context="(go=go1.22.5, platform=linux/amd64, user=root@03d440803209, date=20240714-11:53:45, tags=unknown)"

...

ts=2024-11-02T21:03:03.298Z caller=tls_config.go:313 level=info msg="Listening on" address=[::]:9100
ts=2024-11-02T21:03:03.298Z caller=tls_config.go:316 level=info msg="TLS is disabled." http2=false address=[::]:9100
Exporter runs listening on :9100 port.
cisco@c1:~$ ss -ltnp "sport = :9100"
State           Recv-Q           Send-Q    Local Address:Port        Peer Address:Port          Process
LISTEN          0                512       *:9100                    *:*                        users:(("node_exporter",pid=2777834,fd=3))
Test Prometheus metrics retrival directly from SONiC NOS:
cisco@c1:~$ curl http://localhost:9100/metrics

# HELP go_gc_duration_seconds A summary of the pause duration of garbage collection cycles.
# TYPE go_gc_duration_seconds summary
go_gc_duration_seconds{quantile="0"} 2.4226e-05
go_gc_duration_seconds{quantile="0.25"} 2.4226e-05
go_gc_duration_seconds{quantile="0.5"} 3.7988e-05
go_gc_duration_seconds{quantile="0.75"} 7.8422e-05
go_gc_duration_seconds{quantile="1"} 7.8422e-05
go_gc_duration_seconds_sum 0.000140636
go_gc_duration_seconds_count 3
# HELP go_goroutines Number of goroutines that currently exist.
# TYPE go_goroutines gauge

...
Exporter as a Service
Most likely there is a desire to run the exporter as a service and start it automatically on a router reload
Copy the node exporter binary to /usr/local/bin
sudo cp node_exporter /usr/local/bin/
Create a node_exporter user to run the node exporter service.
sudo useradd -rs /bin/false node_exporter
Create a node_exporter service in systemd folder
sudo vi /usr/lib/systemd/system/node_exporter.service
Service configuration
[Unit]
Description=Node Exporter
After=network.target

[Service]
User=node_exporter
Group=node_exporter
Type=simple
ExecStart=/usr/local/bin/node_exporter

[Install]
WantedBy=multi-user.target
Reload the system daemon and start the node exporter service.
sudo systemctl daemon-reload
sudo systemctl start node_exporter
sudo systemctl enable node_exporter
Check the status of node exporter
sudo systemctl status node_exporter
Output
systemctl status node_exporter
● node_exporter.service - Prometheus Node Exporter
     Loaded: loaded (/lib/systemd/system/node_exporter.service; enabled; preset: enabled)
     Active: active (running) since Sun 2024-11-03 15:23:17 UTC; 14s ago
   Main PID: 3295581 (node_exporter)
      Tasks: 5 (limit: 37461)
     Memory: 5.1M
     CGroup: /system.slice/node_exporter.service
             └─3295581 /usr/local/bin/node_exporter

Nov 03 15:23:17 c1 node_exporter[3295581]: ts=2024-11-03T15:23:17.875Z caller=node_exporter.go:118 level=info collector=time
Nov 03 15:23:17 c1 node_exporter[3295581]: ts=2024-11-03T15:23:17.875Z caller=node_exporter.go:118 level=info collector=timex
Nov 03 15:23:17 c1 node_exporter[3295581]: ts=2024-11-03T15:23:17.875Z caller=node_exporter.go:118 level=info collector=udp_queues
Nov 03 15:23:17 c1 node_exporter[3295581]: ts=2024-11-03T15:23:17.875Z caller=node_exporter.go:118 level=info collector=uname
Nov 03 15:23:17 c1 node_exporter[3295581]: ts=2024-11-03T15:23:17.875Z caller=node_exporter.go:118 level=info collector=vmstat
Nov 03 15:23:17 c1 node_exporter[3295581]: ts=2024-11-03T15:23:17.875Z caller=node_exporter.go:118 level=info collector=watchdog
Nov 03 15:23:17 c1 node_exporter[3295581]: ts=2024-11-03T15:23:17.875Z caller=node_exporter.go:118 level=info collector=xfs
Nov 03 15:23:17 c1 node_exporter[3295581]: ts=2024-11-03T15:23:17.875Z caller=node_exporter.go:118 level=info collector=zfs
Nov 03 15:23:17 c1 node_exporter[3295581]: ts=2024-11-03T15:23:17.876Z caller=tls_config.go:313 level=info msg="Listening on" address=[::]:9100
Nov 03 15:23:17 c1 node_exporter[3295581]: ts=2024-11-03T15:23:17.876Z caller=tls_config.go:316 level=info msg="TLS is disabled." http2=false >
lines 1-19/19 (END)
Add Endpoint
Add the exporter address into the Prometeus endpoint configuration.
Go to the folder where the prometheus was run from and open prometheus.yml file vim prometheus.yml
Add a new job and a targed:
scrape_configs:
  # The job name is added as a label `job=<job_name>` to any timeseries scraped from this config.
  - job_name: "sonic c1"
    scrape_interval: 30s
    scrape_timeout: 30s

    # metrics_path defaults to '/metrics'
    # scheme defaults to 'http'.

    static_configs:
      - targets: ["1.18.1.1:9100"]
Use promtool to verfy the configuration file
cisco@8ktme:~/prometheus-3.0.0-beta.1.linux-amd64$ ./promtool check config prometheus.yml
Checking prometheus.yml
 SUCCESS: prometheus.yml is valid prometheus config file syntax
Restart Prometheus to re-read the confiugration file.
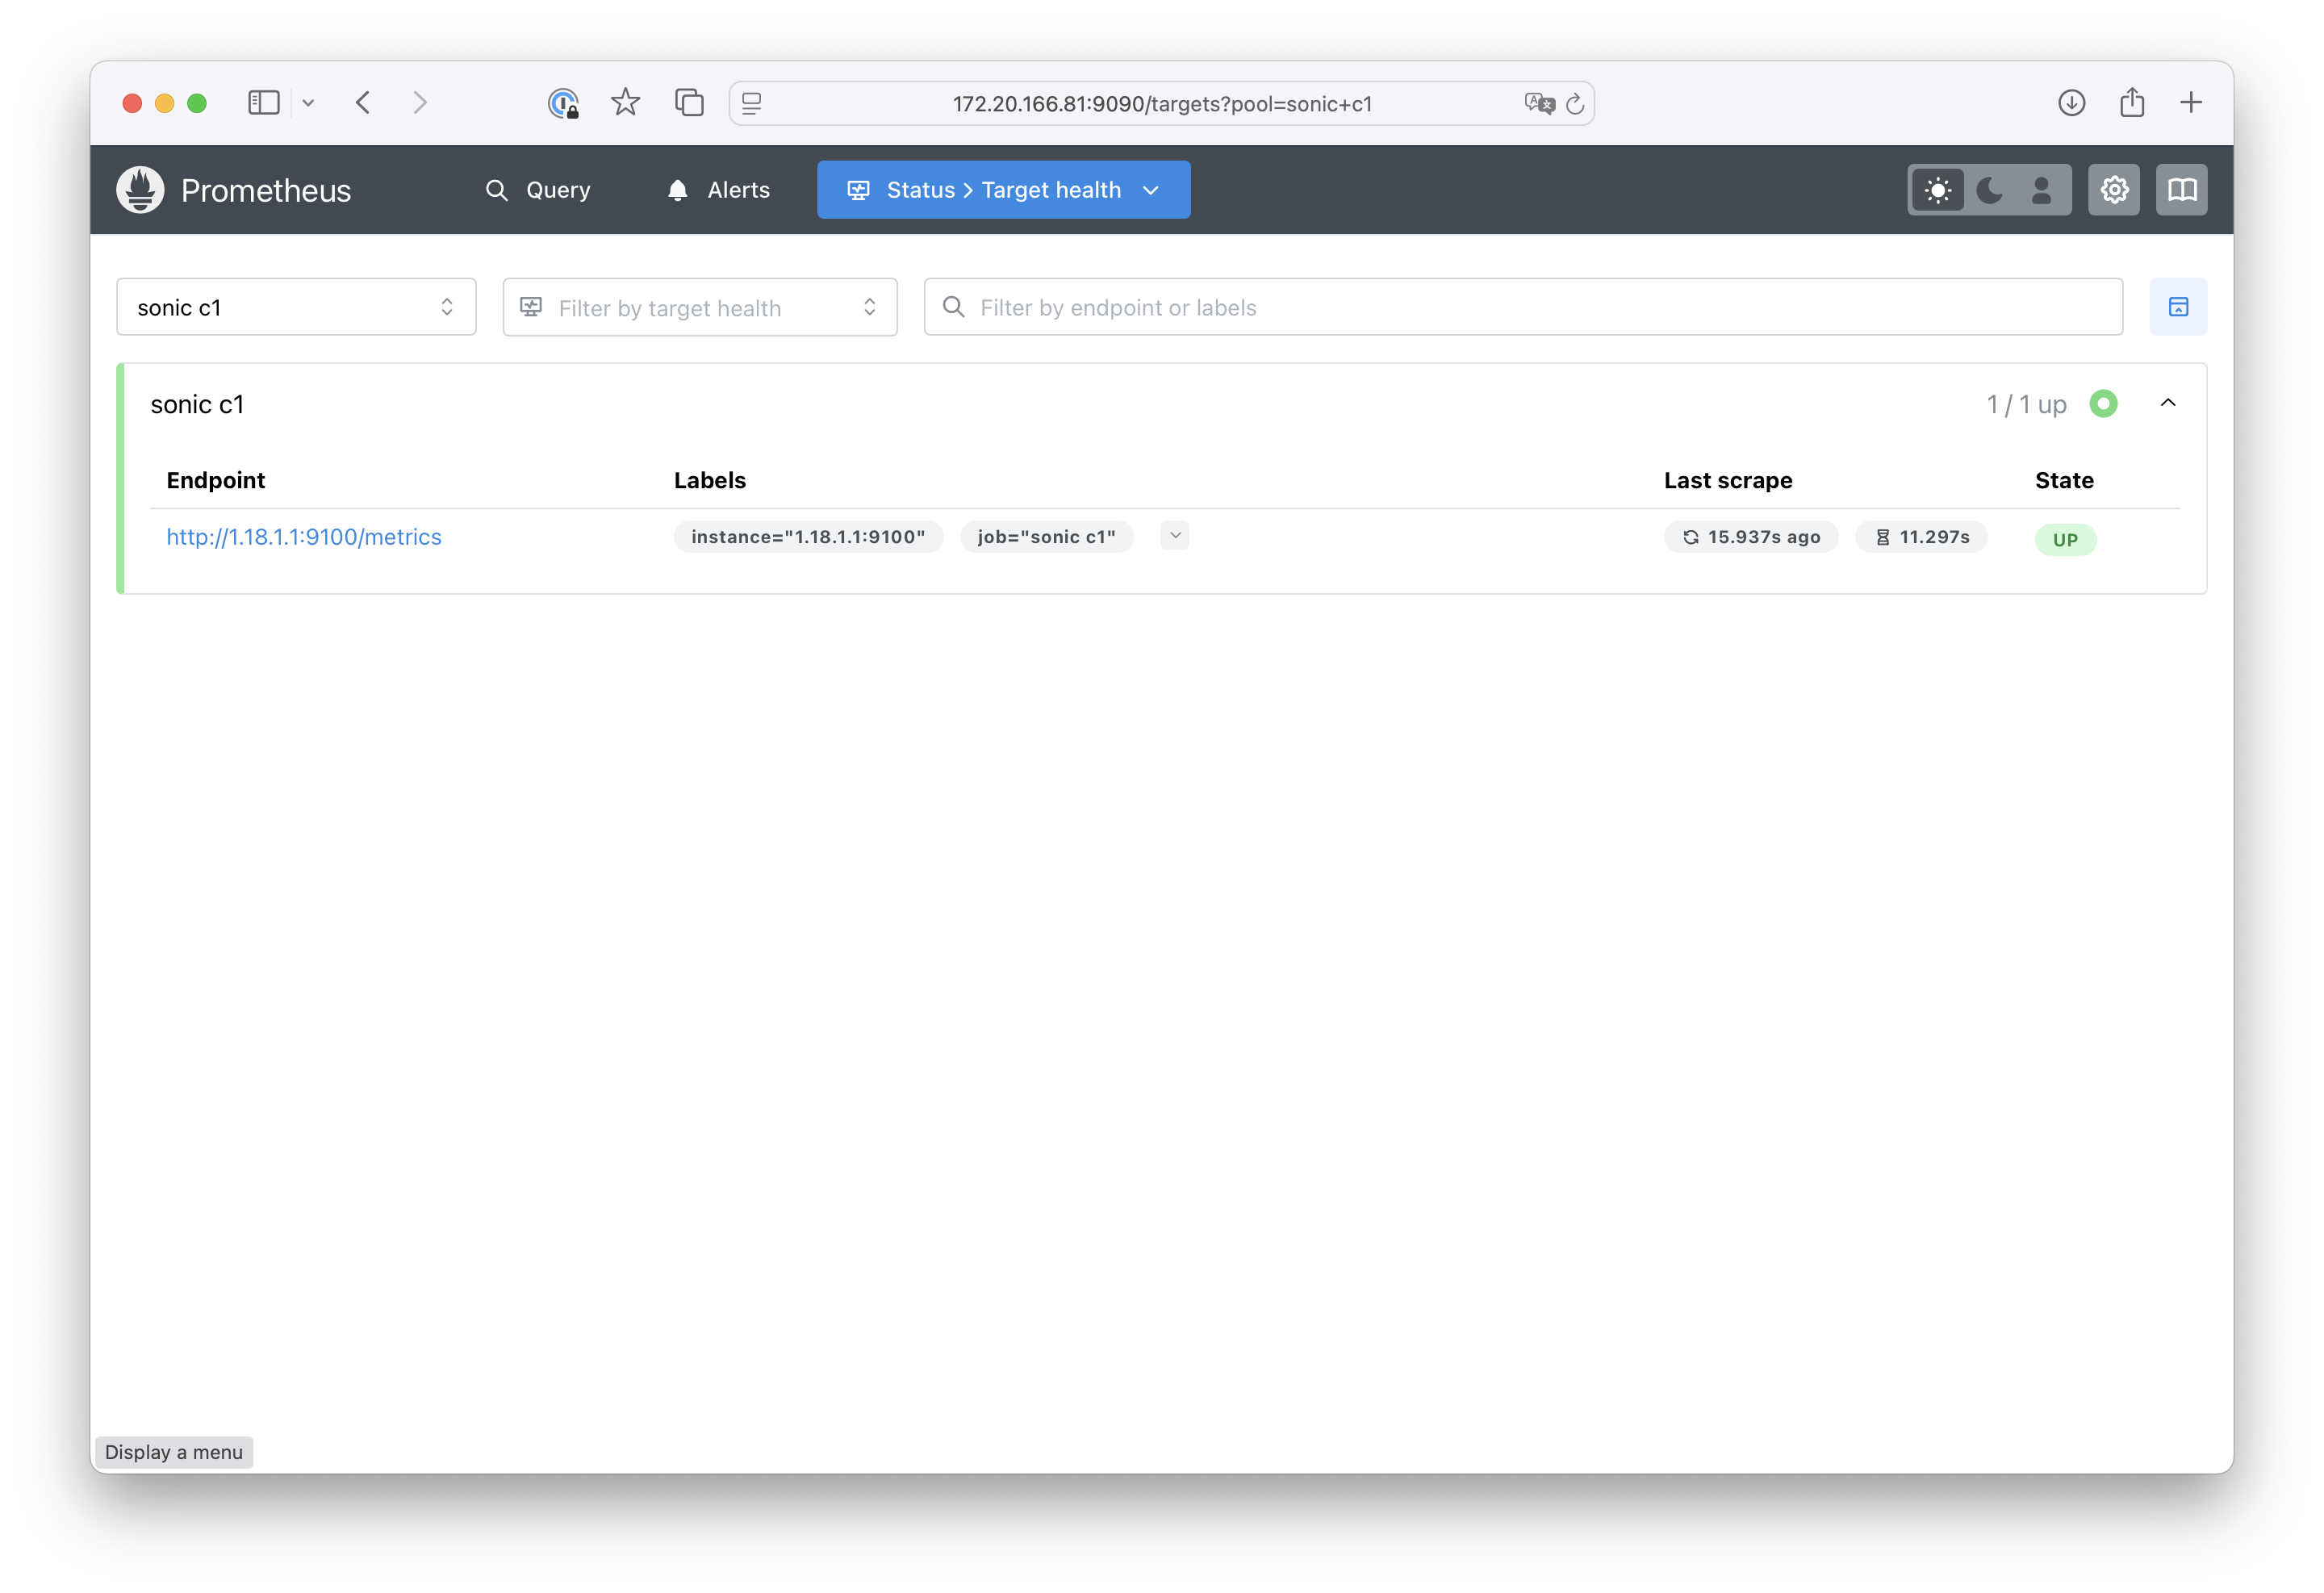
SONiC target is active
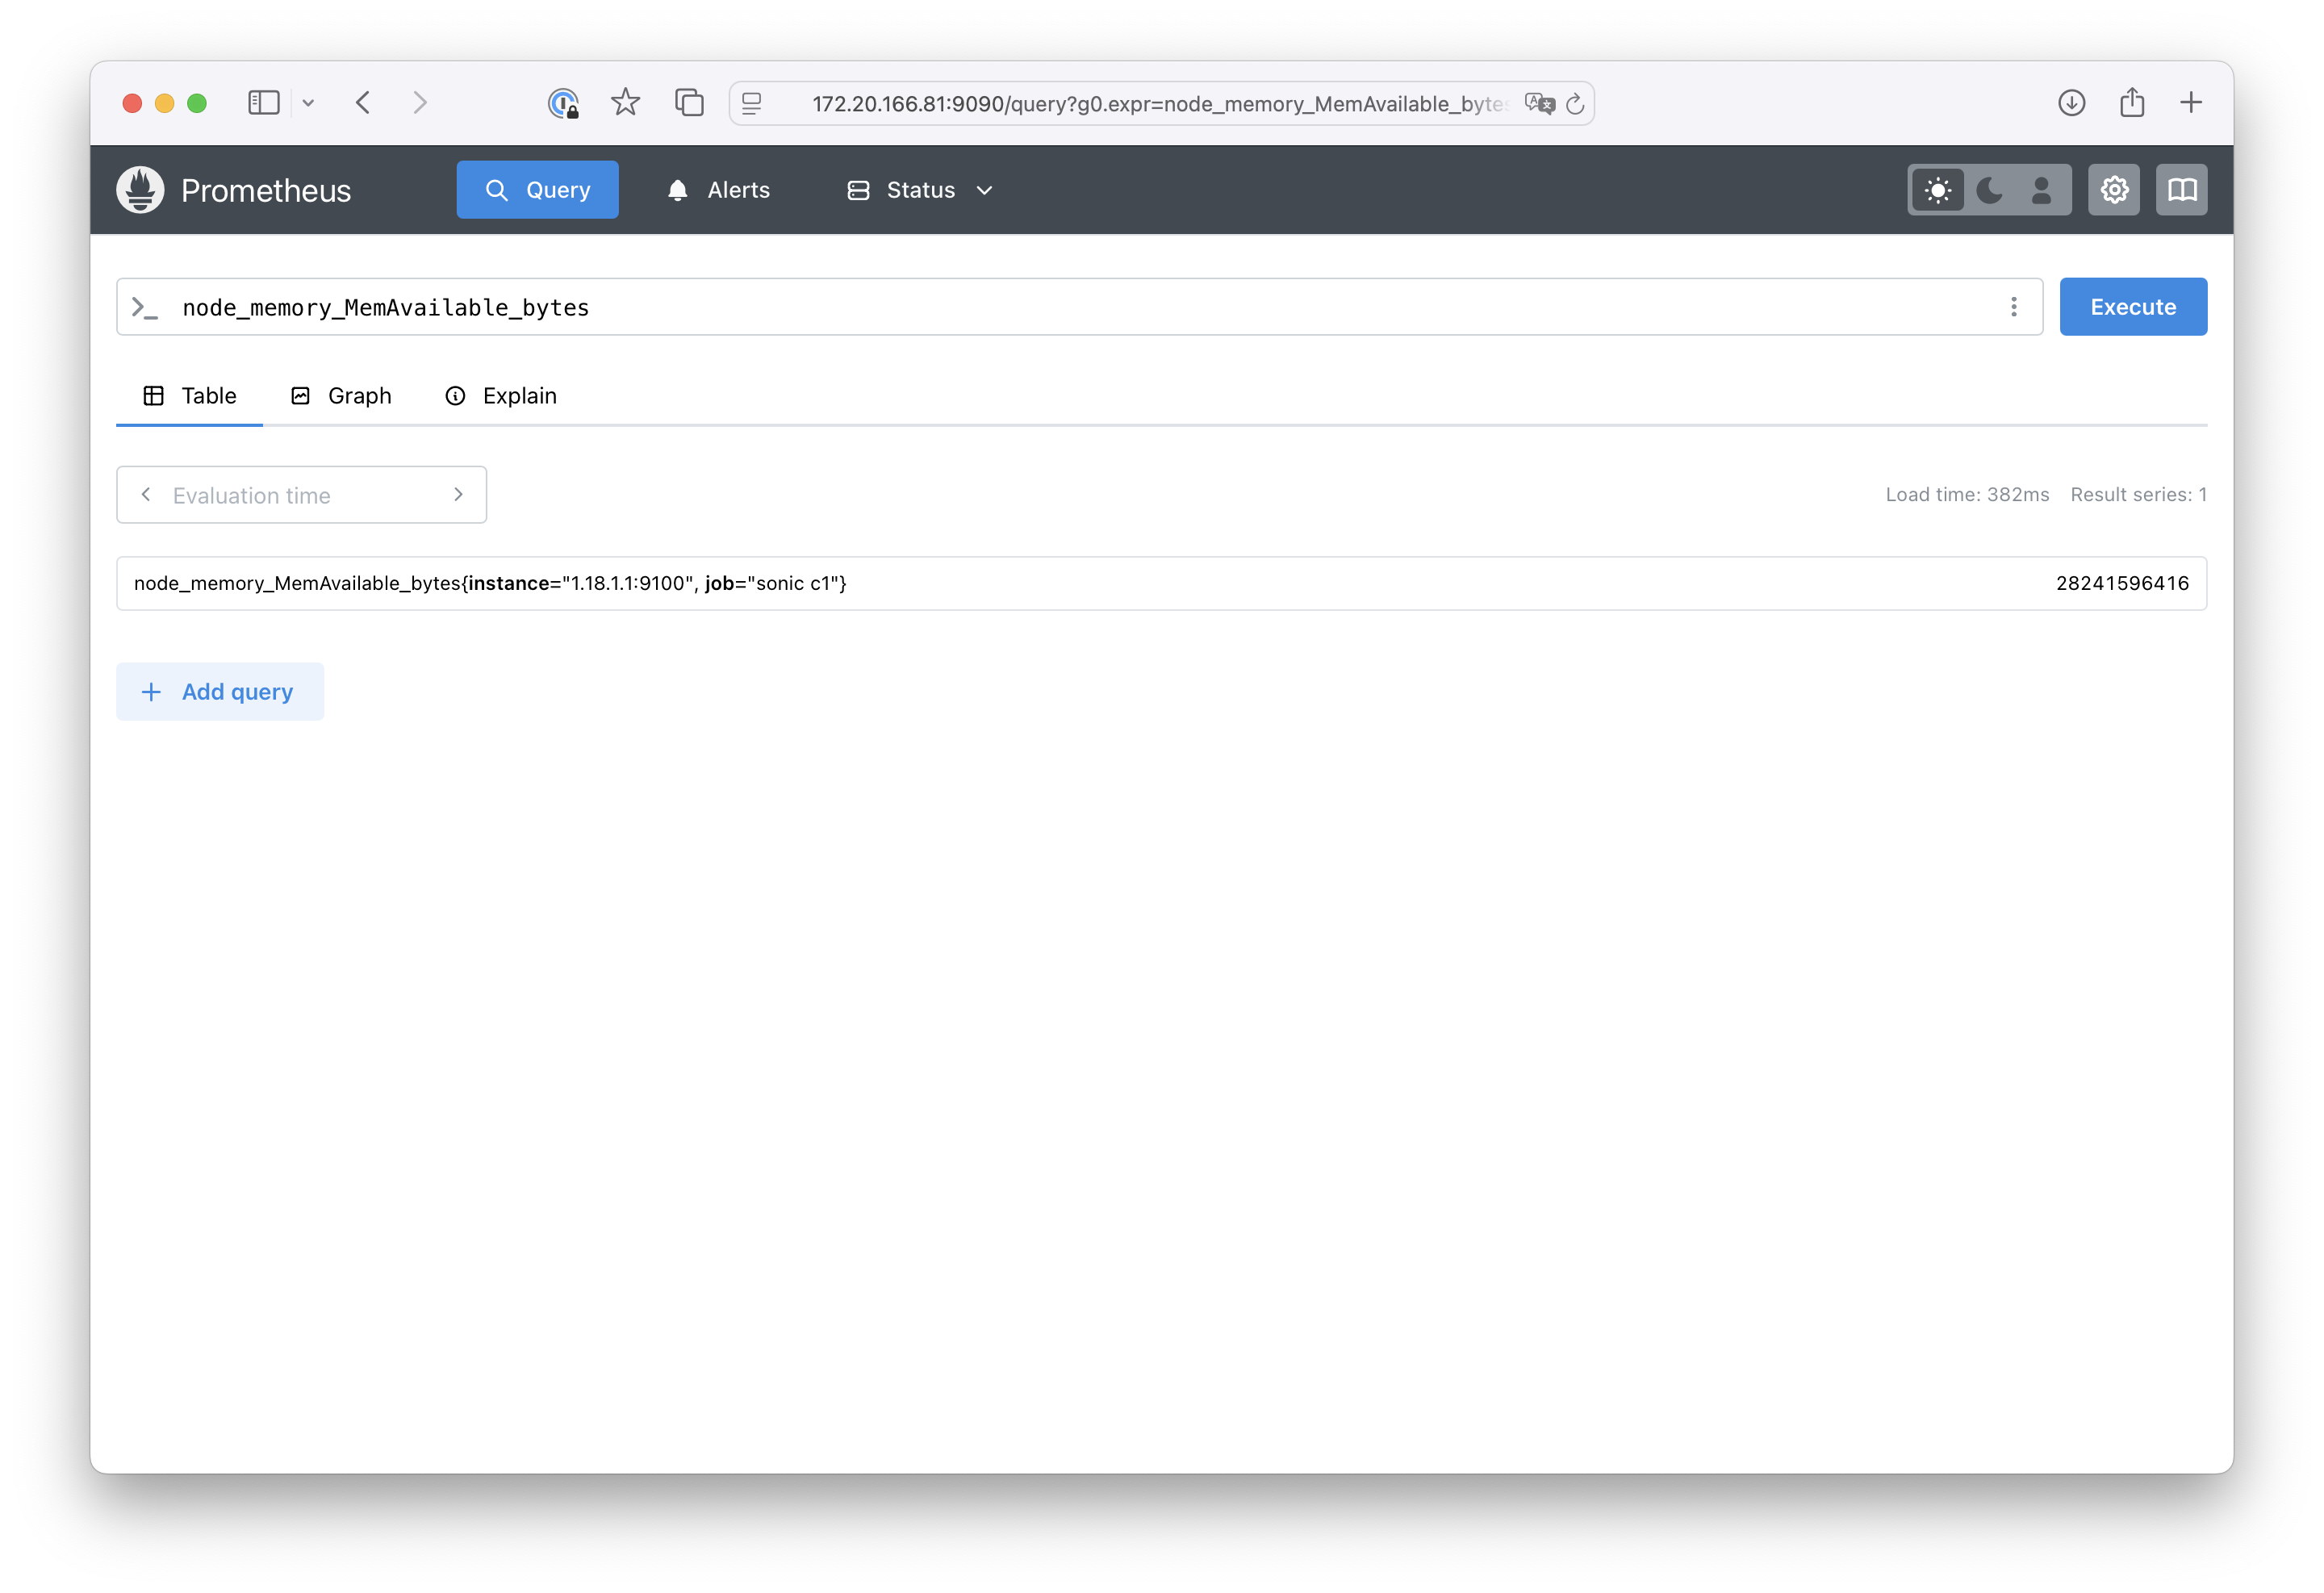
Memory Usage example
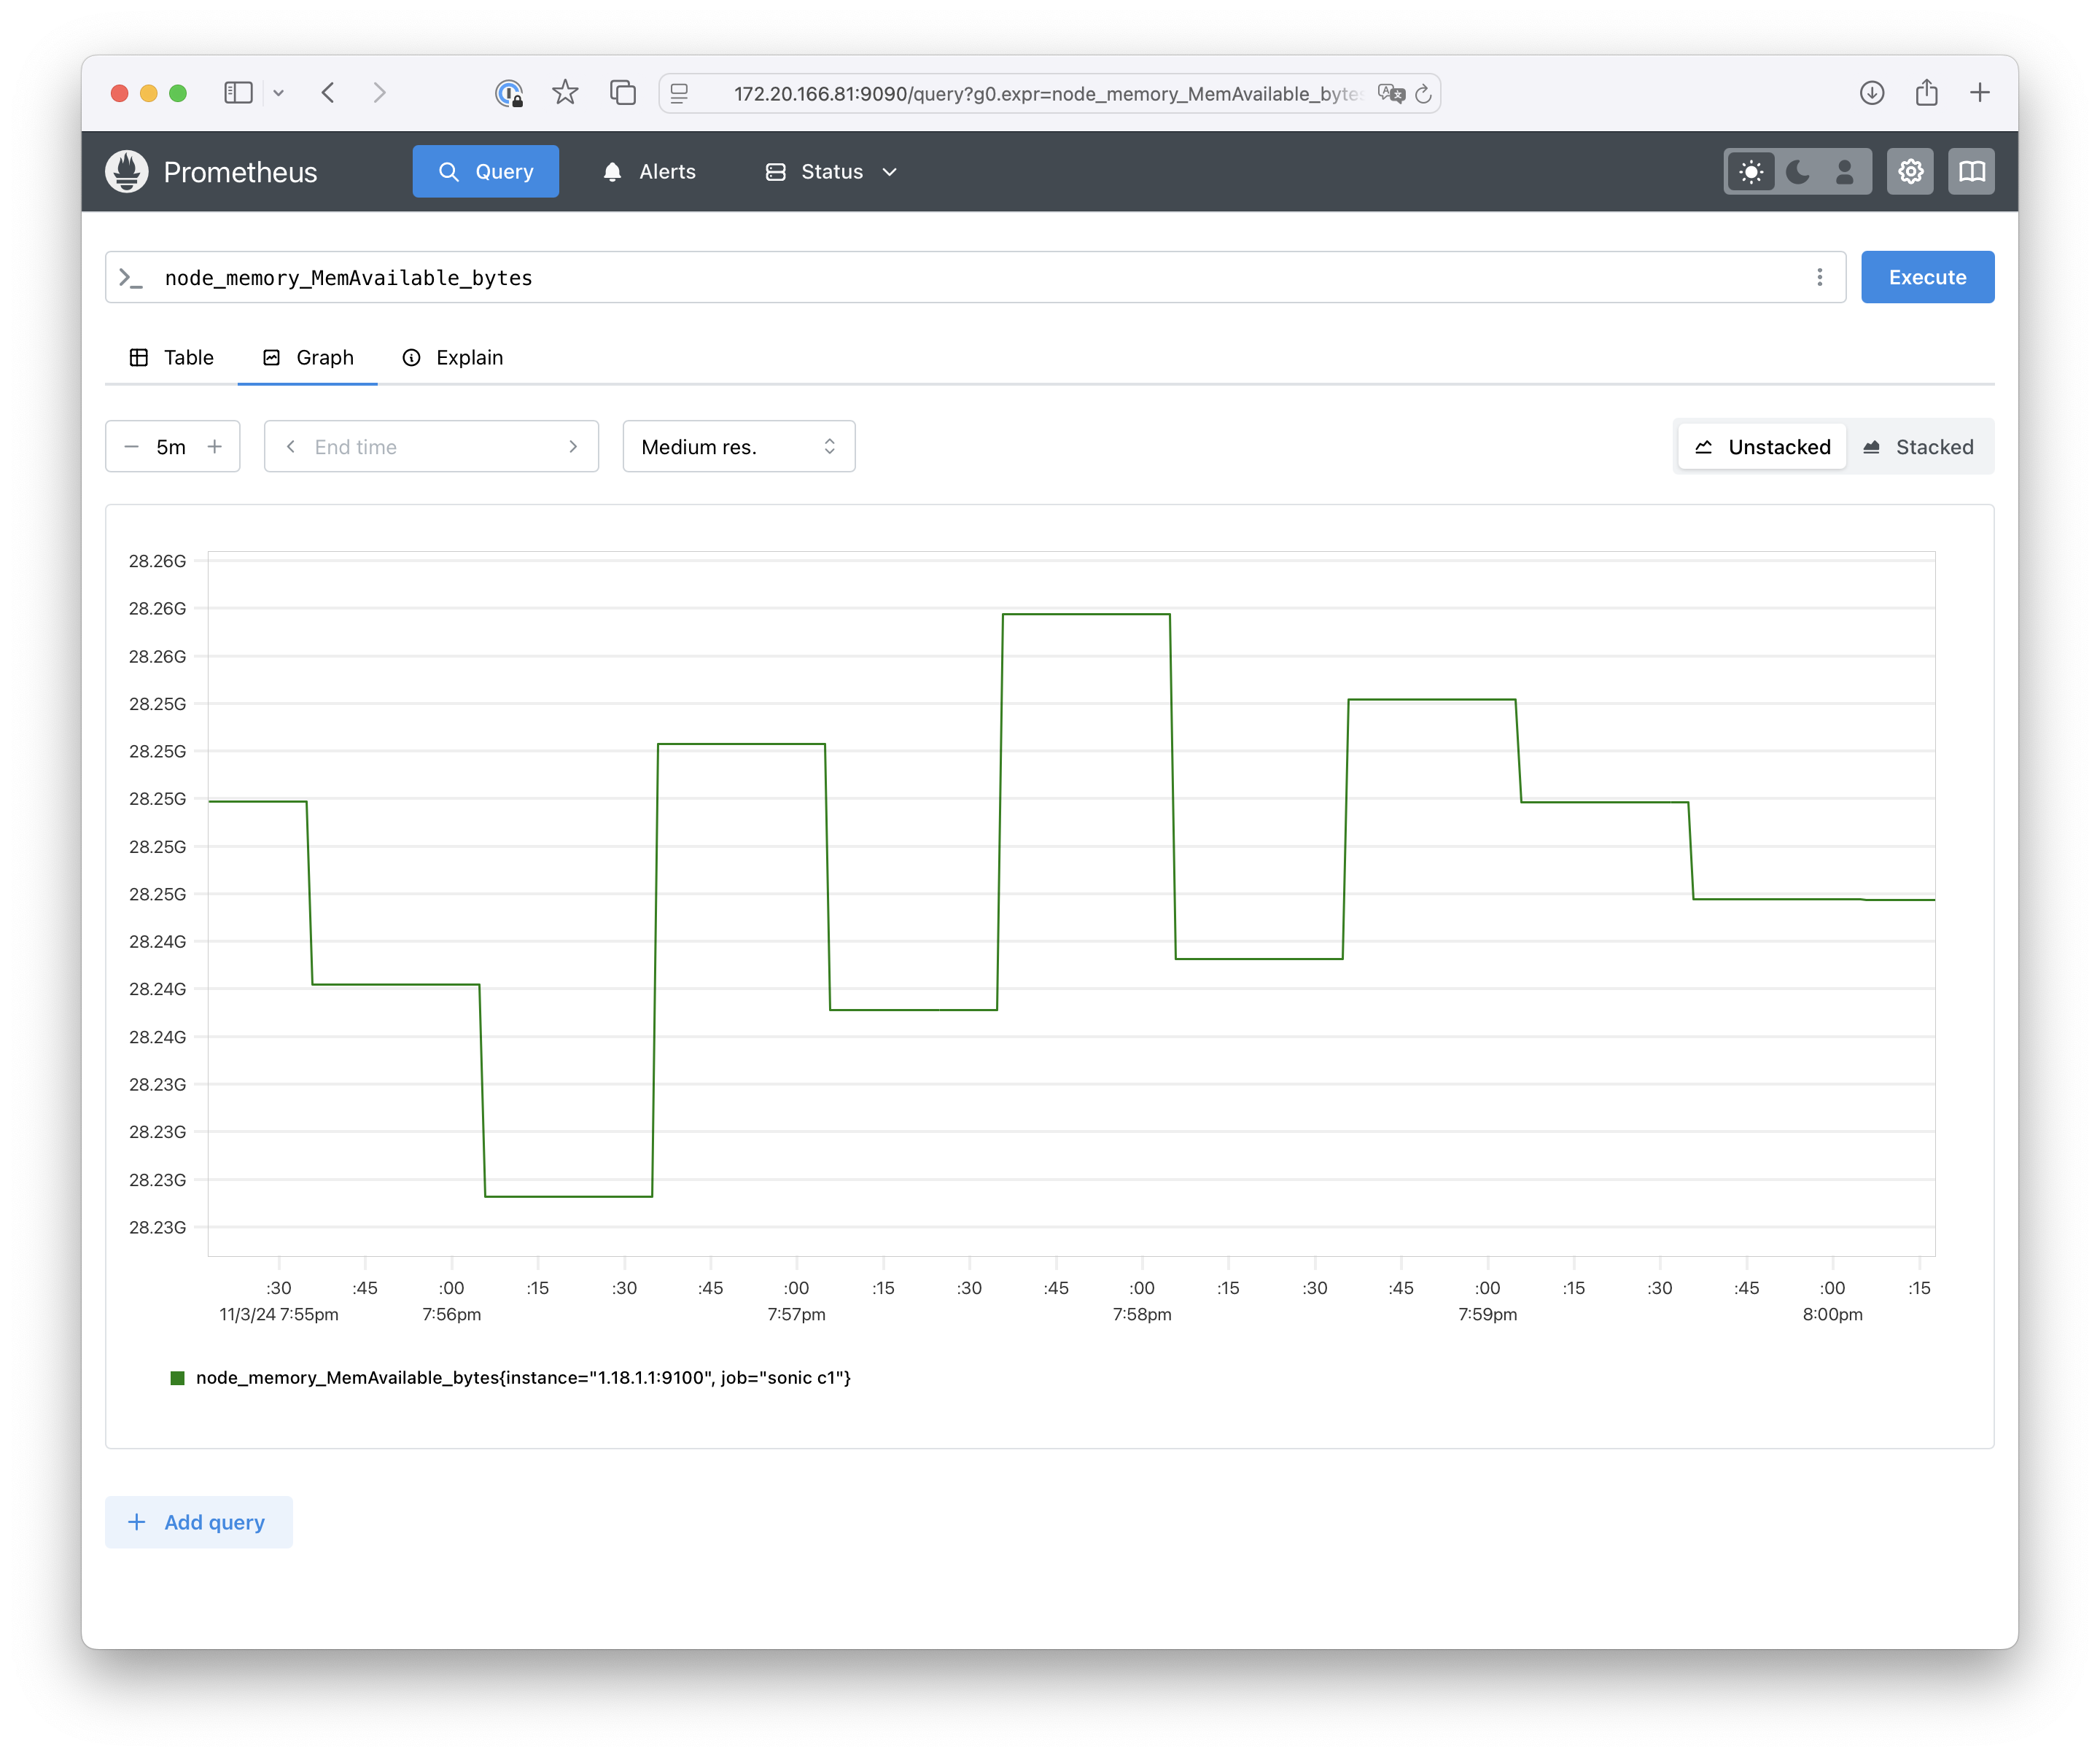
Open Query and run node_memory_MemAvailable_bytes request for example
Change to the Graph view:
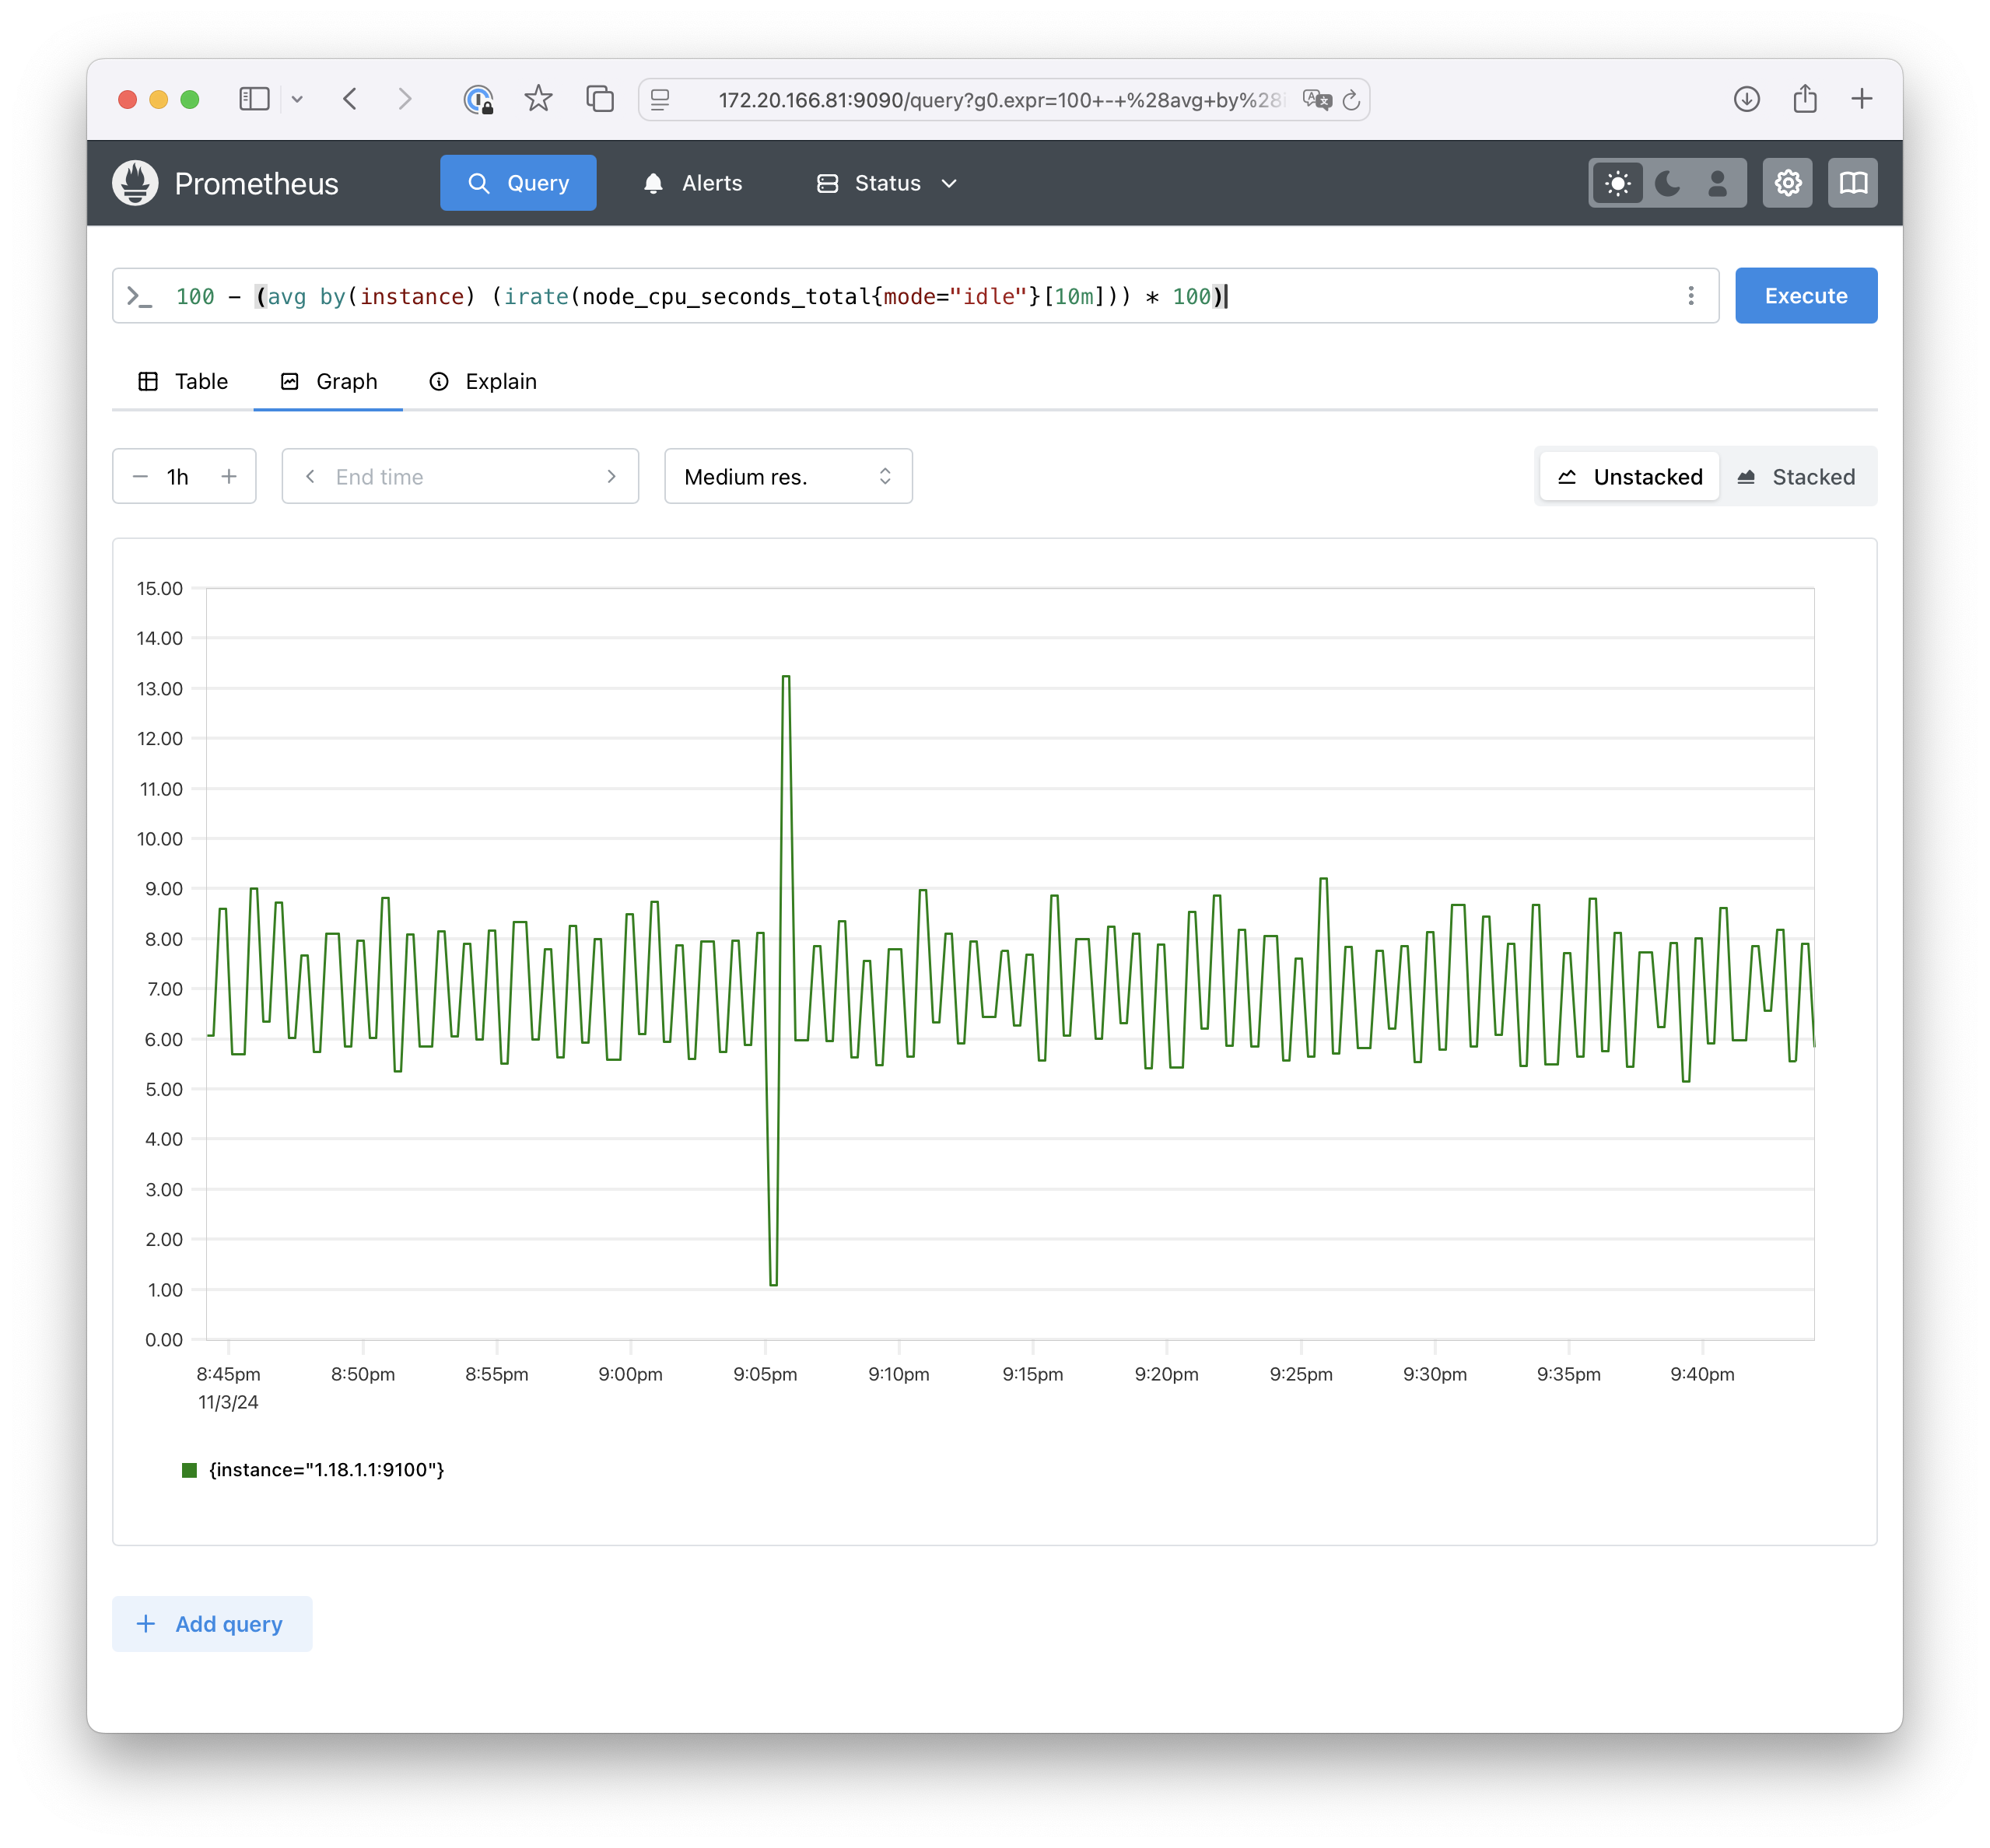
CPU Utilization example
The query: 100 - (avg by(instance) (irate(node_cpu_seconds_total{mode="idle"}[10m])) * 100)
Configuration Reload
Prometheus can reload its configuration at runtime. If the new configuration is not well-formed, the changes will not be applied. A configuration reload is triggered by sending a SIGHUP to the Prometheus process or sending a HTTP POST request to the /-/reload endpoint (when the –web.enable-lifecycle flag is enabled). This will also reload any configured rule files. https://prometheus.io/docs/prometheus/latest/configuration/configuration/
SIGHUP
Find the process ID
pgrep prometheus
2149334
Reload the config
kill -s SIGHUP 2149334
POST request
curl -X POST http://172.20.166.81:9090/-/reload
Debug
Prometheus debug endpoints /debug/pprof
http://172.20.166.81:9090/debug/pprof/
Conclusion
The article demonstrates a practical approach to monitoring SONiC devices using Prometheus, even though Prometheus does not natively support the gNMI streaming protocol.
While gNMI offers high-performance telemetry for SONiC, the method outlined in this article provides a viable and effective way to leverage Prometheus’s monitoring capabilities for SONiC devices.
Leave a Comment