
Getting Started with Crosswork Planning Design
Overview
Crosswork Planning provides a comprehensive suite of tools to empower operators to manage their network infrastructure proactively. These tools offer network discovery, analysis, simulation, and optimization capabilities. With Crosswork Planning, operators can unlock a host of benefits, including enhanced visibility and insights, improved performance, reliability, and resiliency, and efficient capacity management.
The Design application may be used to visualize topology, run simulations as well as perform optimizations and uses network models which has been created prior, or built using the Collector application.
This tutorial provides a sampler of some of the features available in Crosswork Planning Design. The exercises in this lab may be run using the following dCloud Lab: Crosswork Planning 7.0 (1n) with KVM Topology (3n)
Note: Please ensure that Smart Licensing has been setup prior to trying the exercises in this tutorial.
Getting acquainted with Crosswork Planning Design
Your task is to use an unprocessed network model (i.e. unprocesssed-lab.pln) in the Crosswork Planning Design application to do the following:
- Logically group nodes to make the topology easy to navigate
- Create a traffic simulation using measured data from the network
Note: Some tasks in this exercise are usually performed during the collection and model building process of the Crosswork Planning server. The Crosswork Planning Design application is used in this exercise to demonstrate step-by-step details of that process.
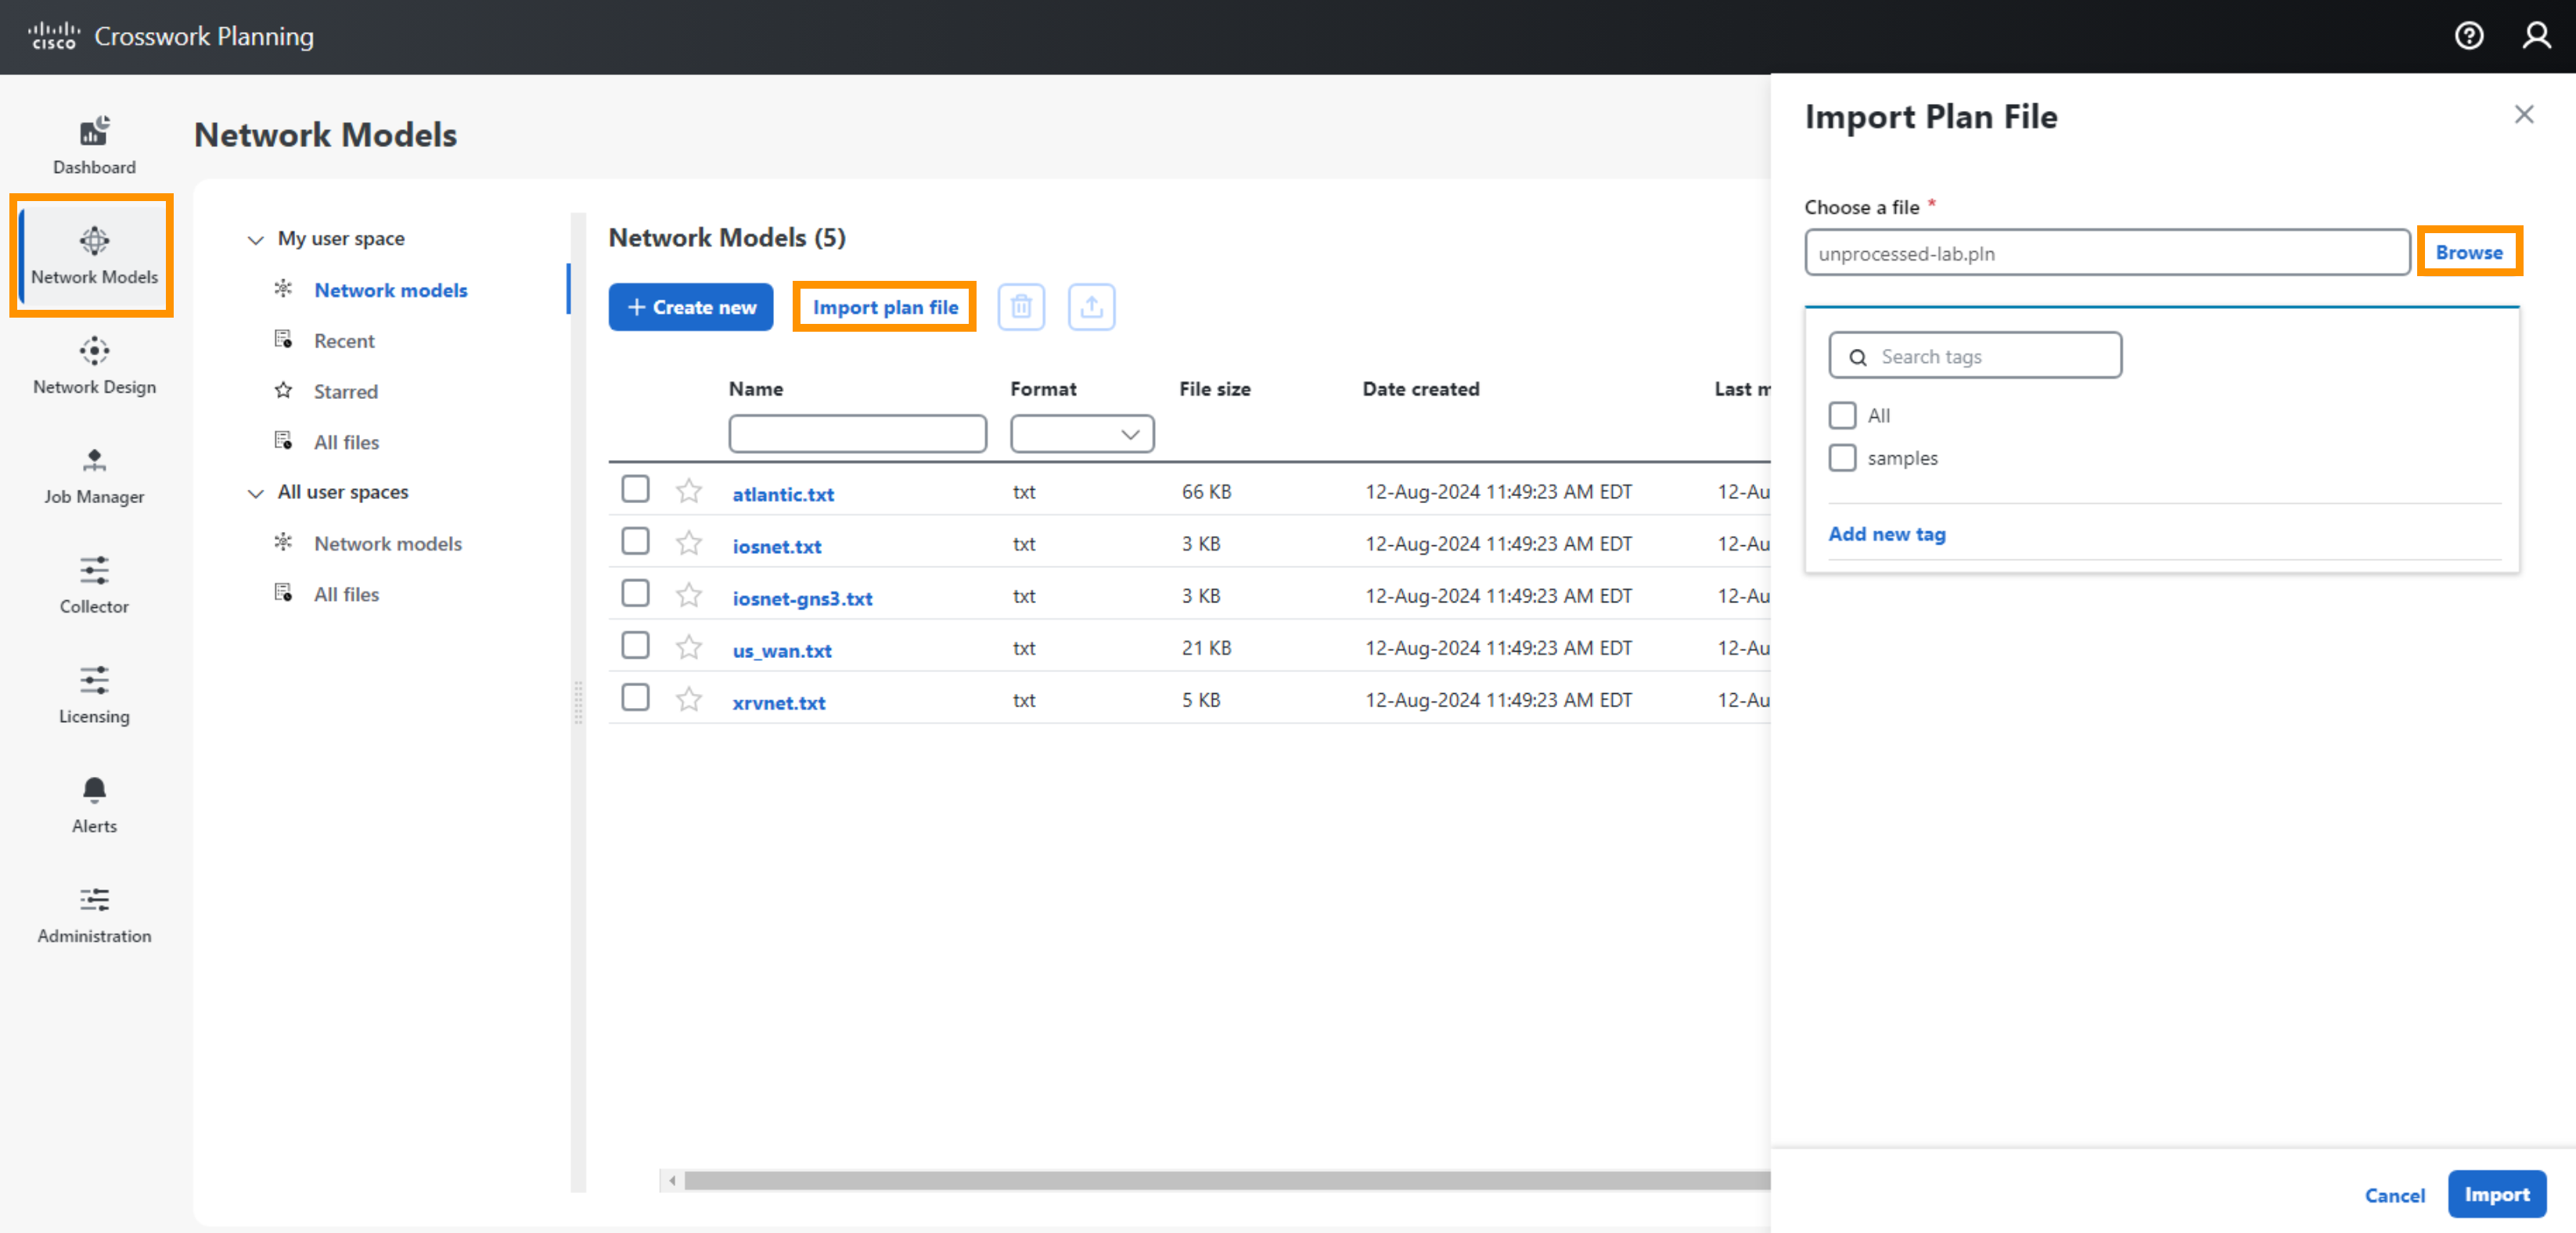
Step 1 - Import Network Model in Design
The first step is to import the network model from your desktop to Crosswork Planning. This is performed by going to Network Models > Import Plan File. Use the Browse button to select the plan file from your desktop. Once the network model has been imported successfully, it may be found under Network Models > My user space > Network Models.
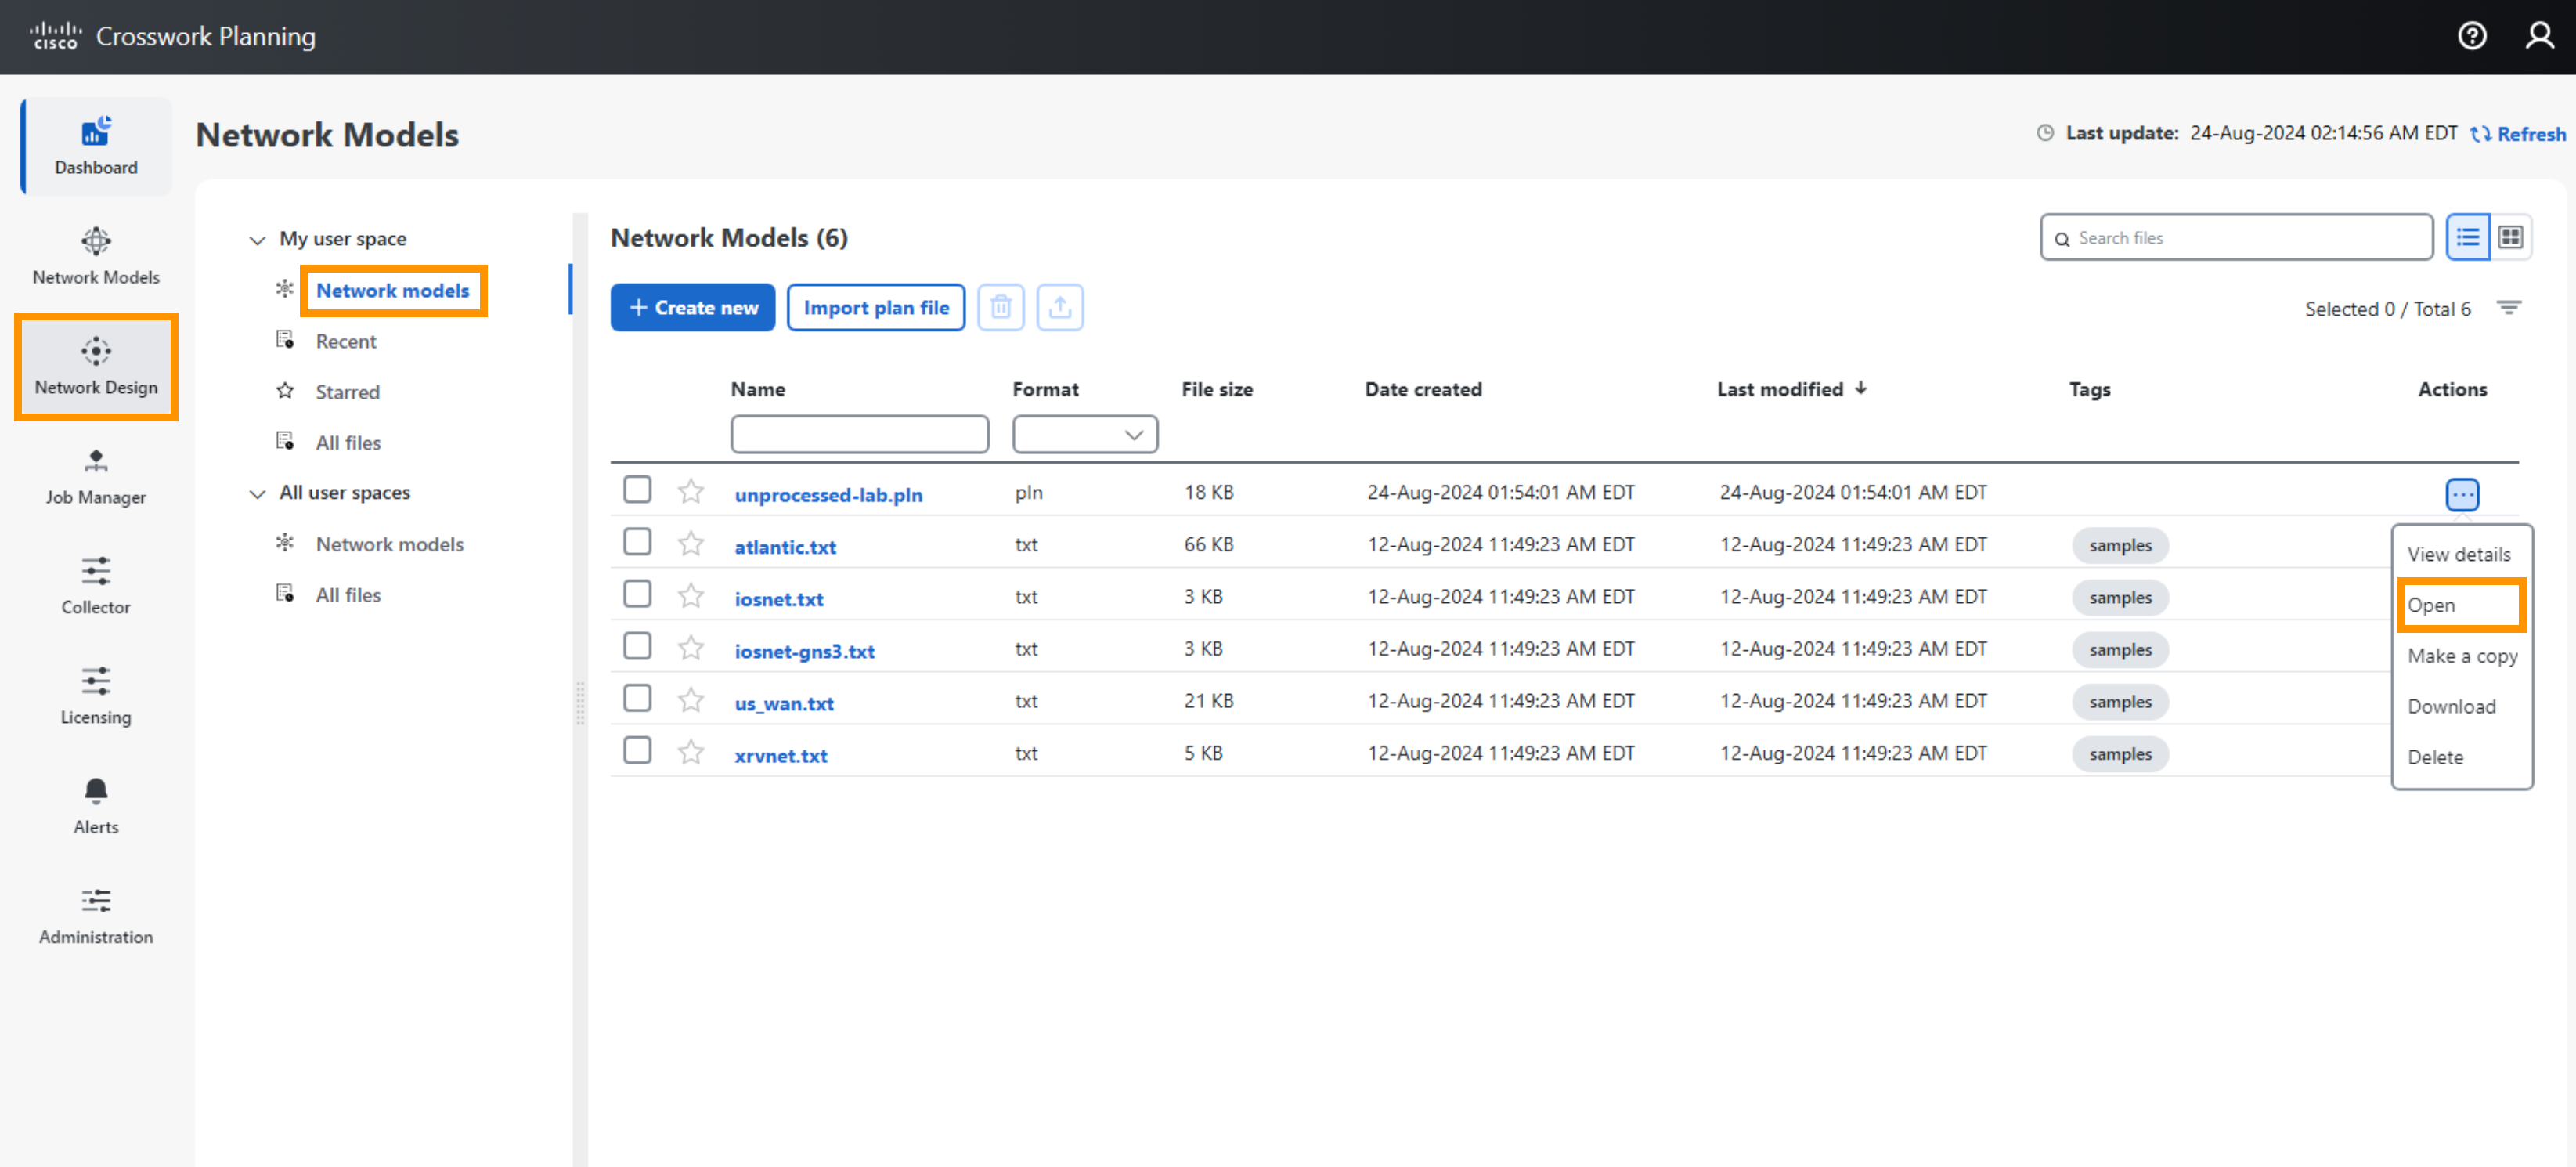
Step 2 - Open Network Model in Design
Go to Network Design, under My user space > Network models, open the network model imported earlier. Select the ellipsis […] icon under the Action column for unprocessed-lab.pln. Select Open.
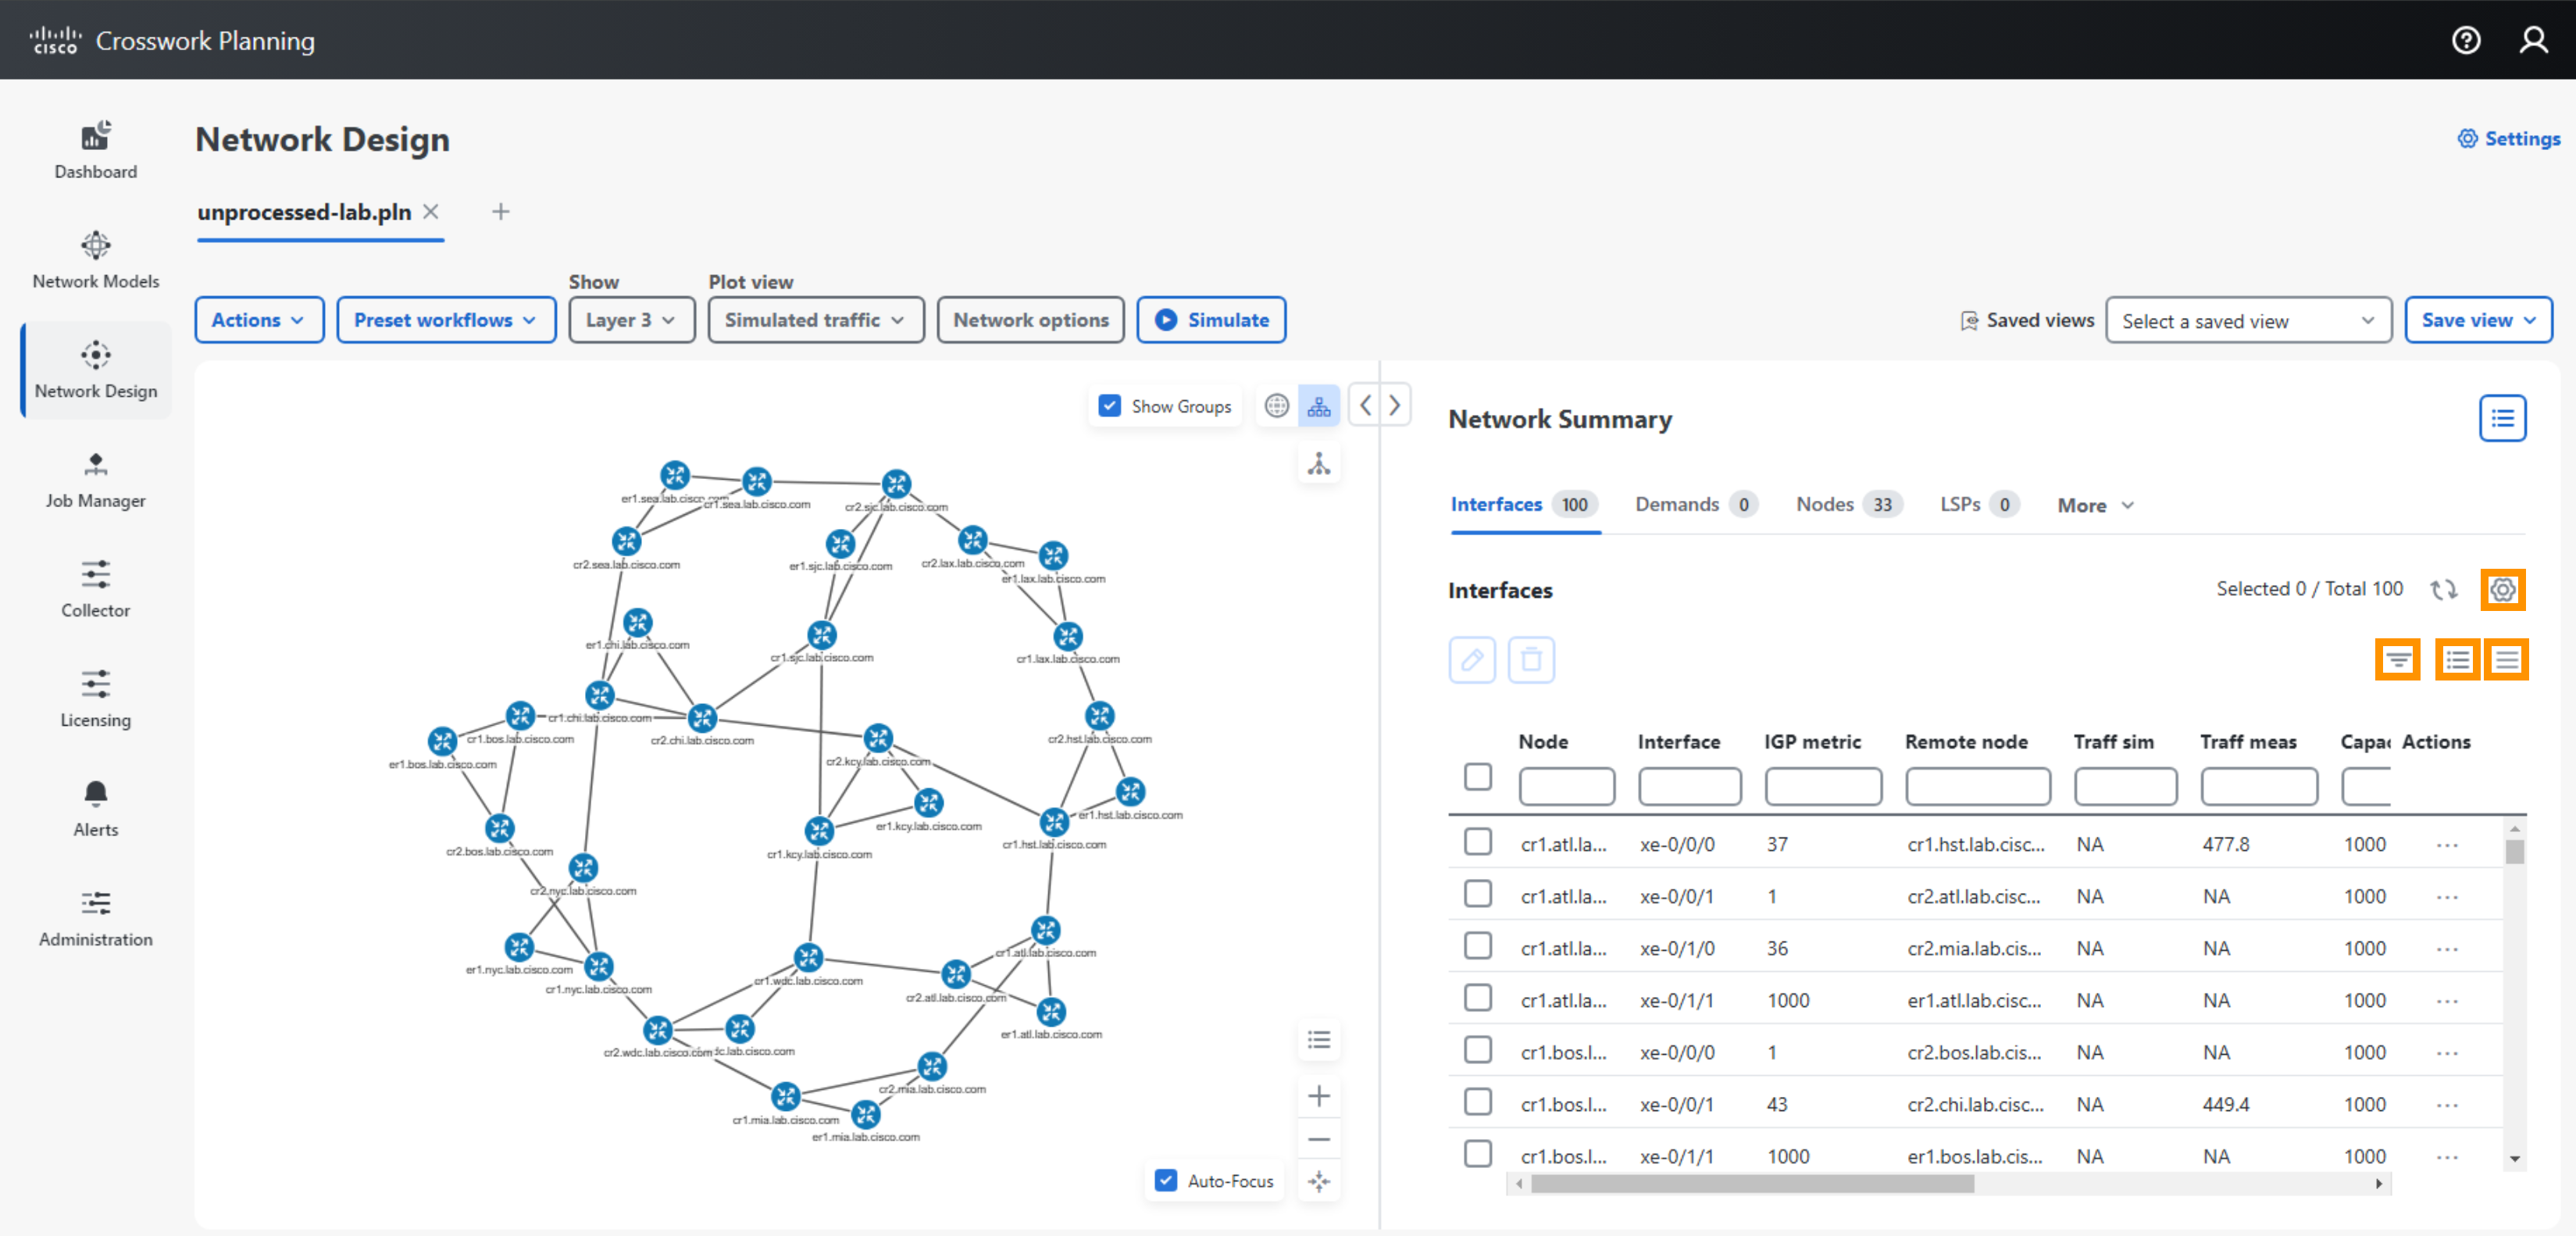
After the file opens take note of the following:
- You are looking at a multivendor network. Crosswork Planning supports collection from Cisco, Juniper, Alcatel Lucent and Huawei.
- The network plot should show nodes connected by circuits. A circuit is made up of two directly connected interfaces.
- You can select and drag nodes to change their position.
- You can select the settings icon to show/hide tables, floating filter, Advanced filter, and Cross table filter to see available actions, or to filter to related objects.
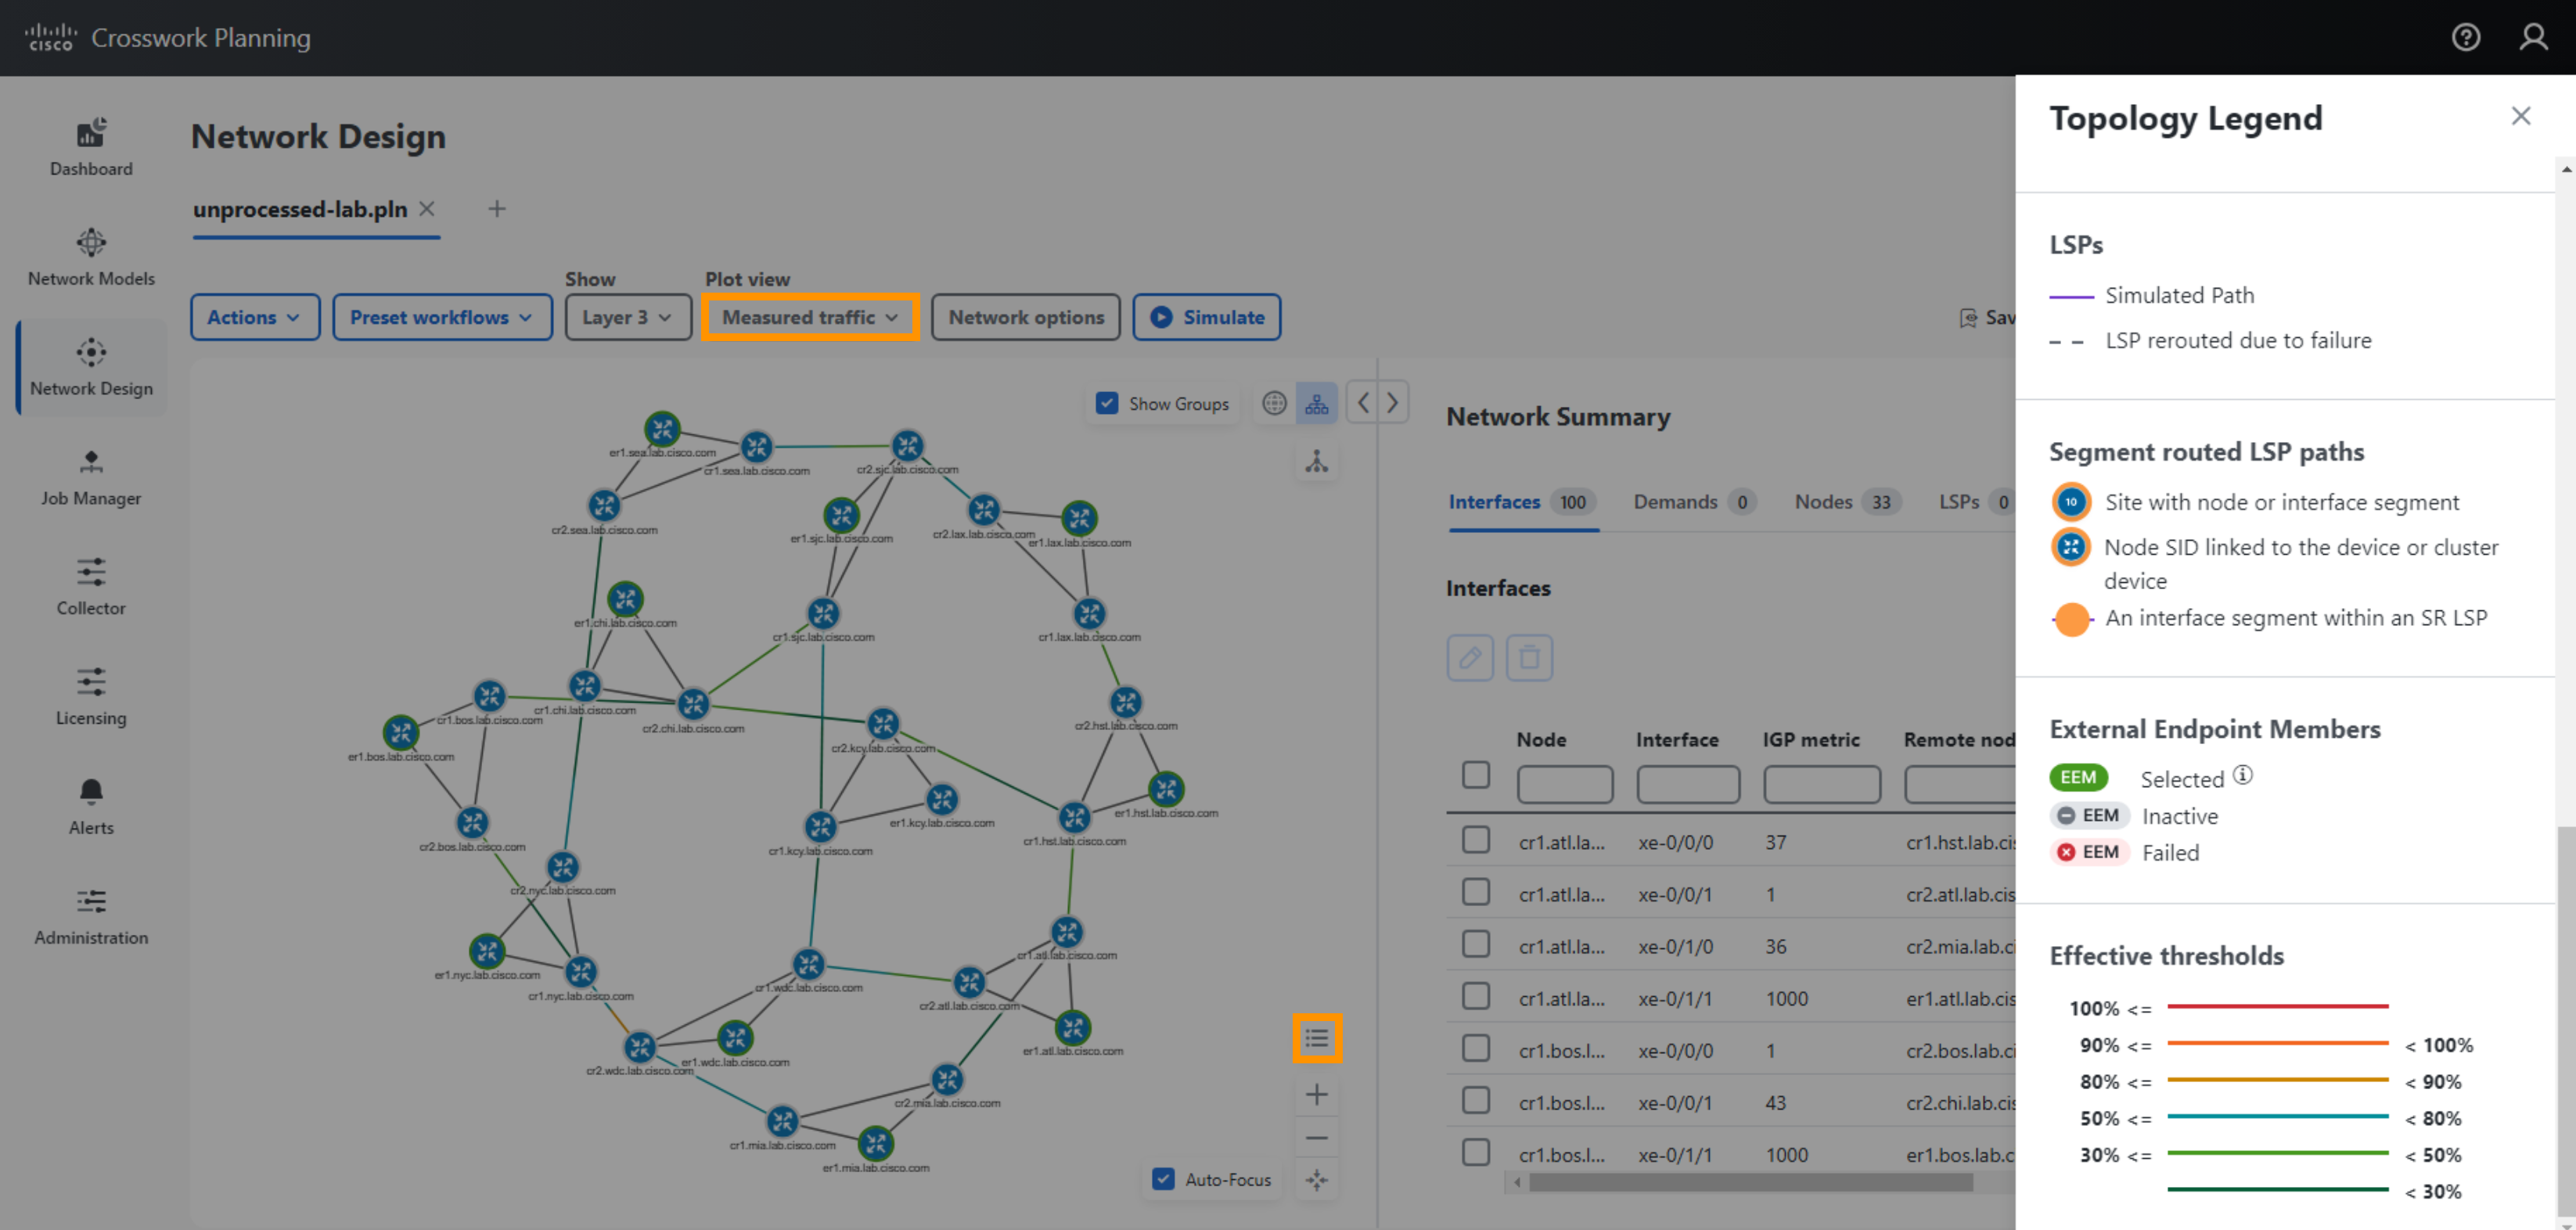
- You may select the Plot view to reflect Simulated Traffic, or Measured Traffic. Select the Measured Traffic view. For now this traffic view should be the only selection that has colors appear on the interfaces.
- The colors on the interfaces and the amount they are filled represent the measured egress traffic collected.
- You may select the Topology Legend icon to display the legend, and colors used to indicate different link traffic utilization levels. Hint: You may have to scroll to the bottom of the page to display the colors used for different link traffic utilization levels.
- The measured data in the model represents the period from which the data was collected from the network. This is the model used in the Crosswork Planning Design application.
Logically Group Nodes
The Crosswork Planning network model allows you to group nodes together in a “site”. Additionally you can group a site in another site. The flexibility enables you to make complicated topologies simple and easy to navigate.
You can create a new site by selecting Insert->Site then assigning nodes to the site. However, by examining the node hostnames it becomes apparent the first stanza represents the node function, the second represents the node group and the third is the hostname suffix, which is the same for all nodes.
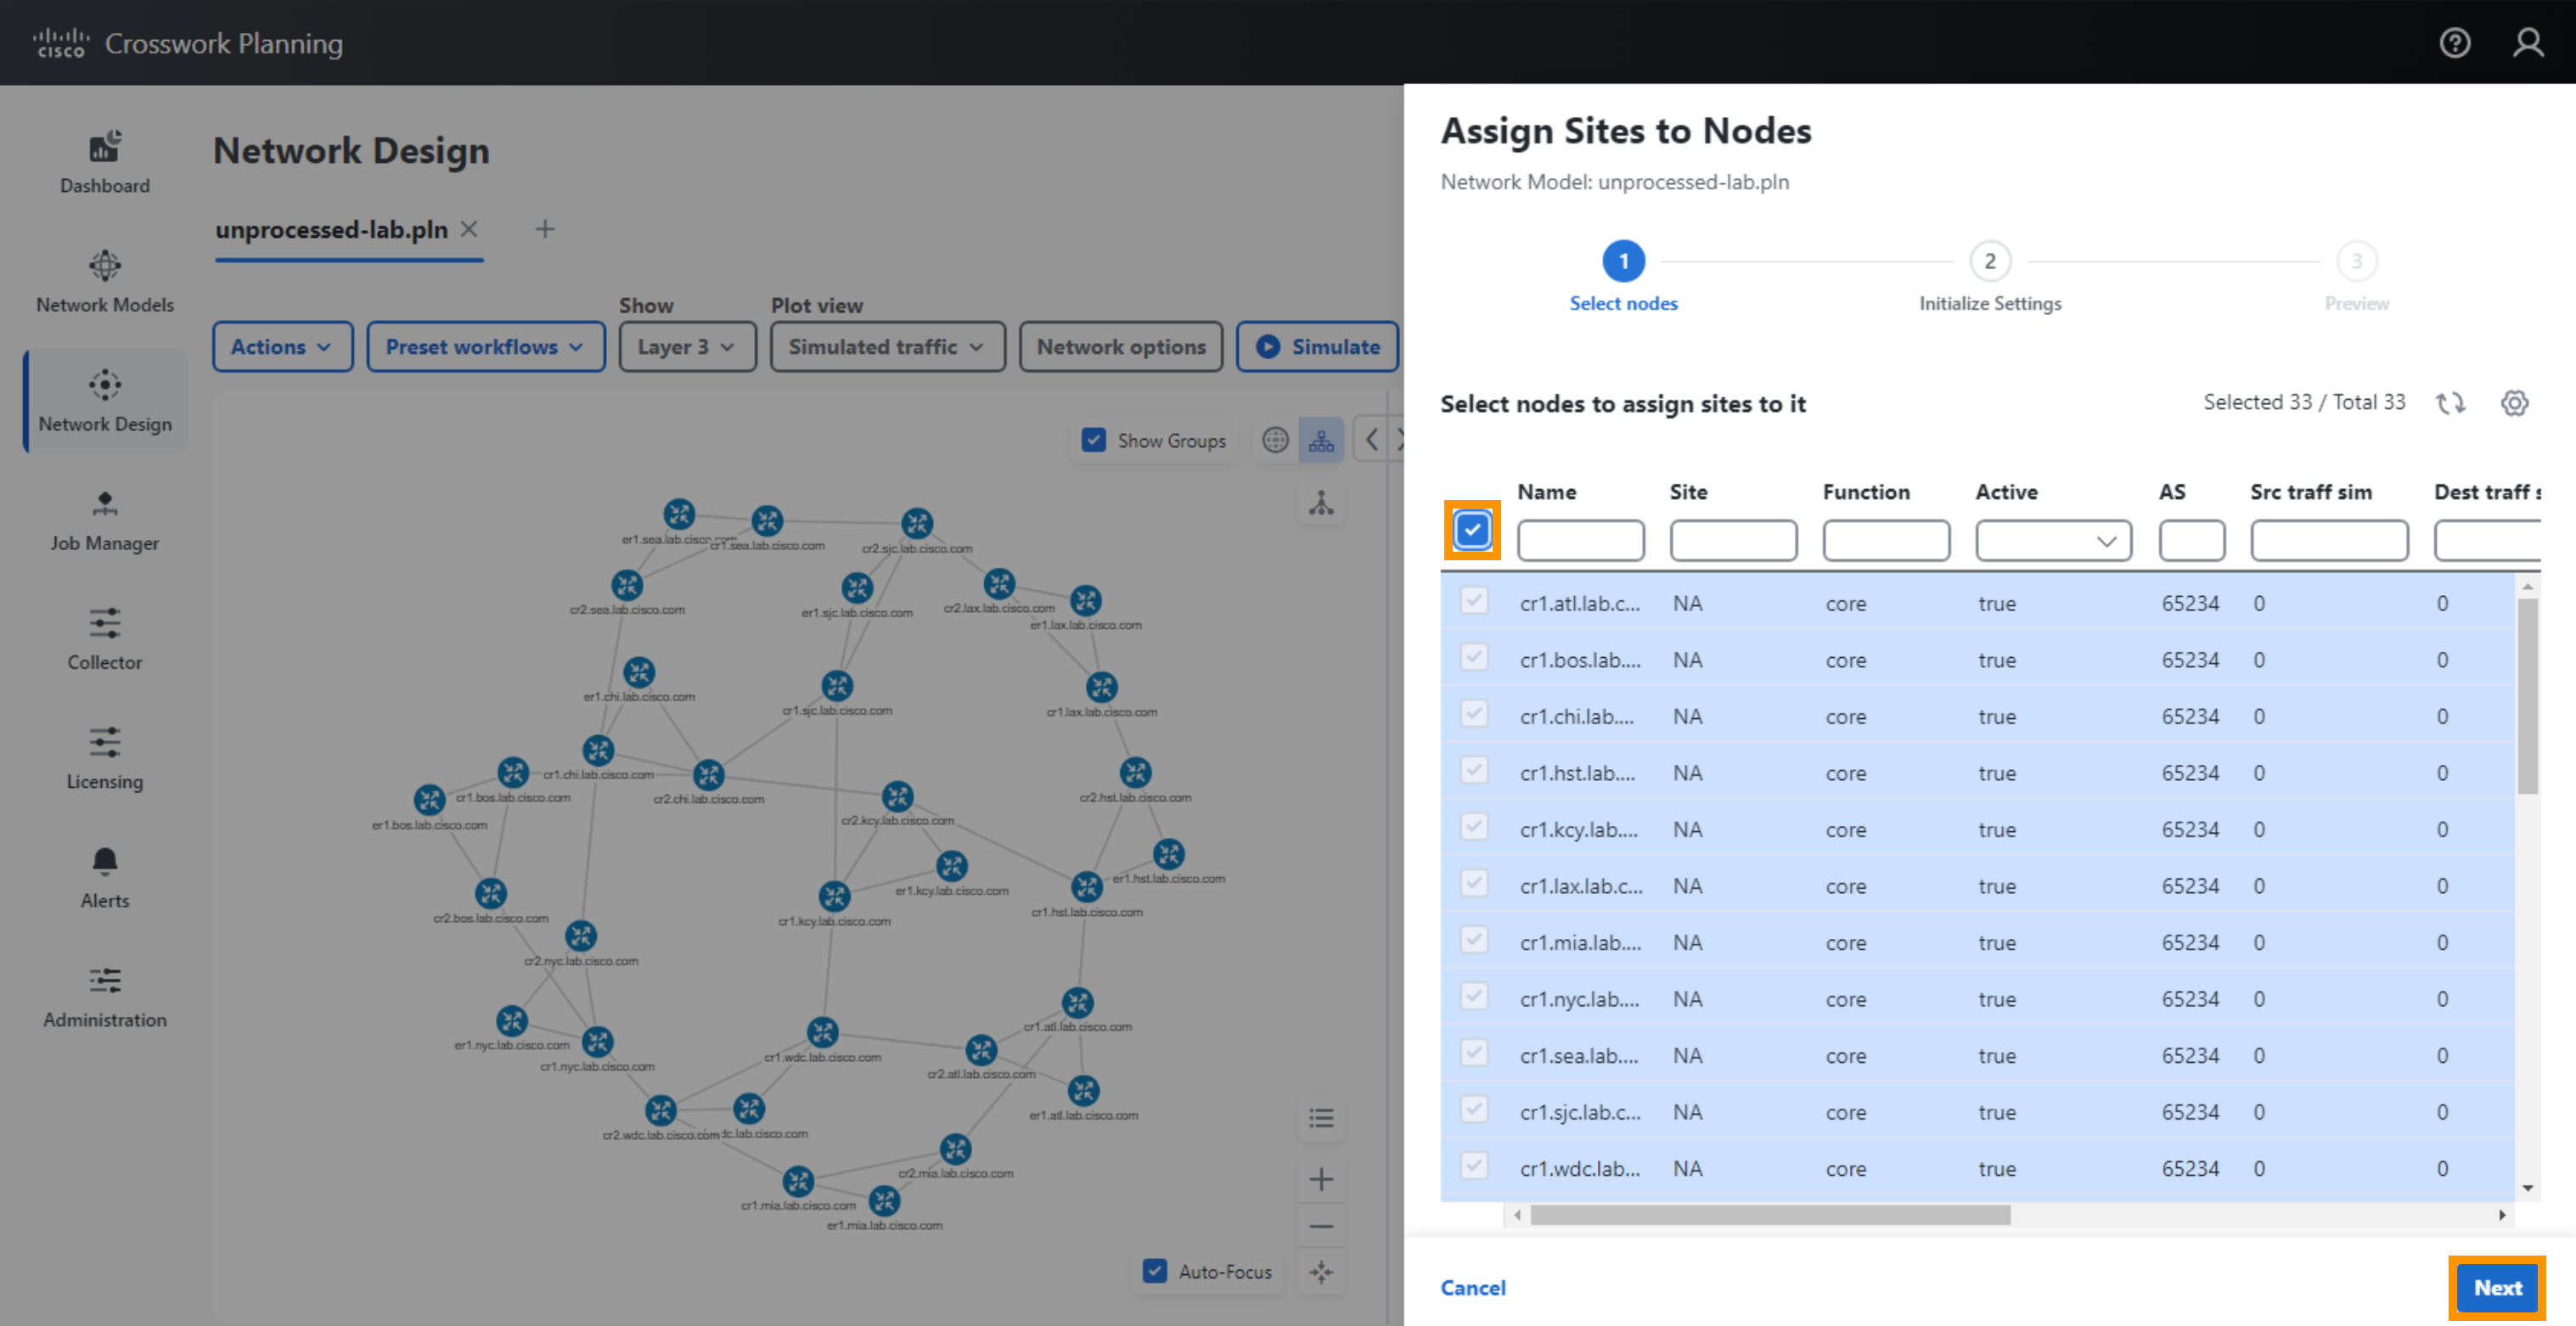
Step 3 Assign Nodes to Sites
Select Actions > Initializers > Assign Sites to Nodes.
First select all nodes by selecting the checkbox as shown.
In the Nodes to Site Mapping Rules the delimiters being used are
.-and:. Since a.is being used to separate the nodes function and location, in the Site name: field use$2.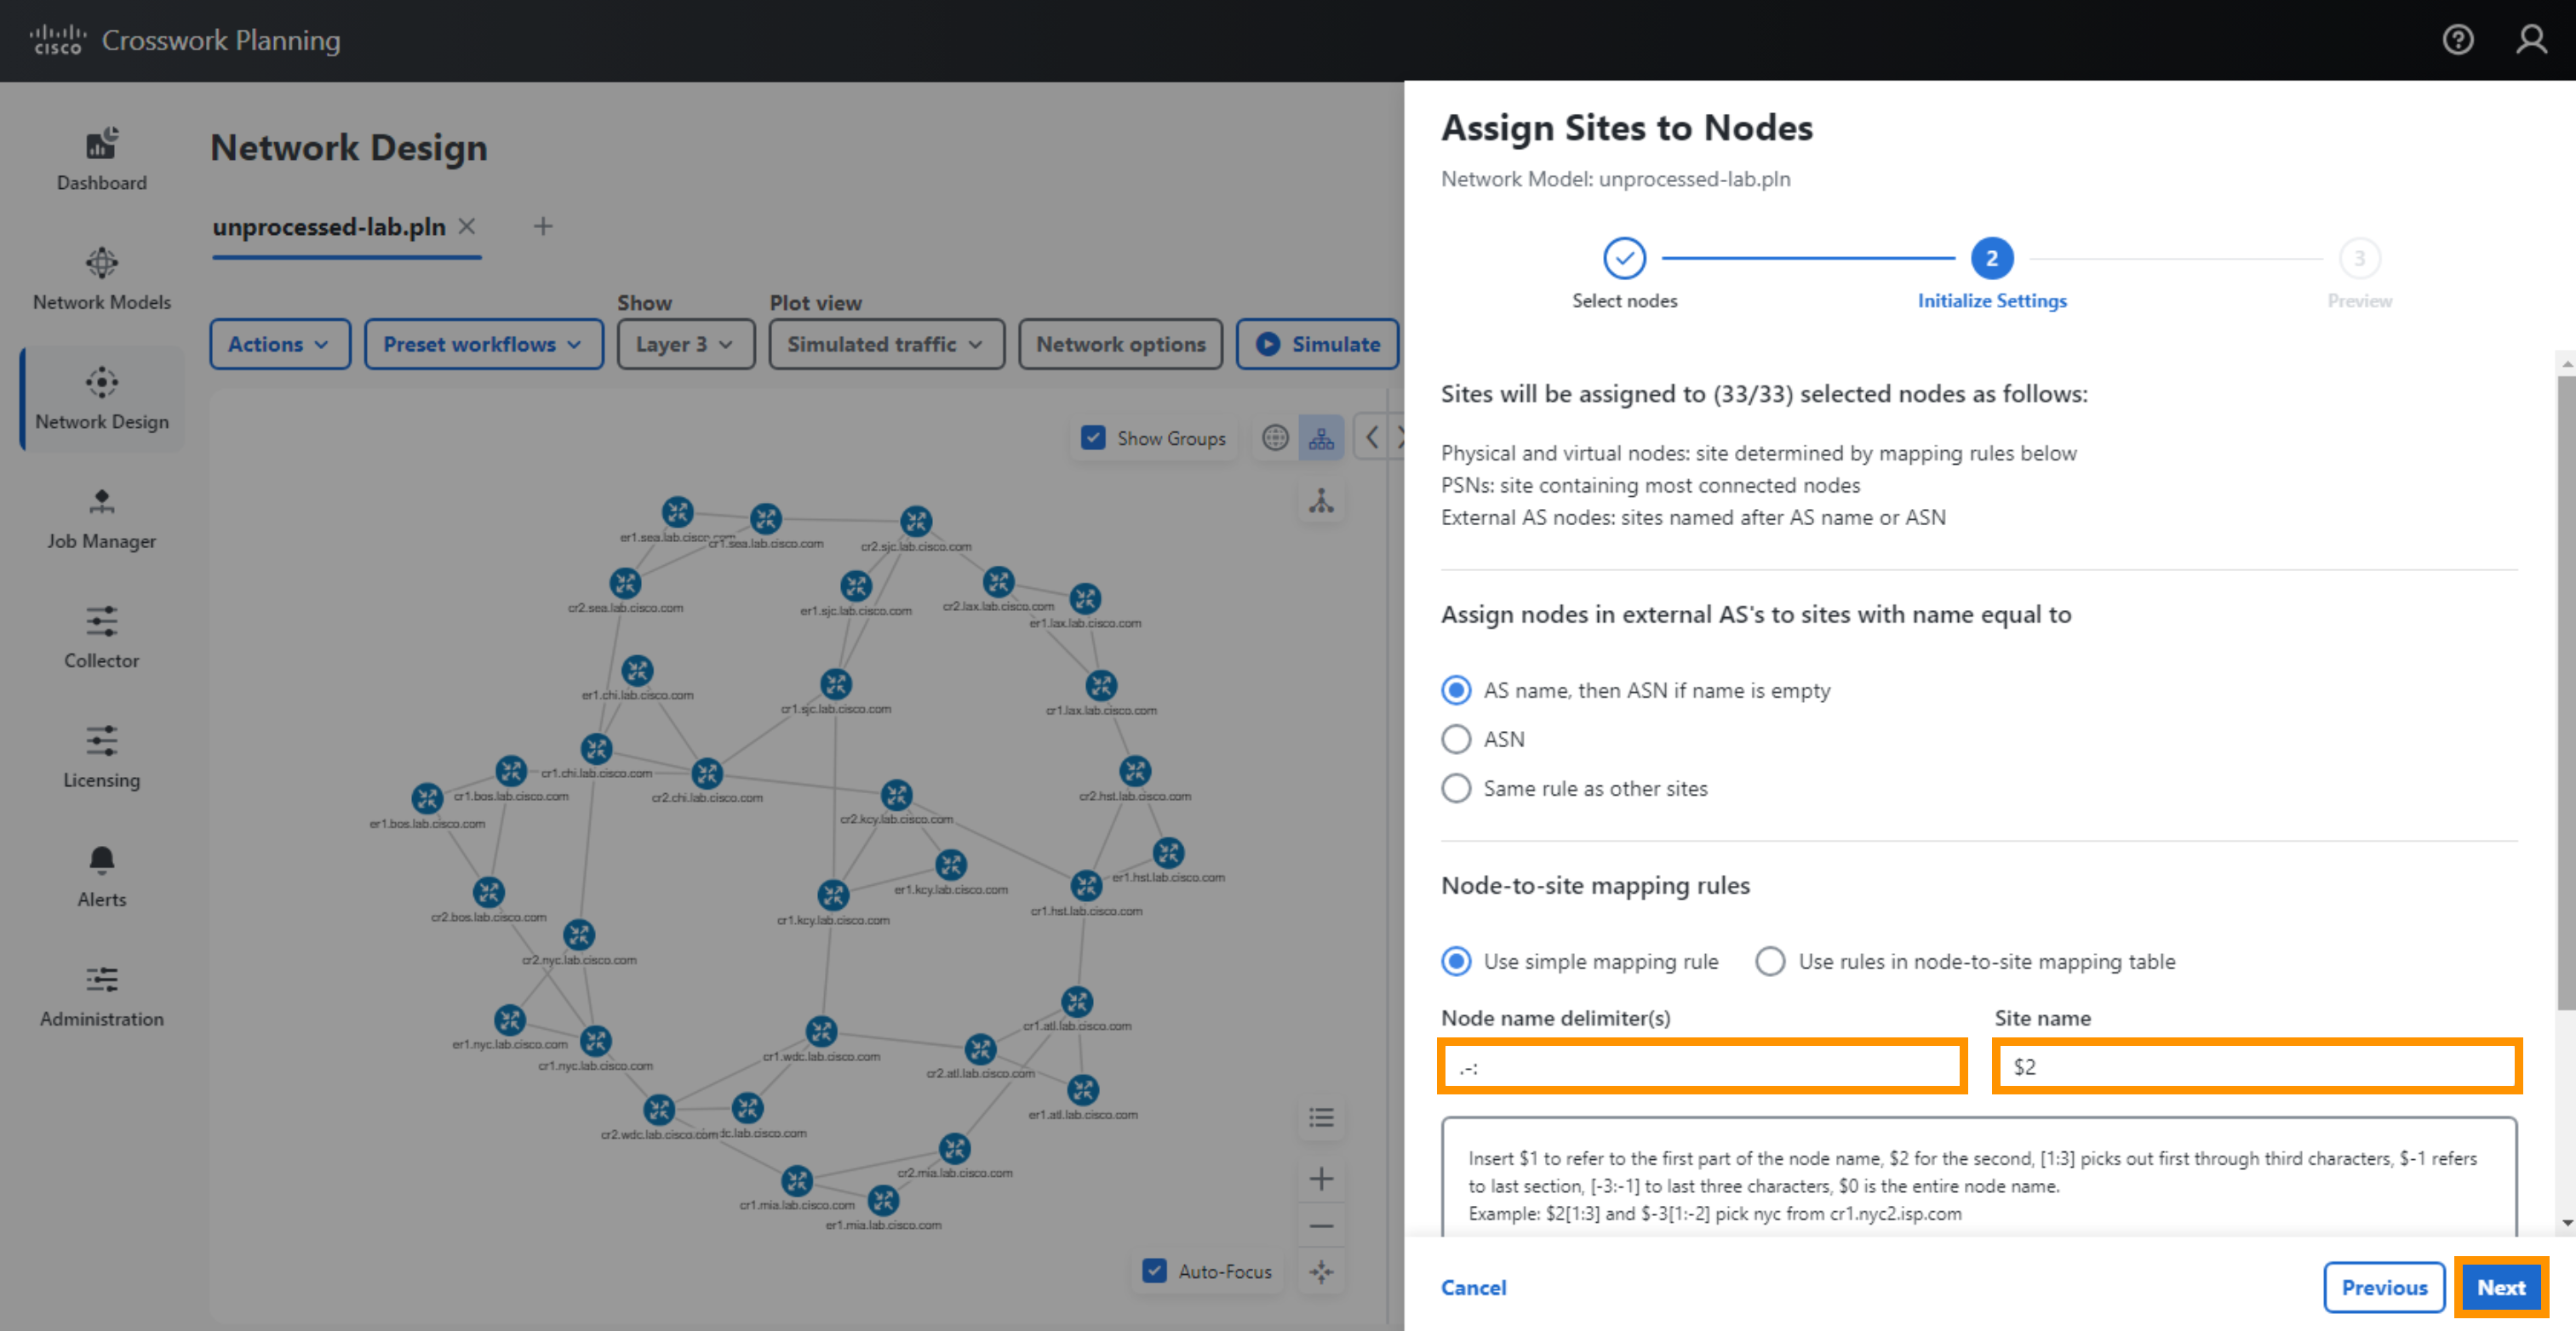
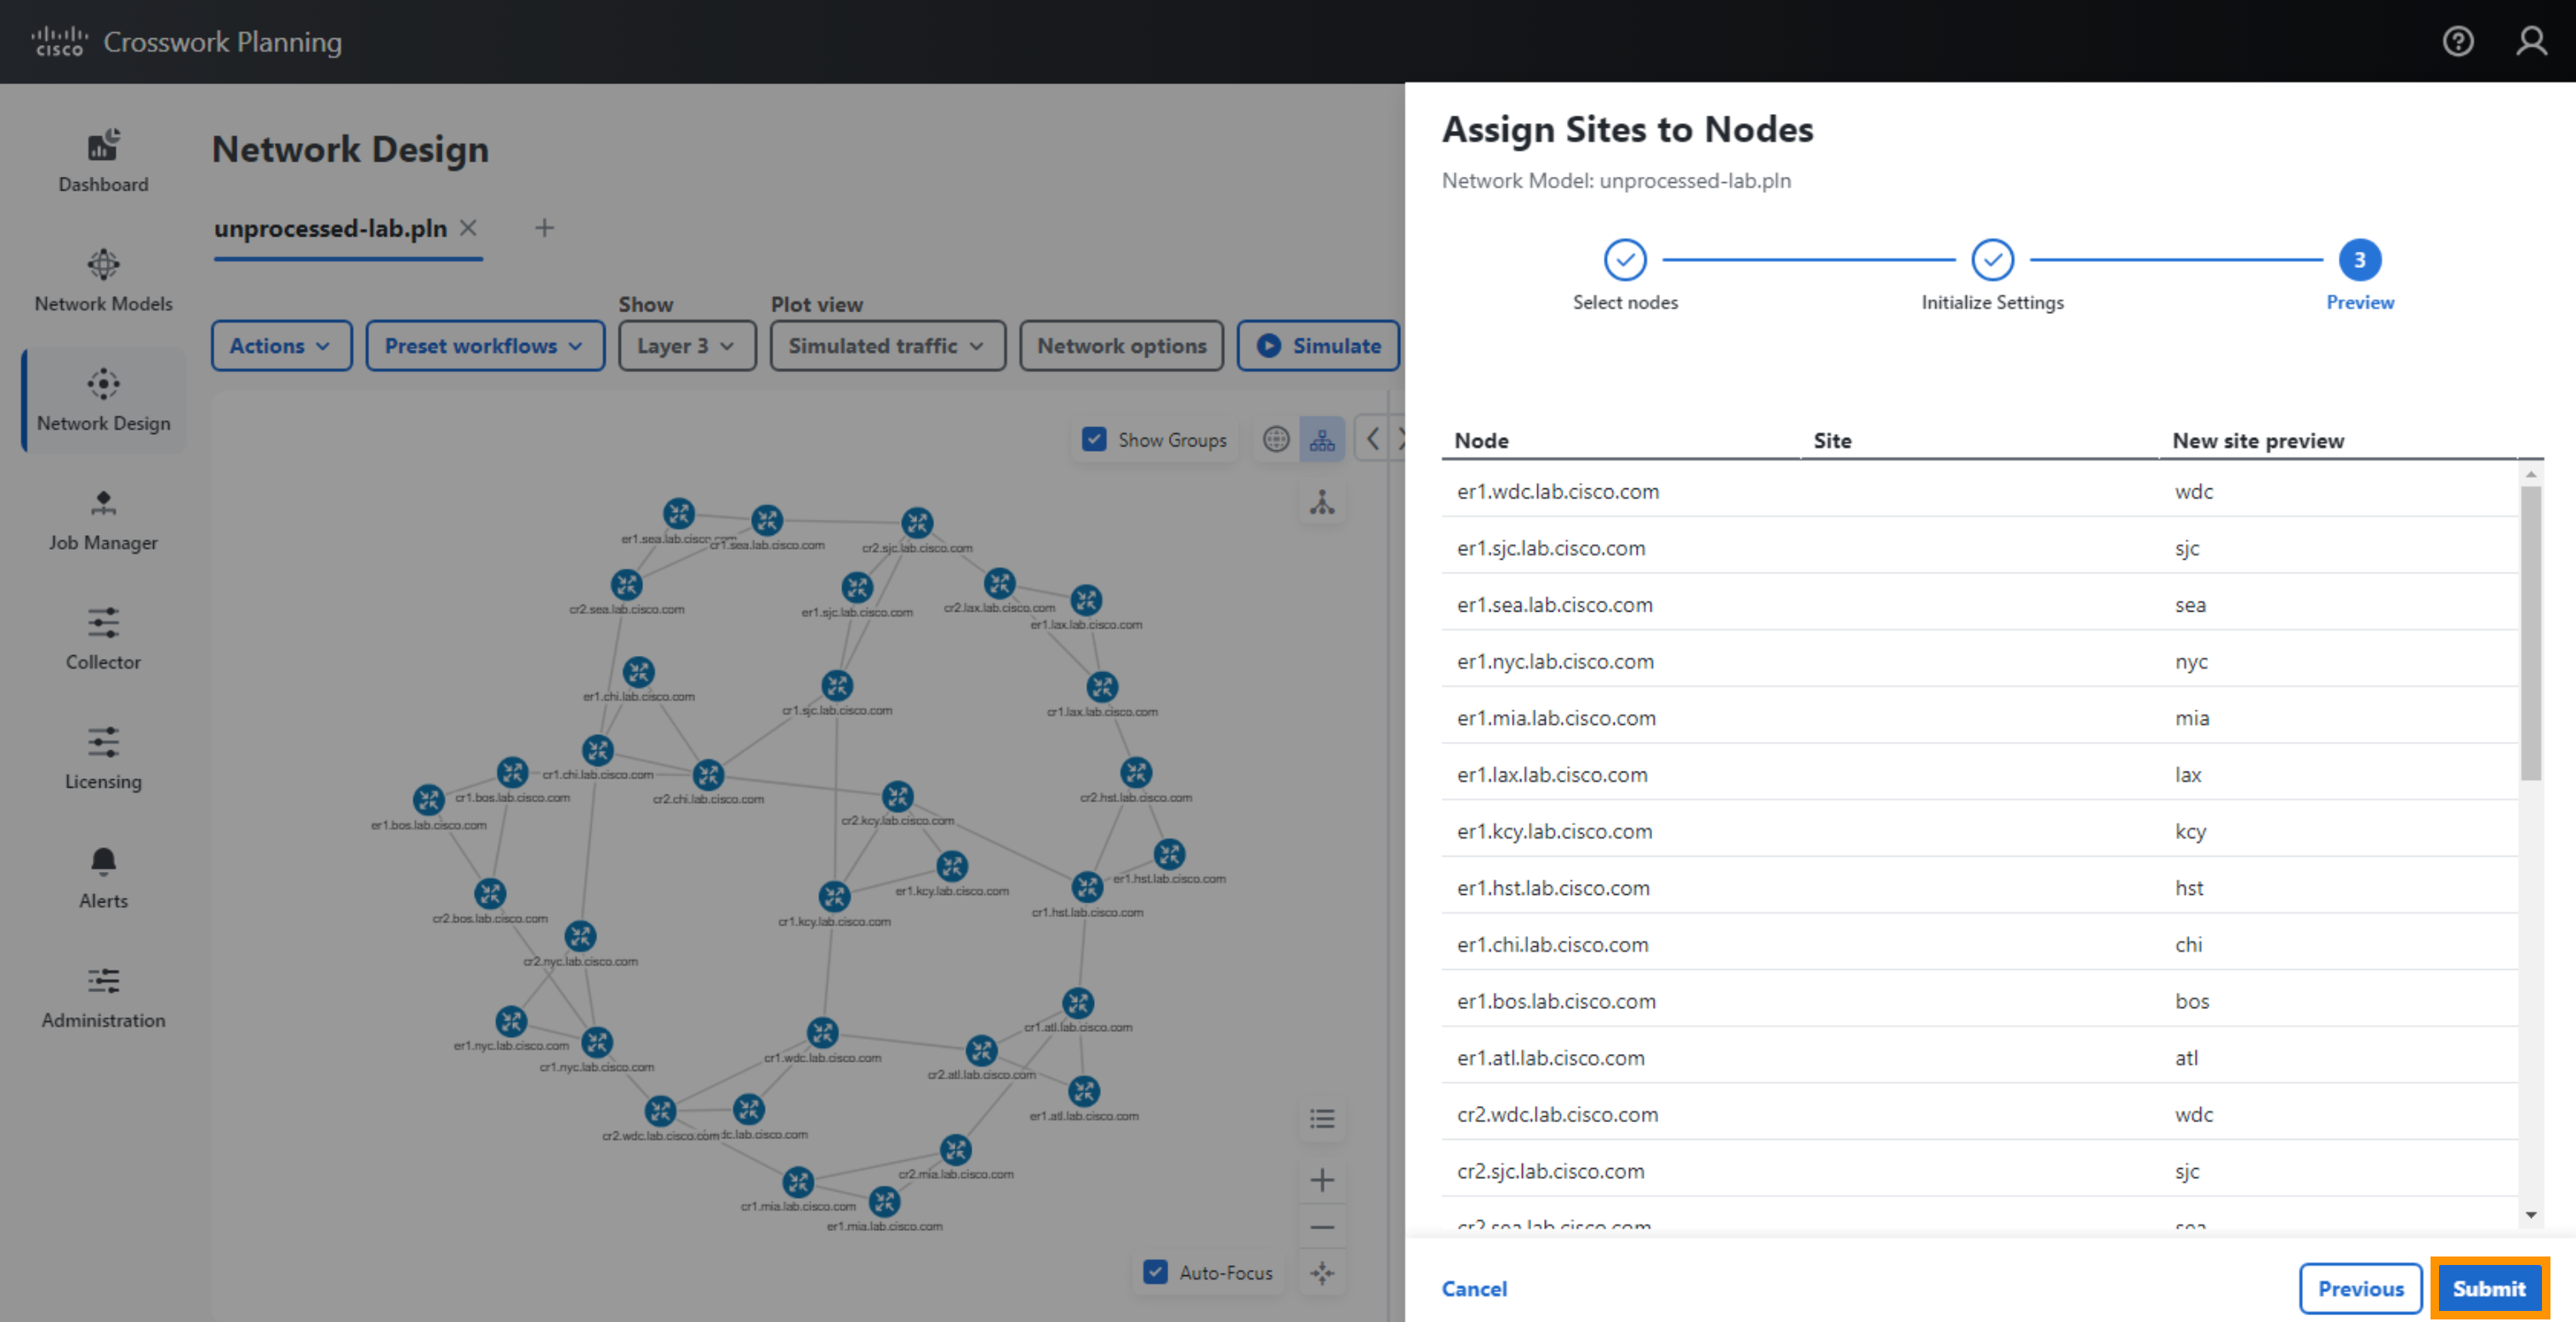
You will be presented with a Preview on what nodes will be assigned to each site.
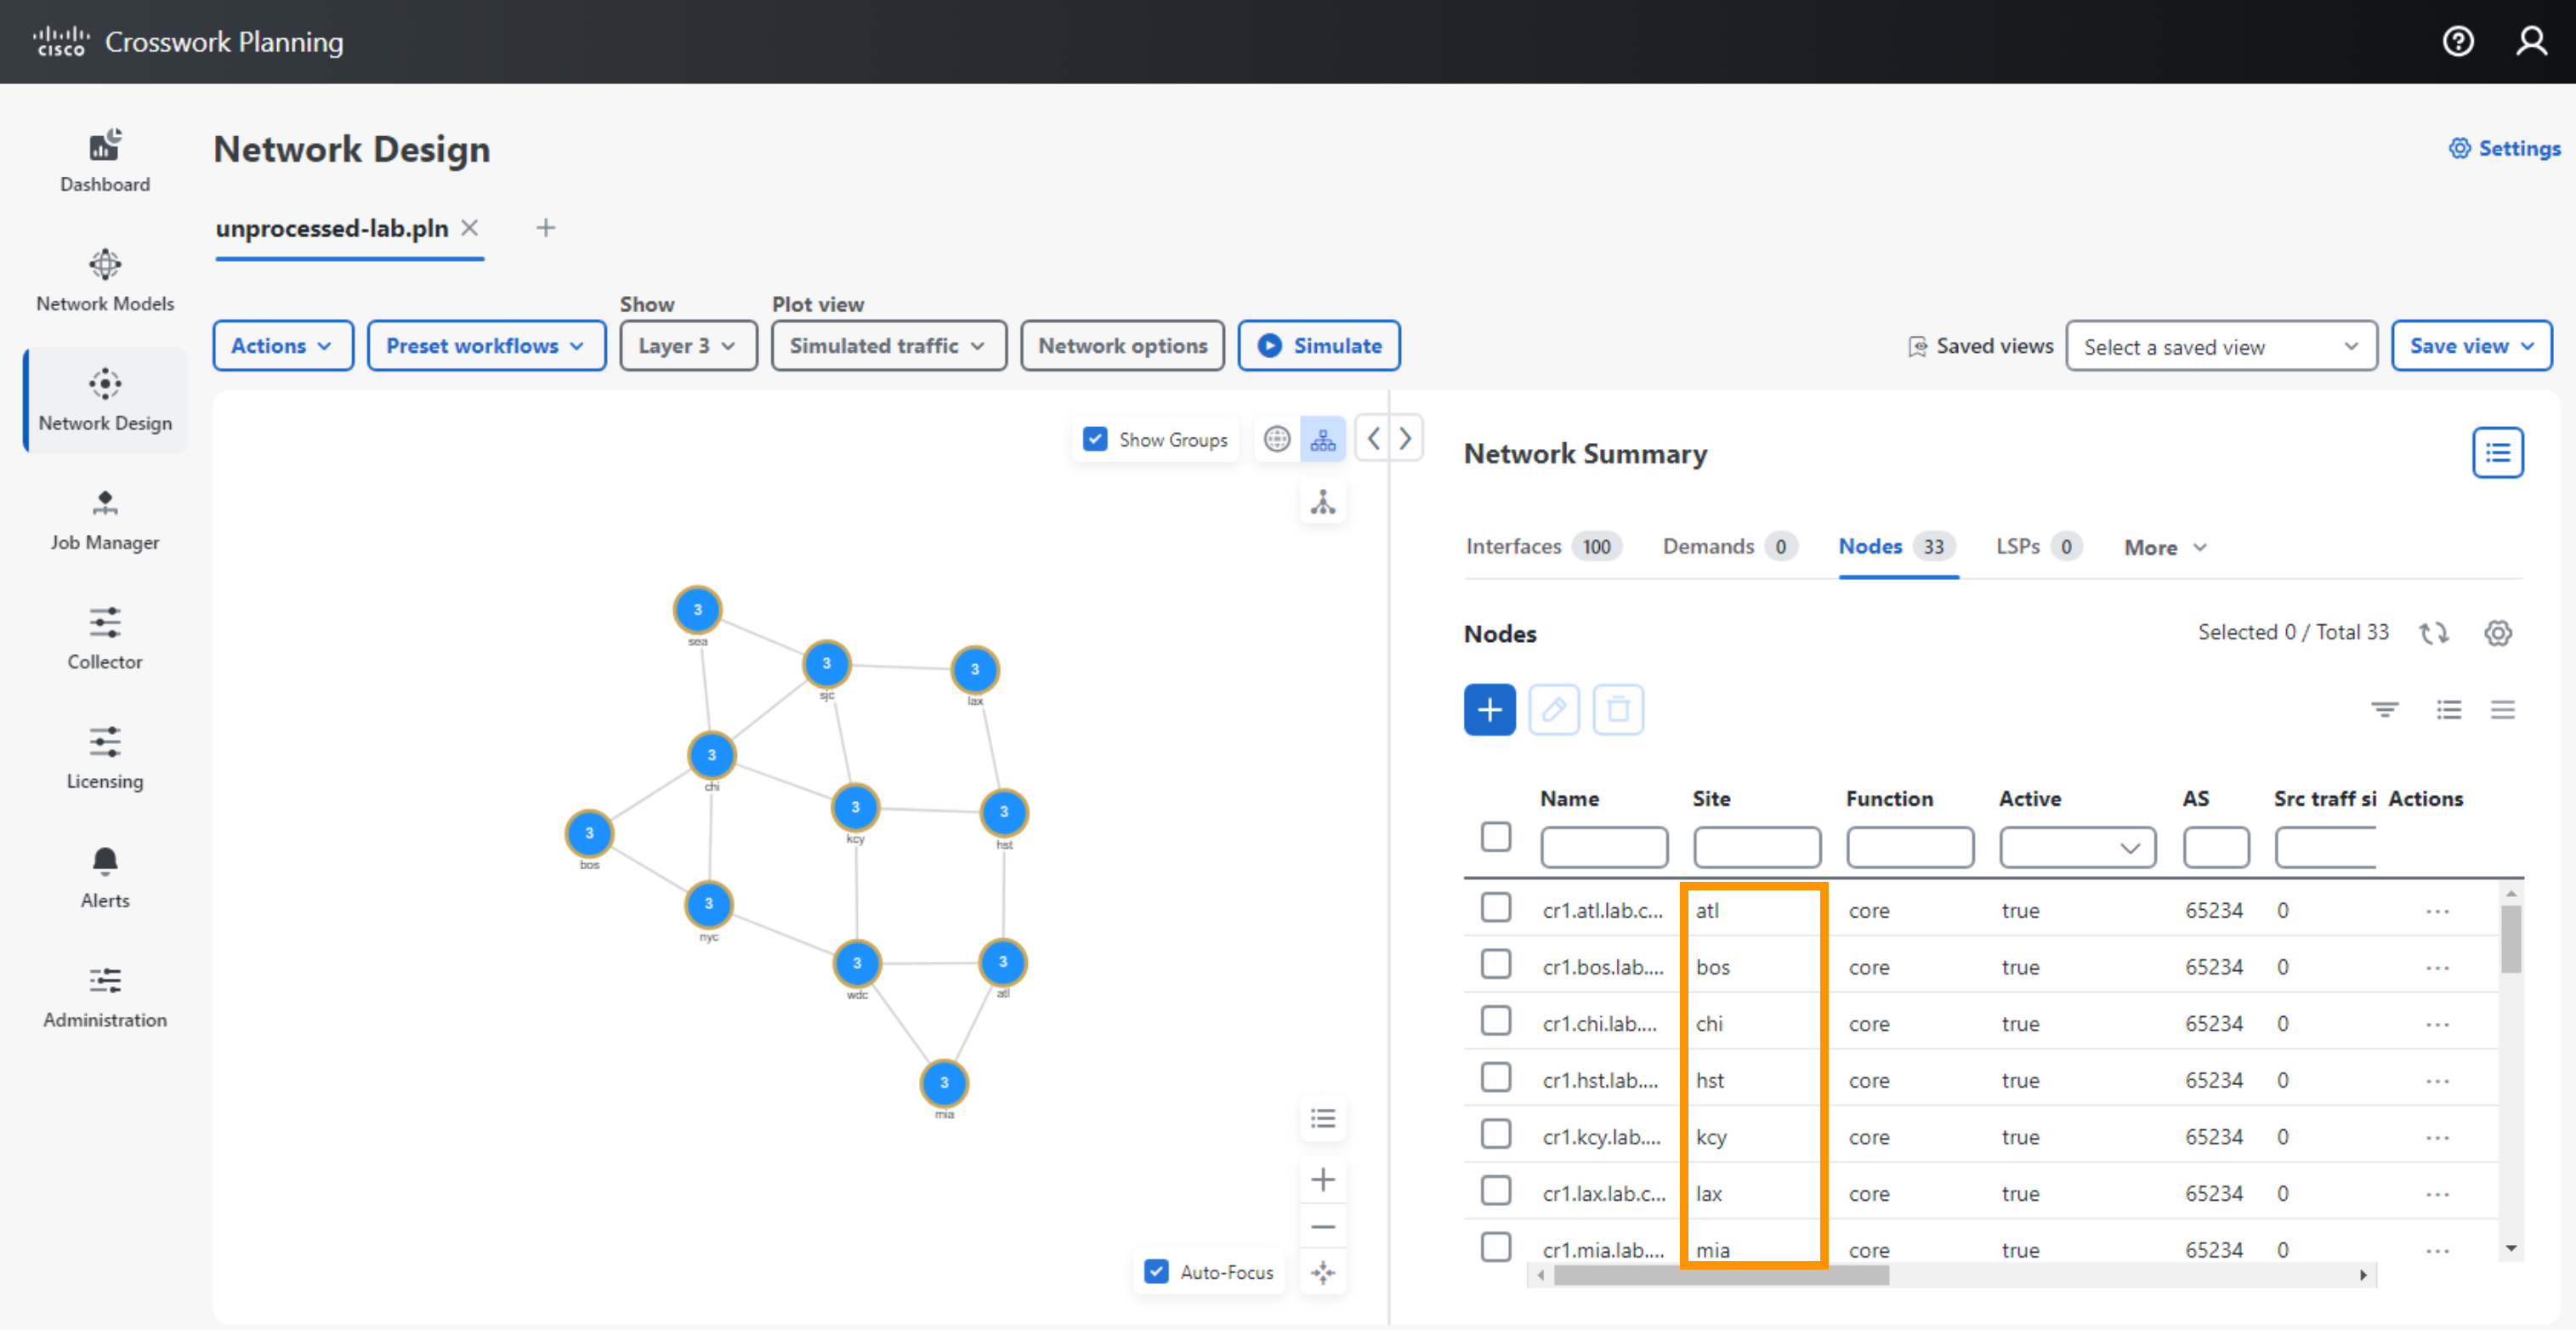
Observe that the node assignment to sites has been completed.
Step 4 Assign Locations to Sites
You should now see 11 sites. You can click and drag them around. Alternatively you can assign sites to geographic locations.
- De-select any site selections by clicking an empty part of the plot
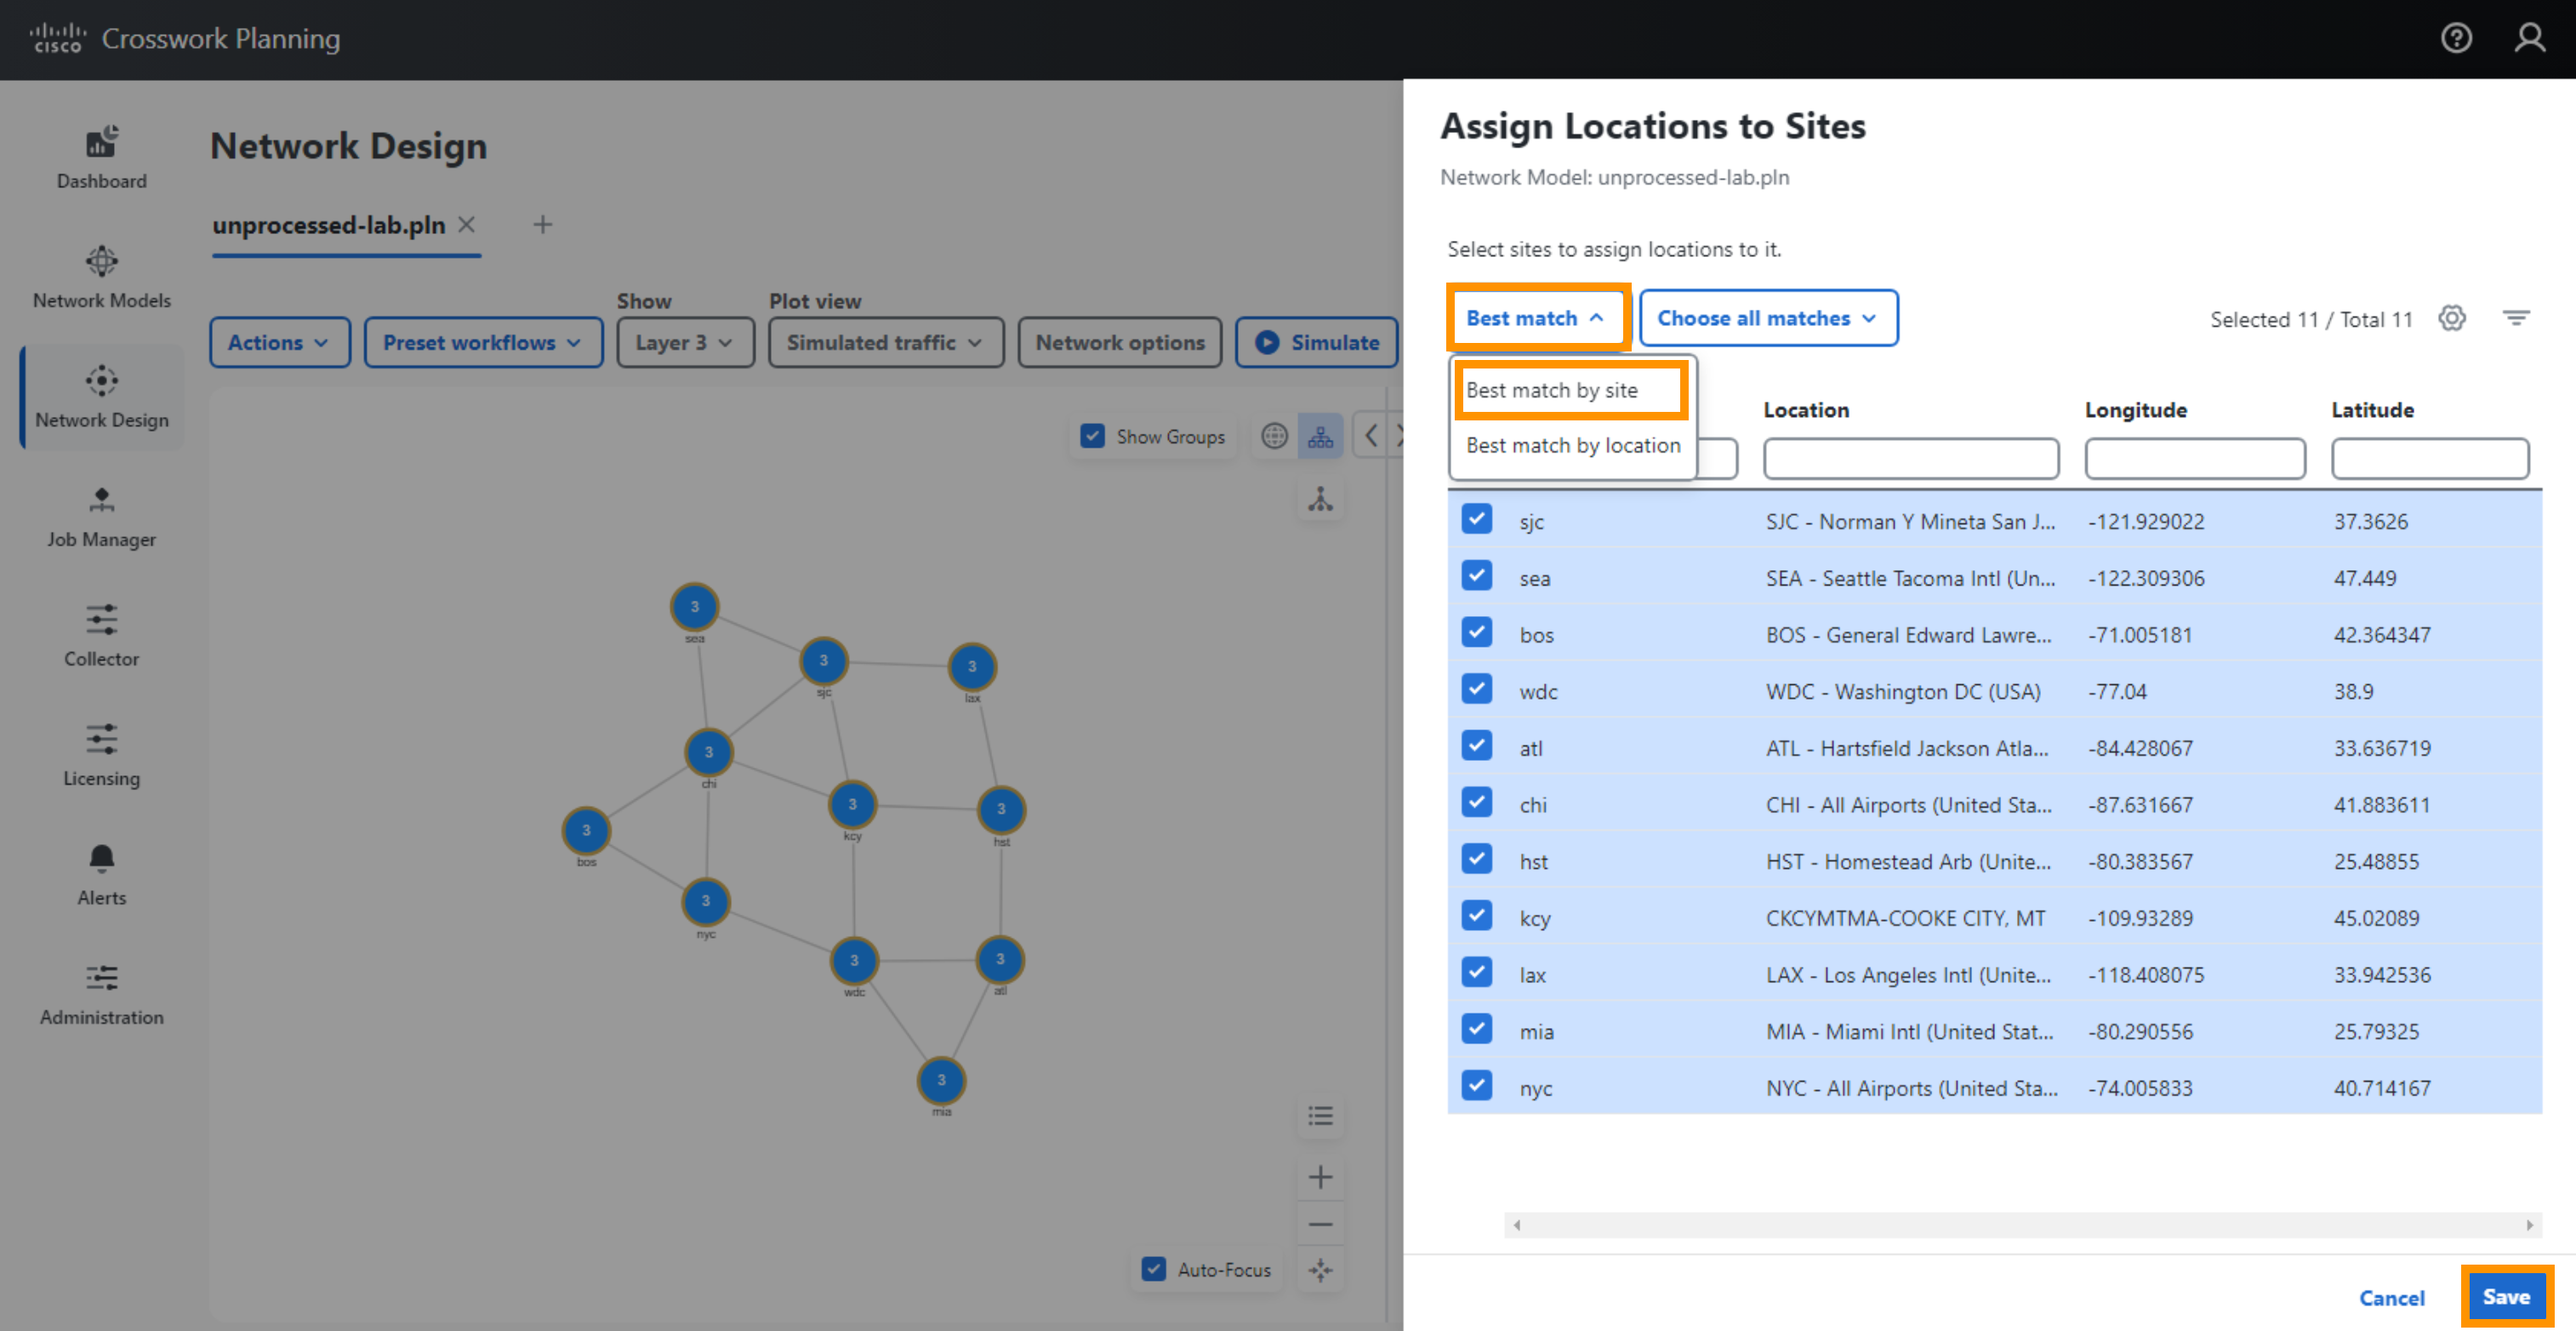
- Select Actions > Initializers > Assign Locations to Sites.
- Select Best match > Best match by site, Select Save
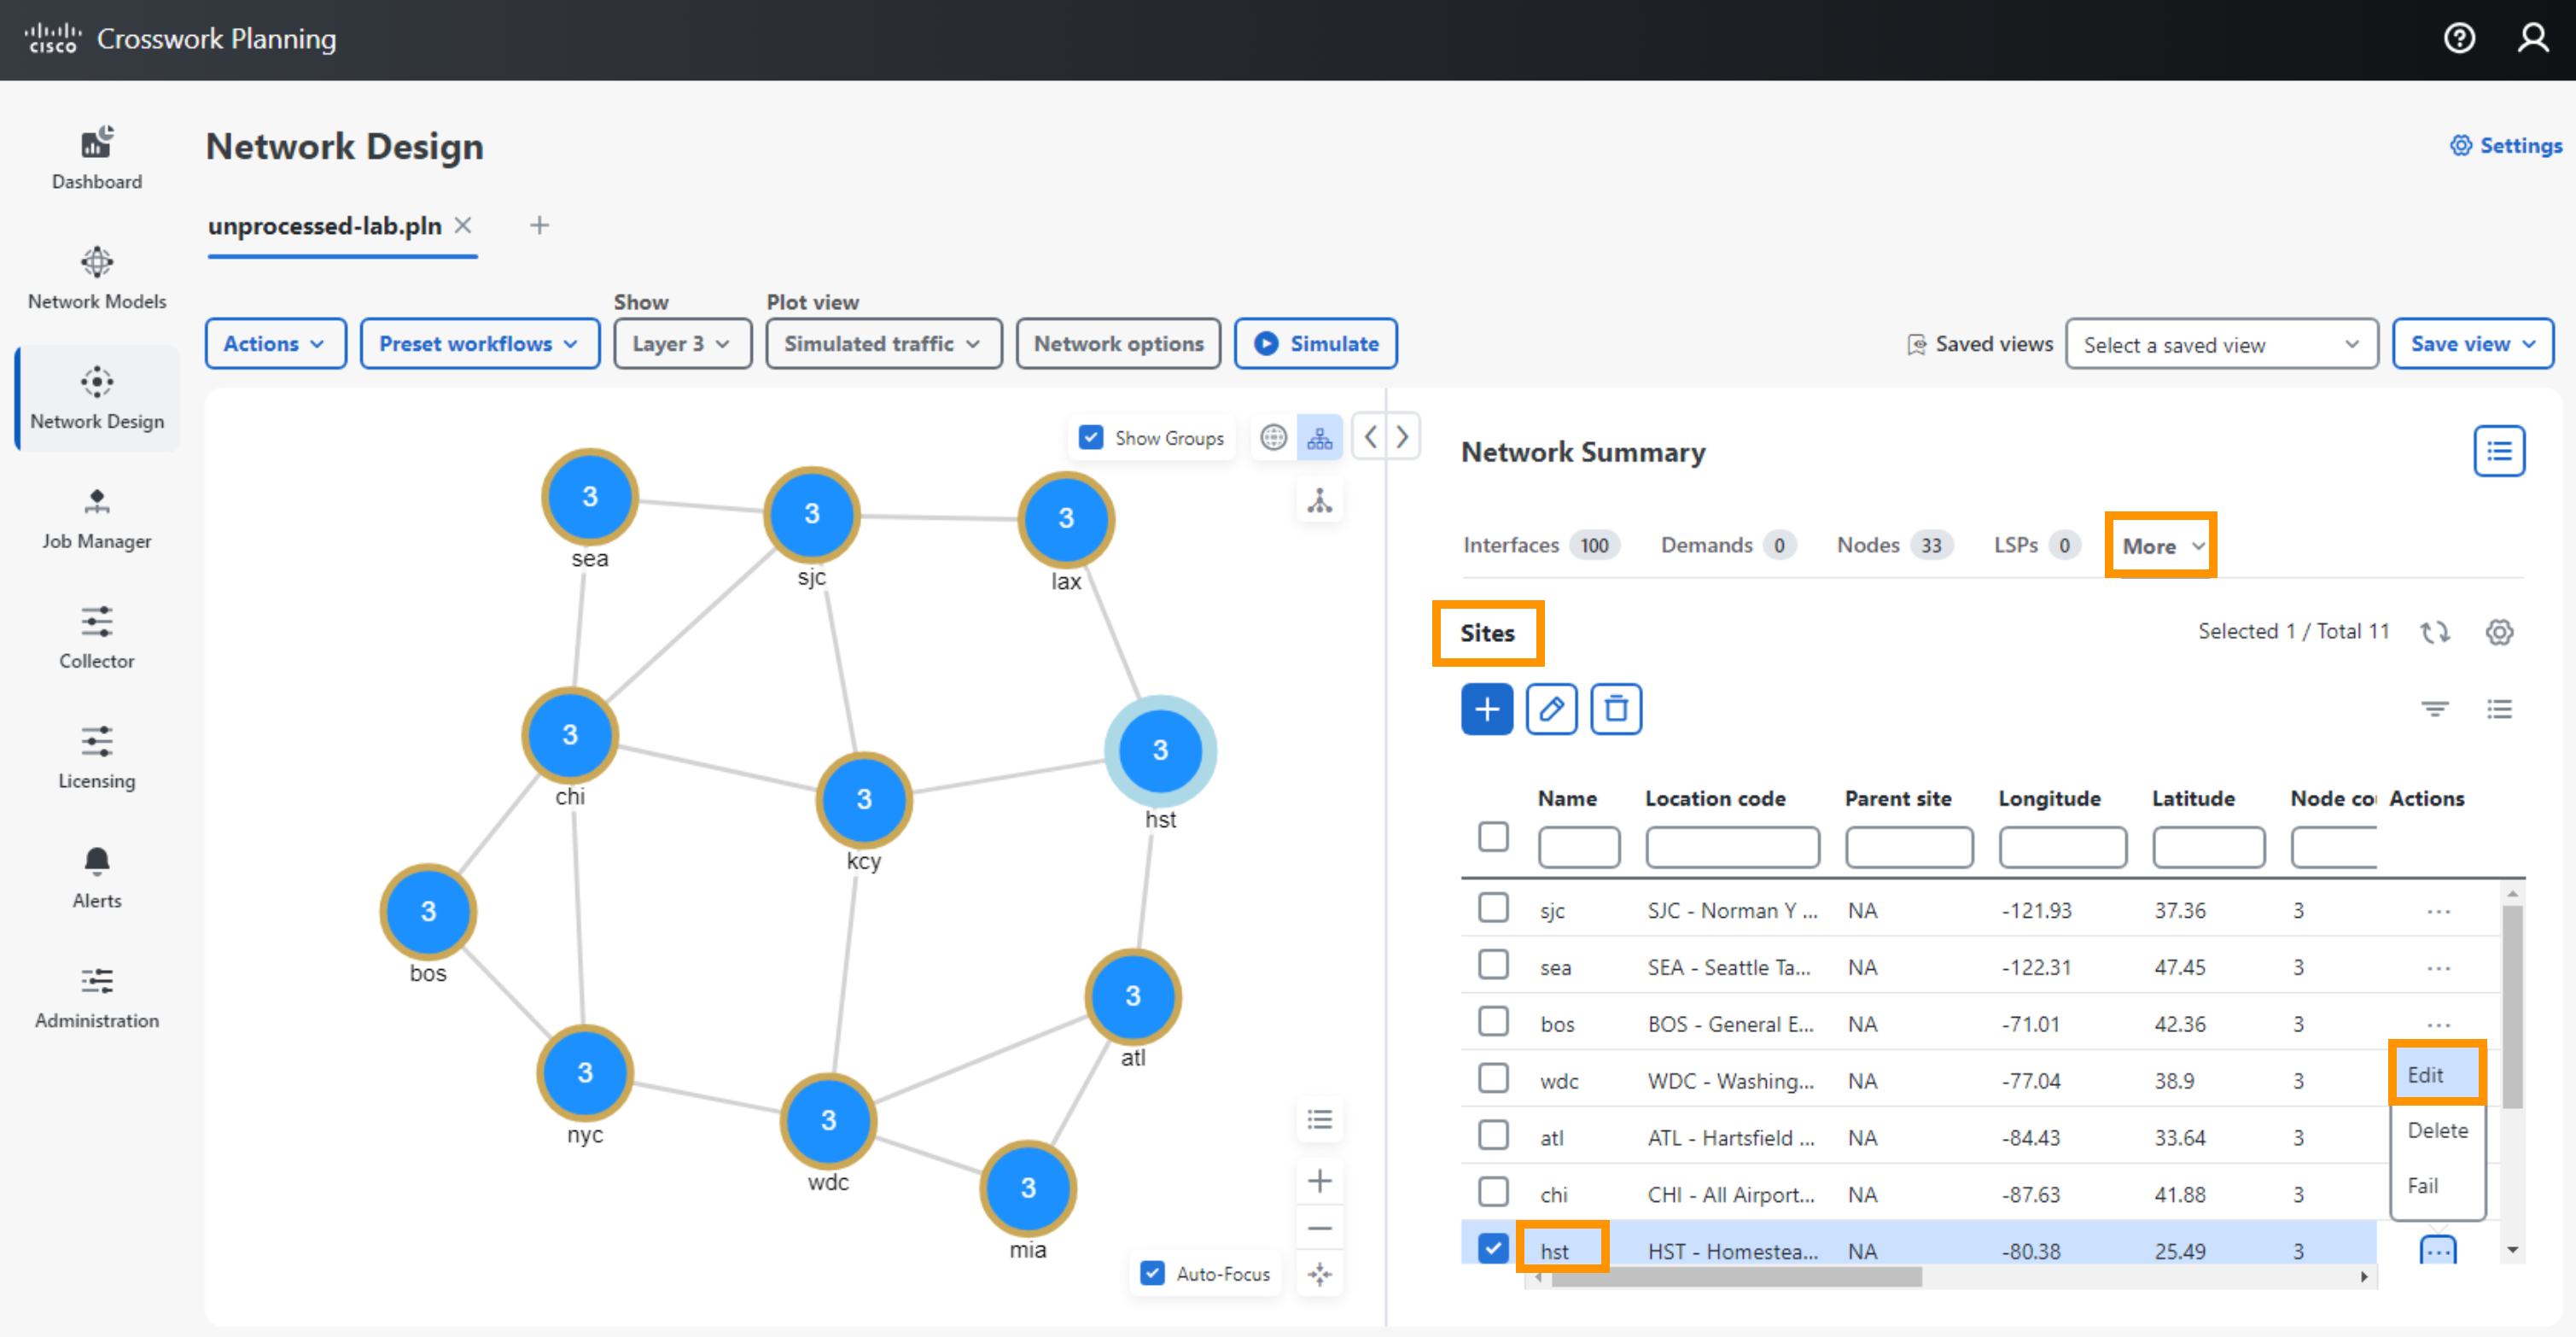
- Notice that the guess gets the location of Houston (HST) and Kansas City (KCY) wrong. Select the More selection to view the Sites Table. Edit these rows by selecting the ellipsis […] icon under the actions column and selecting Edit.
- Enter the correct name of the location for Houston, Texas and Kansas City, Missouri into the Location text box respectively
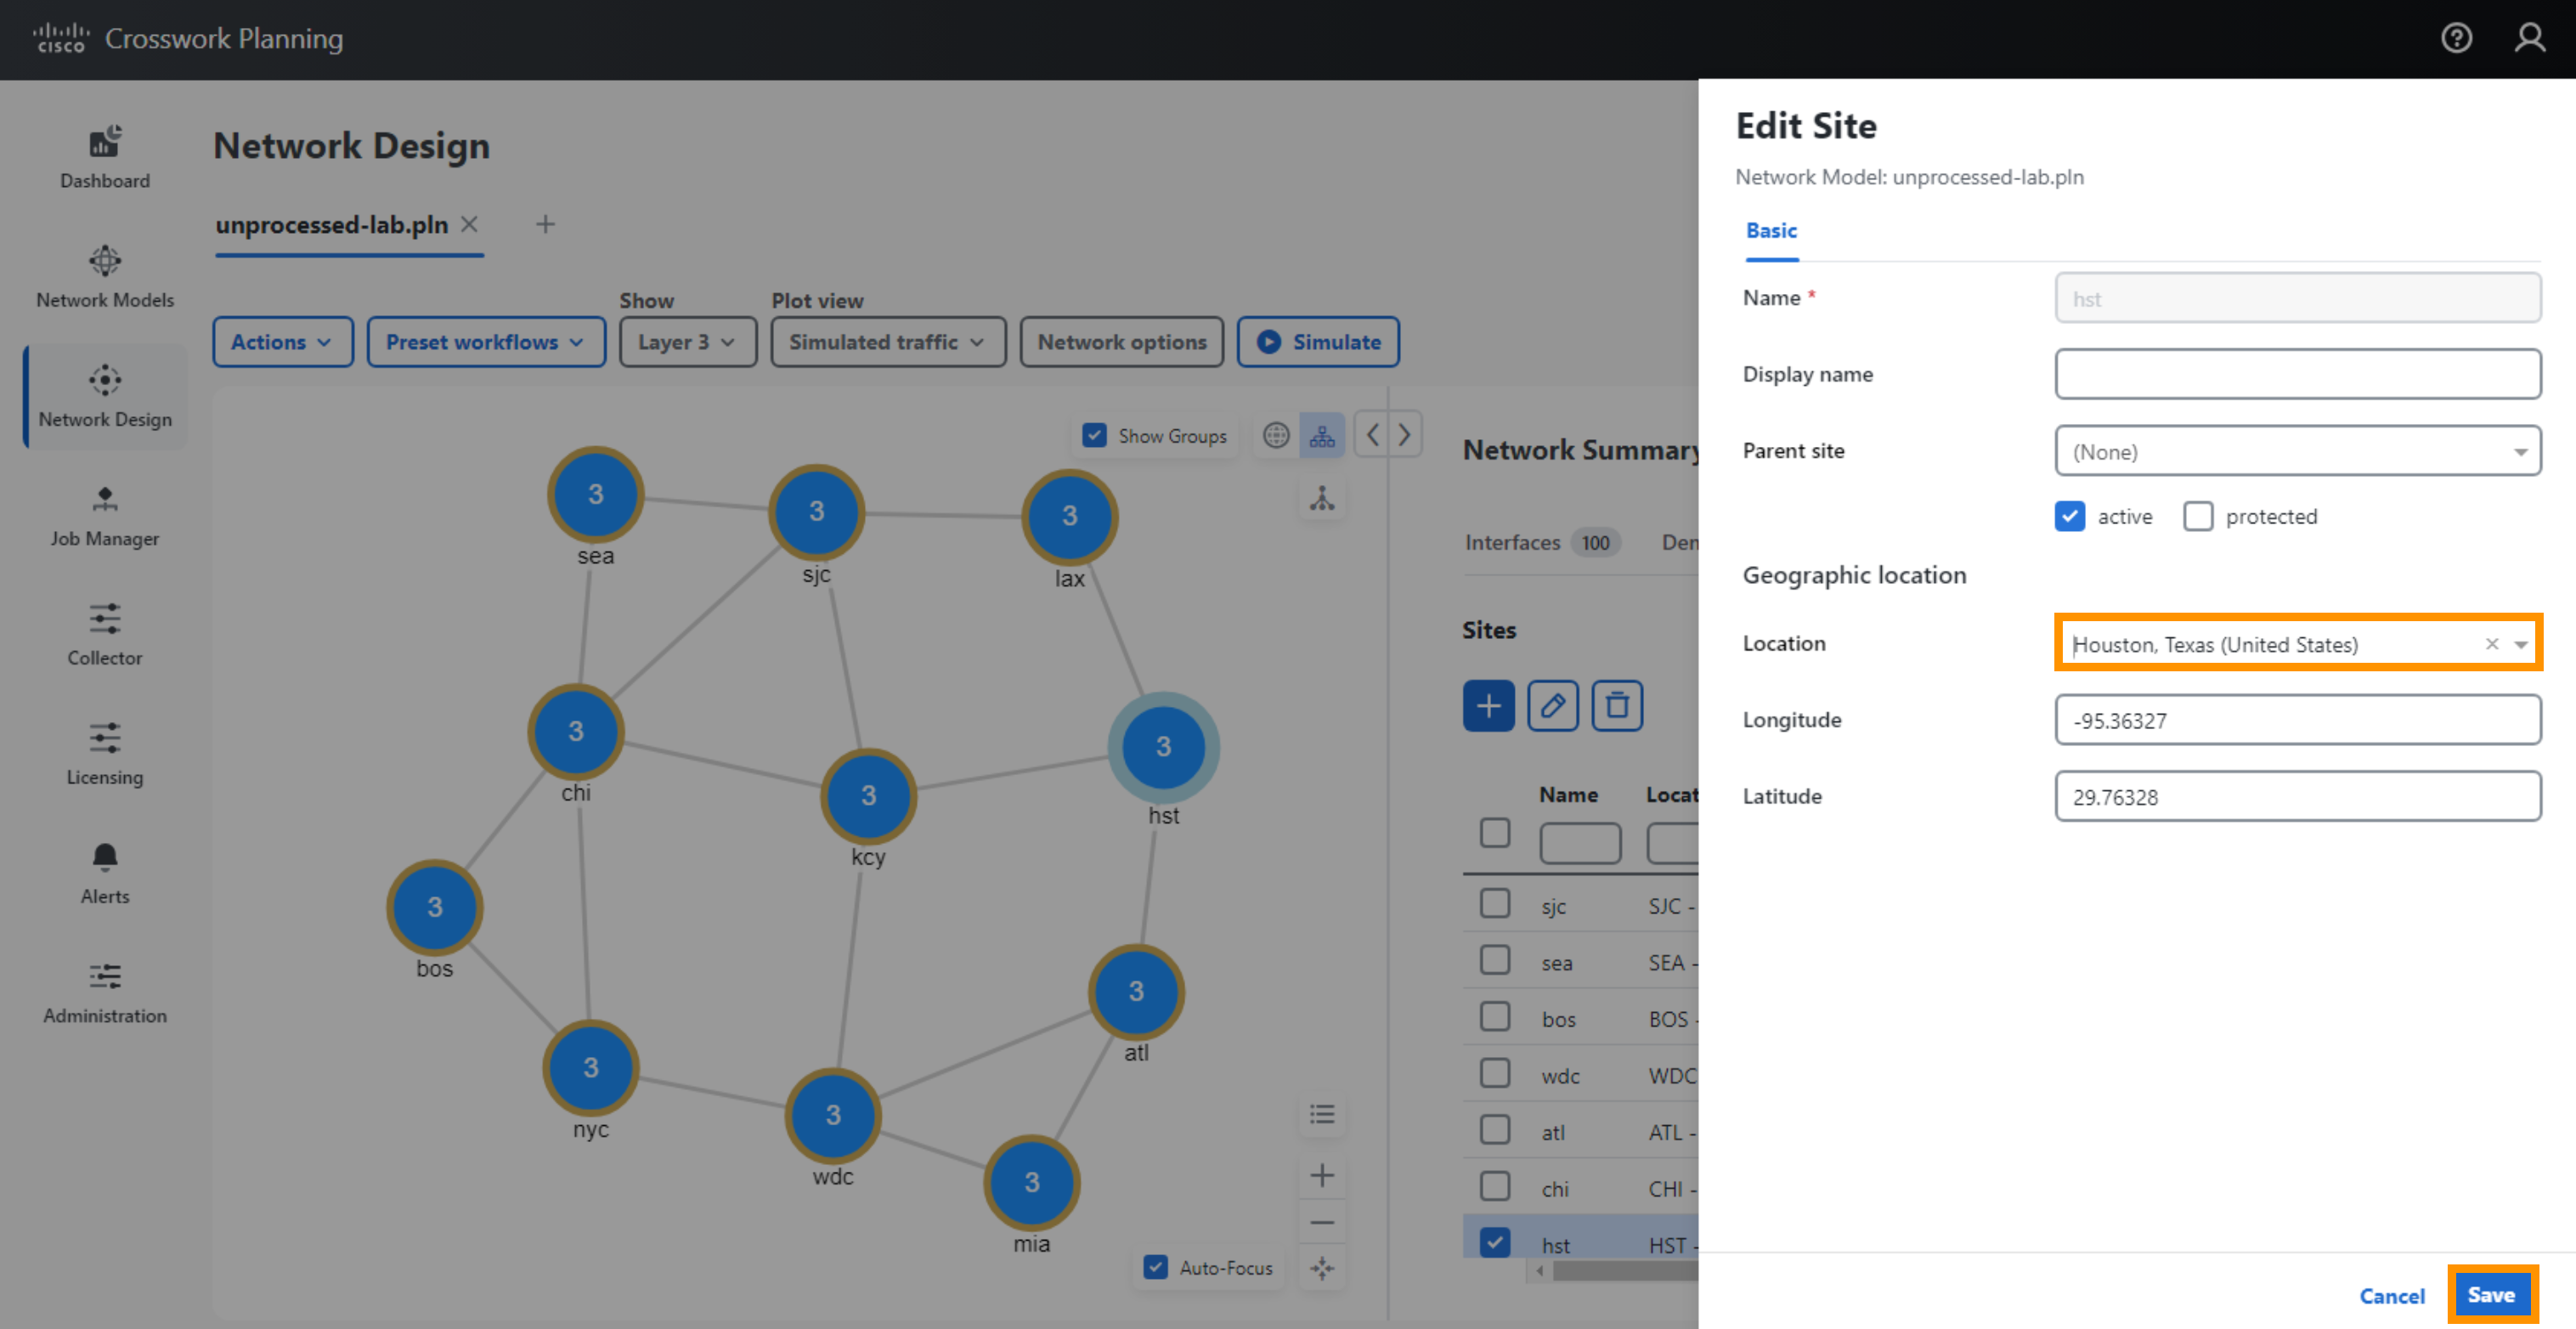
- When finished select Save.
Step 5 Creating Saved Views
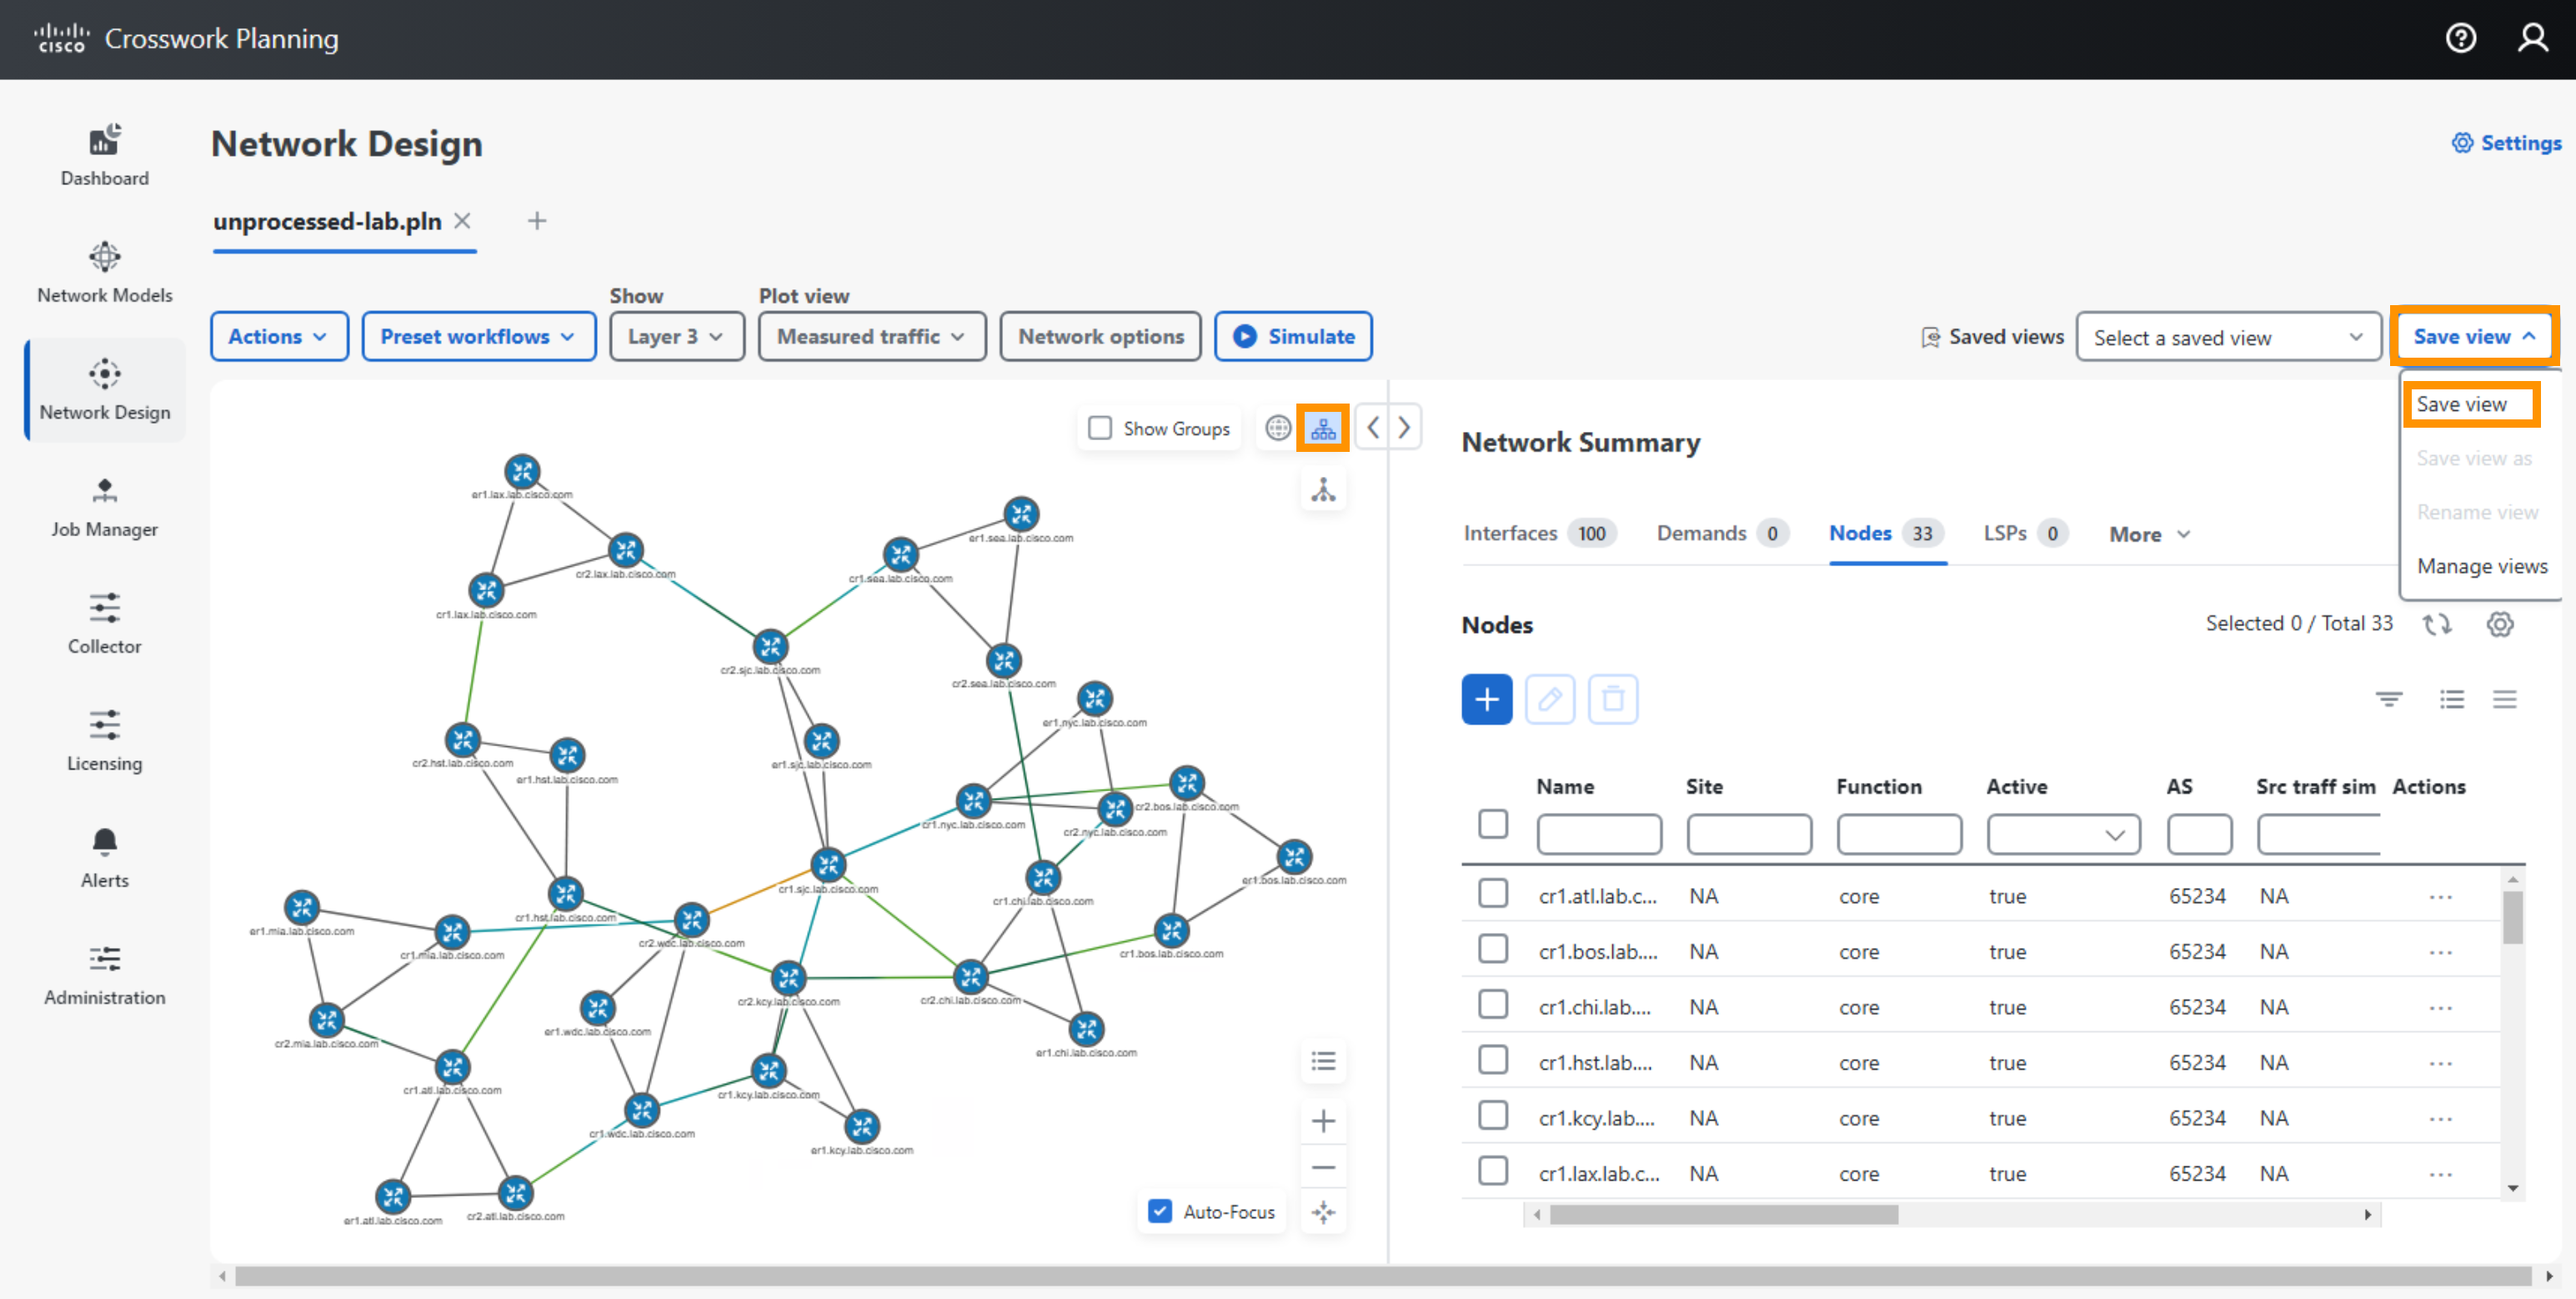
Crosswork allows for a user preferred view to be saved under Saved Views
- In the top right corner of the topology map, select the Logical Topology view.
- Drag the nodes in the topology to provide a preferred view.
- Save the current view under the Save view selection on the top right corner.
- Once the view is saved, it will be available under the Saved views selection.
Create a Traffic Simulation
In the upper left corner of Crosswork Planning Design, the selection box should say Measured Traffic. If you toggle to Simulated Traffic, the interfaces should appear empty (no colors appear on the interfaces). In this section we will use the measured data to create a traffic simulation.
Crosswork Planning simulates traffic routed through the network using Demands. A demand represents an aggregate per service class flow of traffic from source to destination. Each demand has a traffic value in Mbps and is routed according the topology and protocols as defined in the Network Model of the network.
Step 6 Create A Demand Mesh
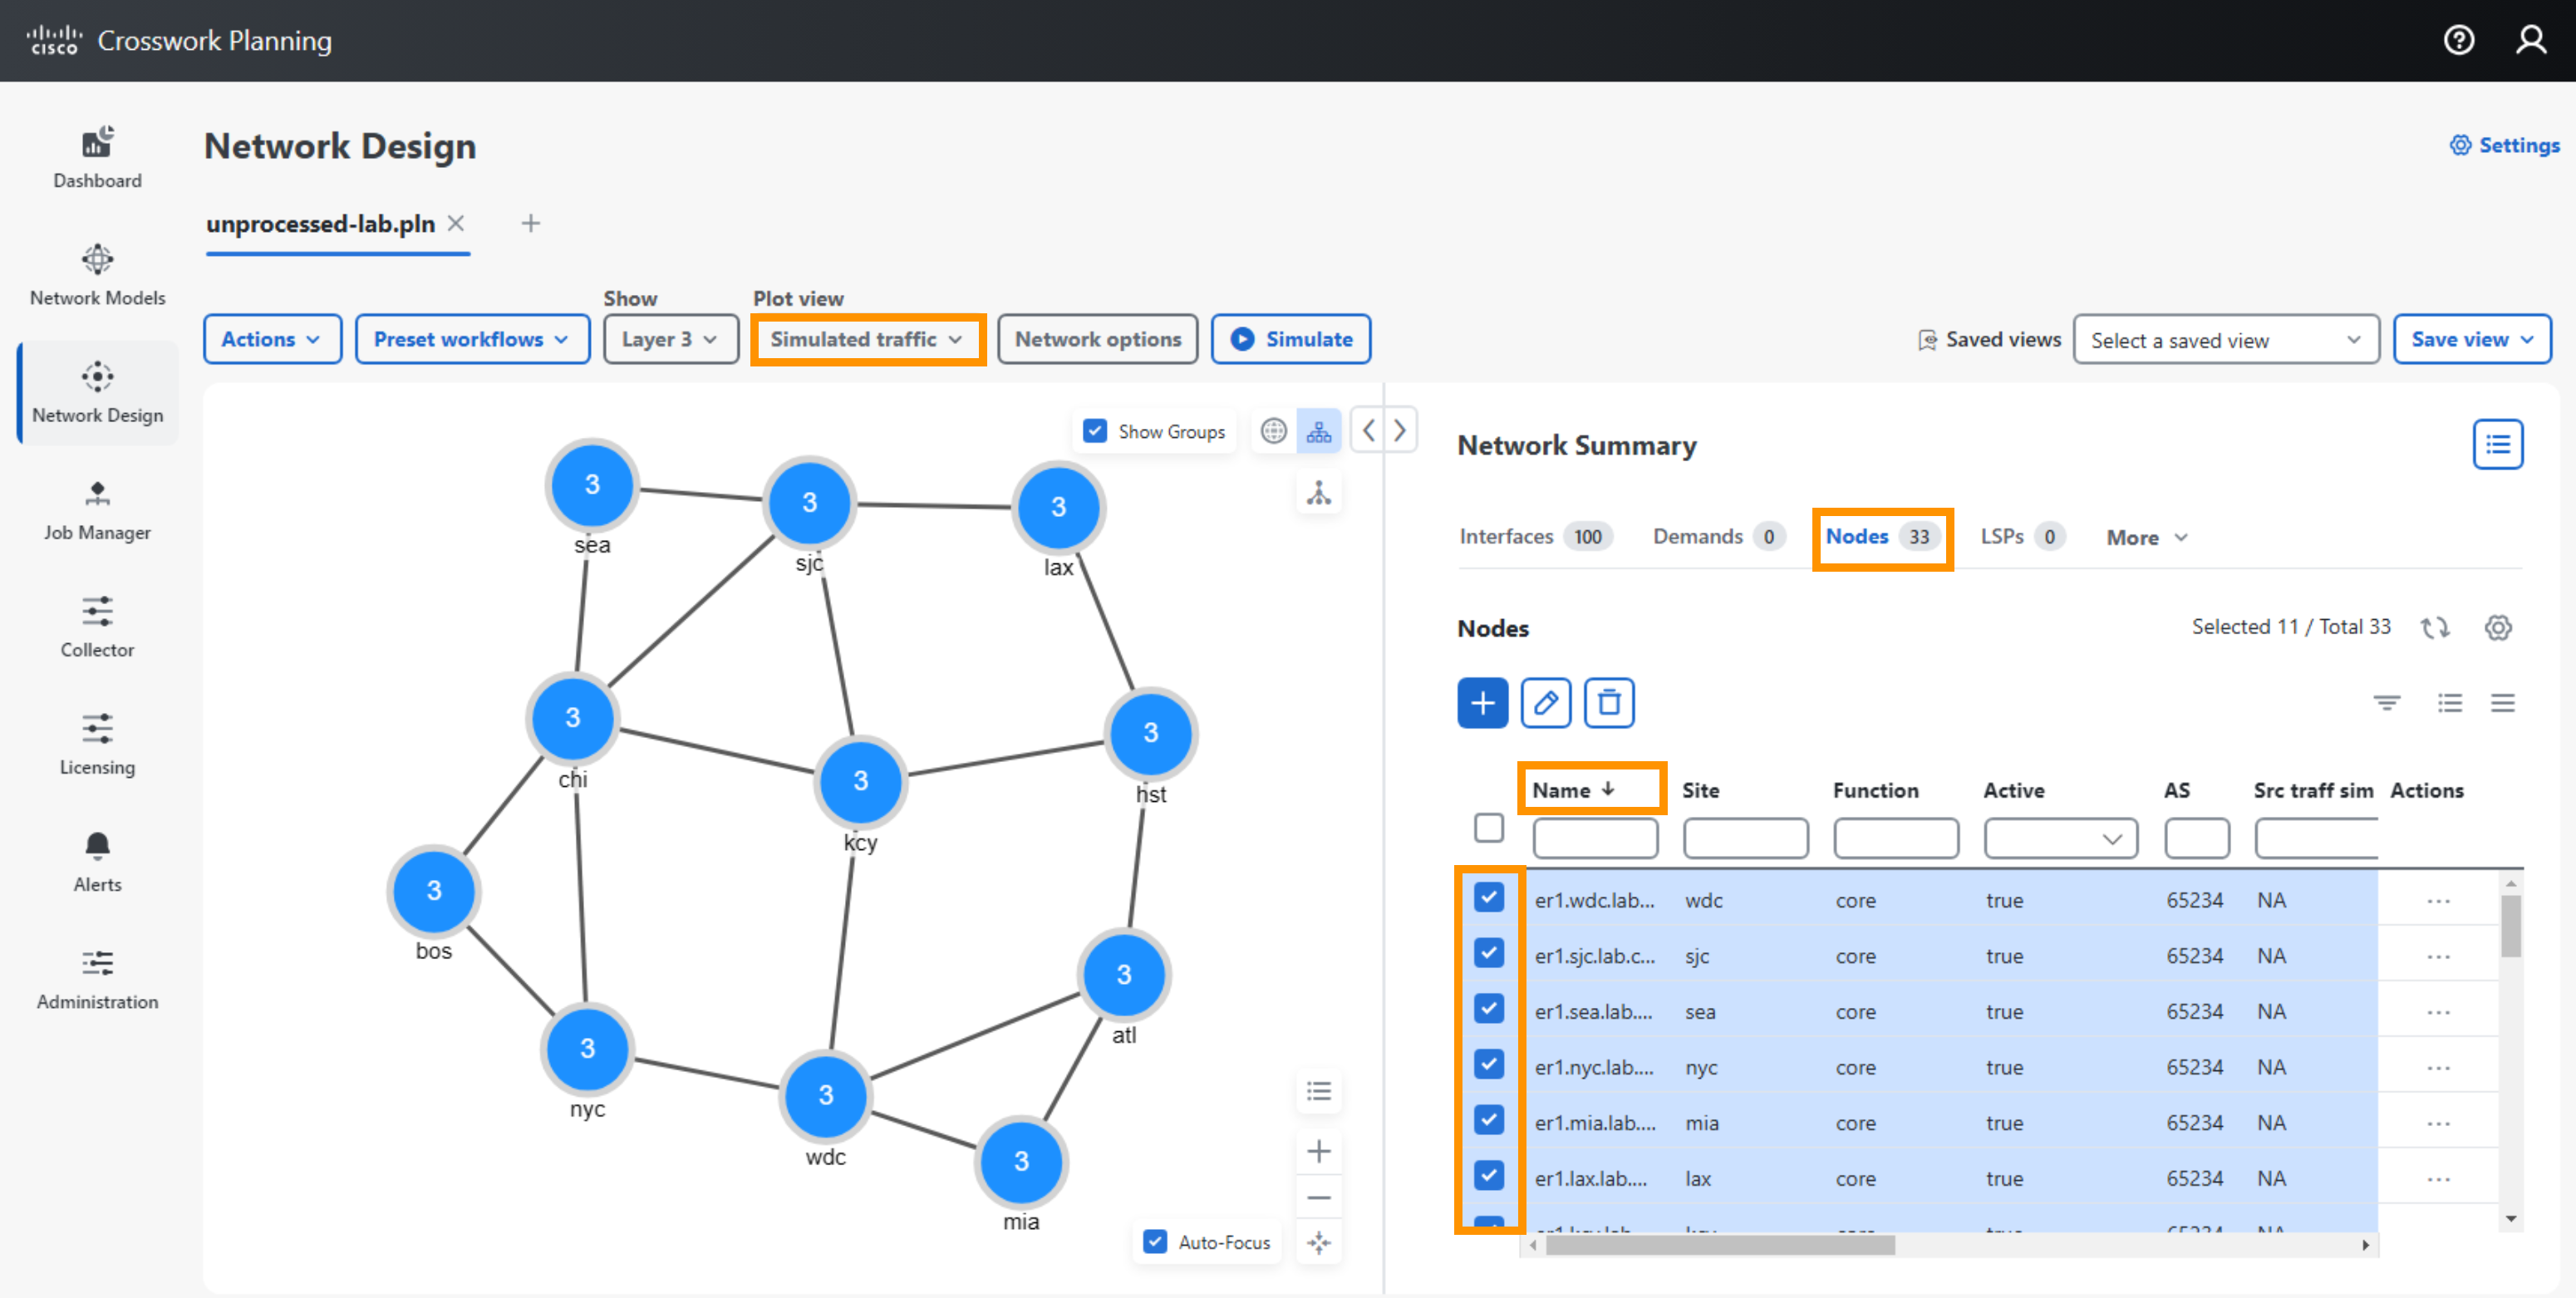
To create a mesh of demands, first find the edge of the network. You will notice these routers are identified with hostnames er.<site name>.
- In the Nodes property table, you can click on the node name column header to sort the nodes. Select only these nodes that begin with “er1” in the table.
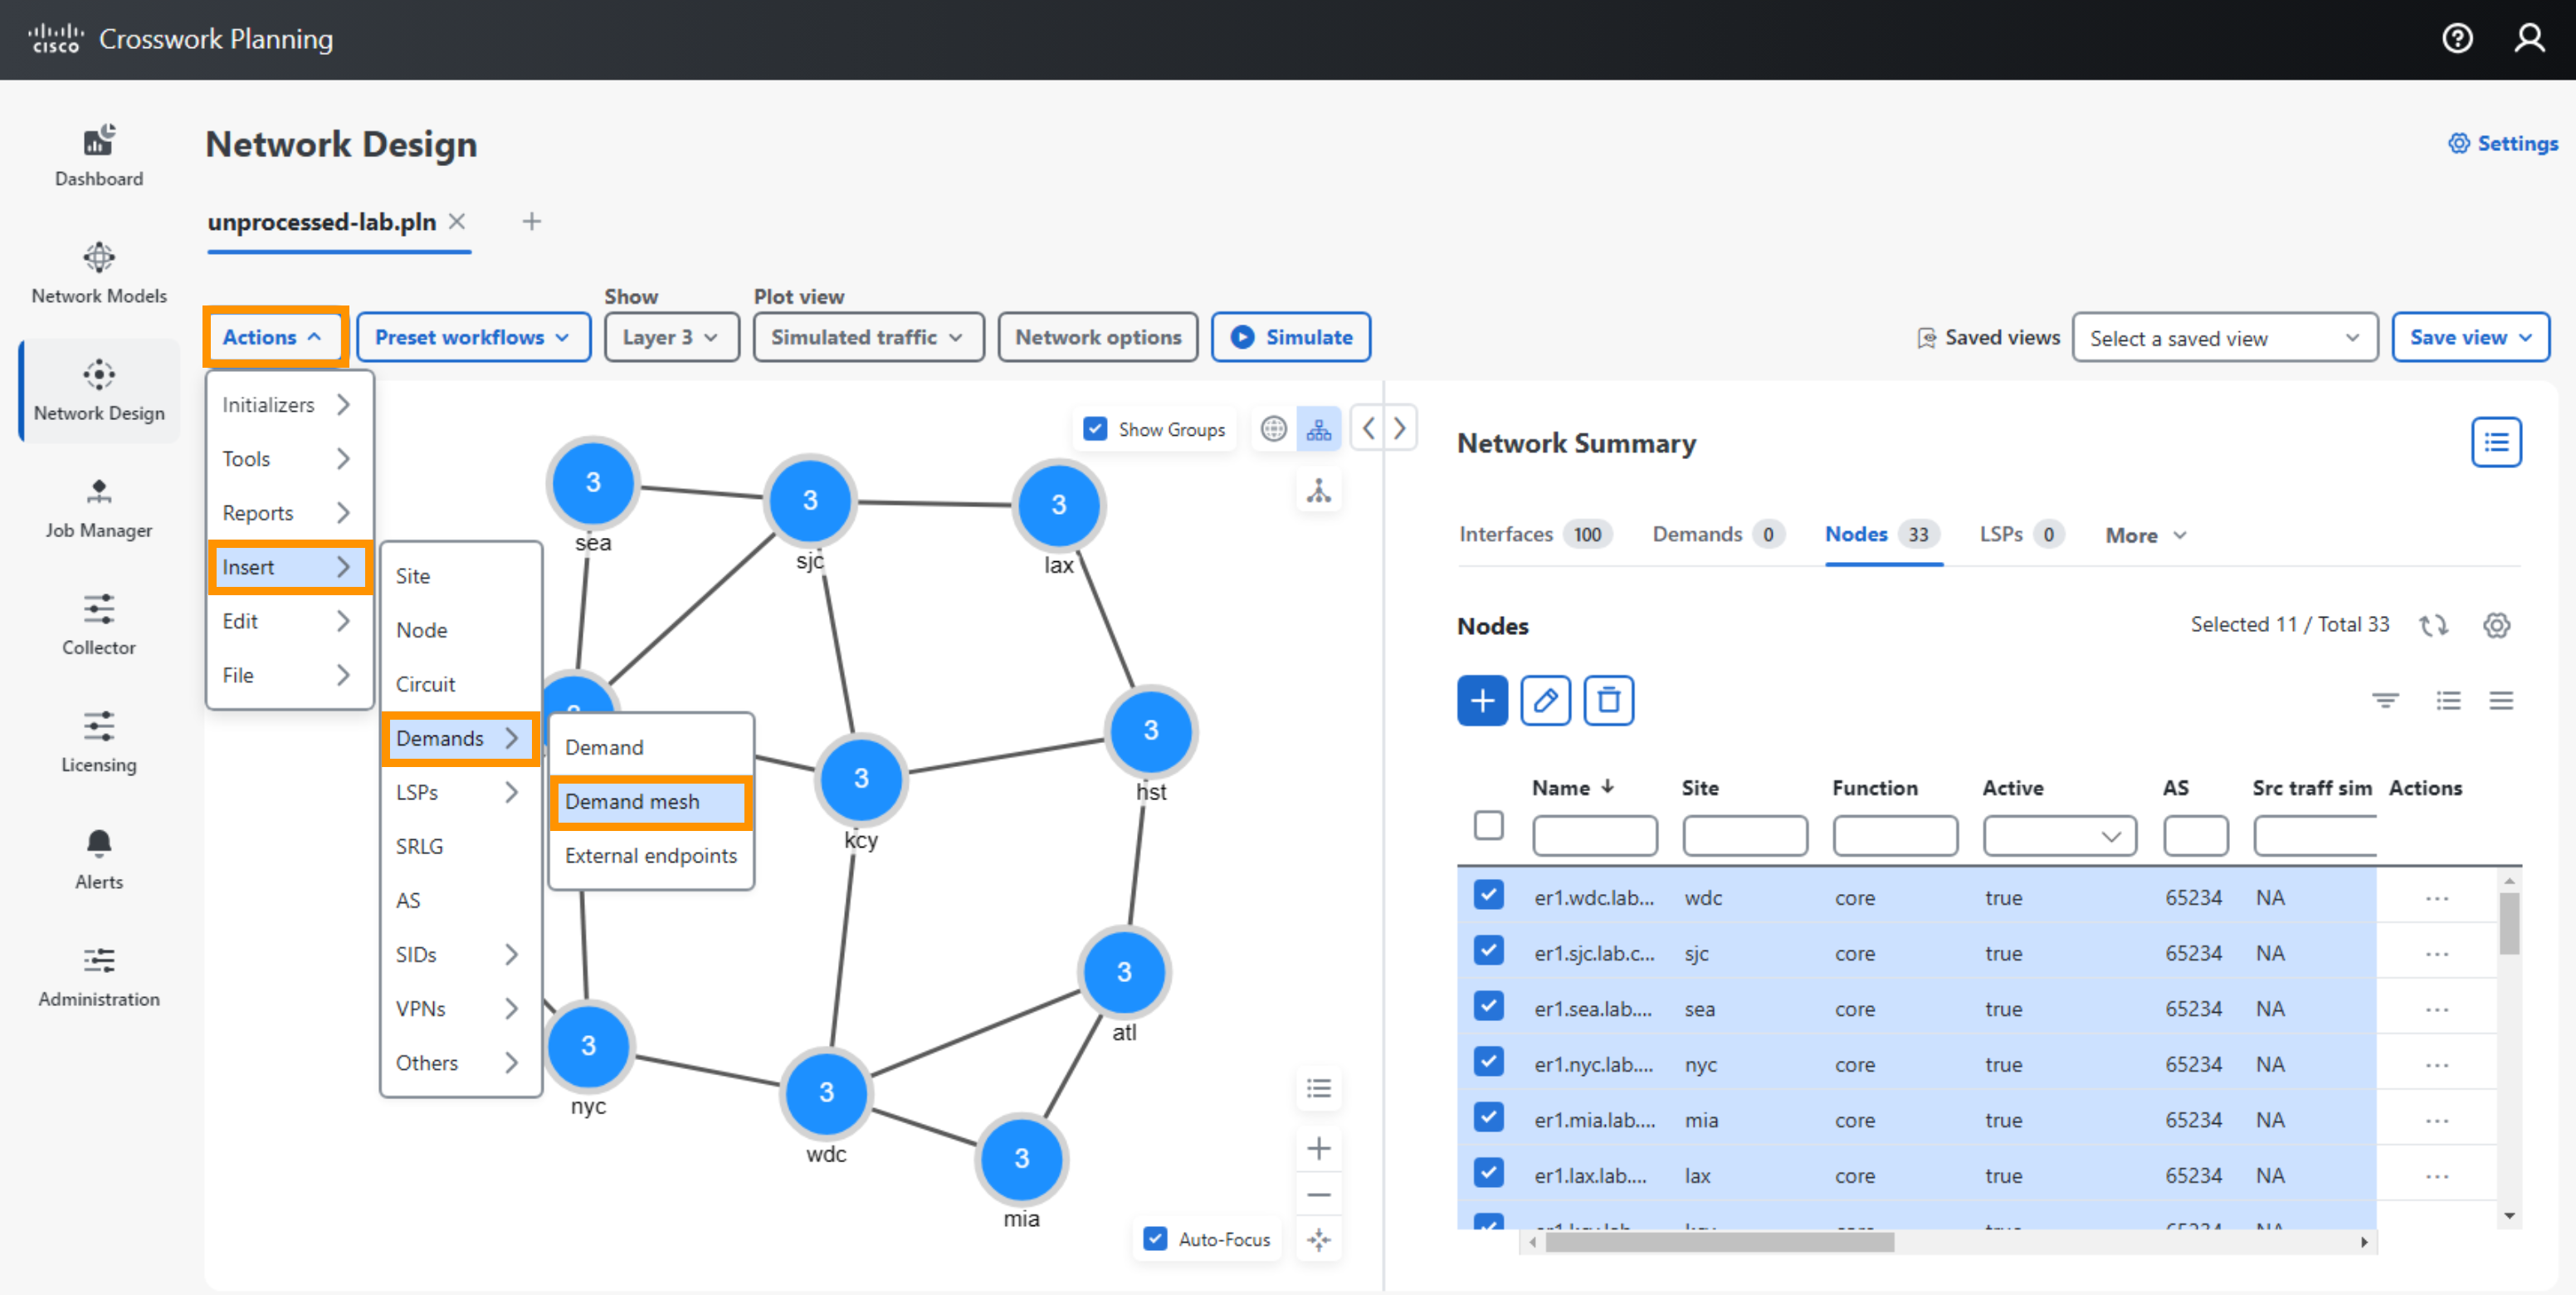
- Select Actions > Insert > Demands > Demand Mesh.
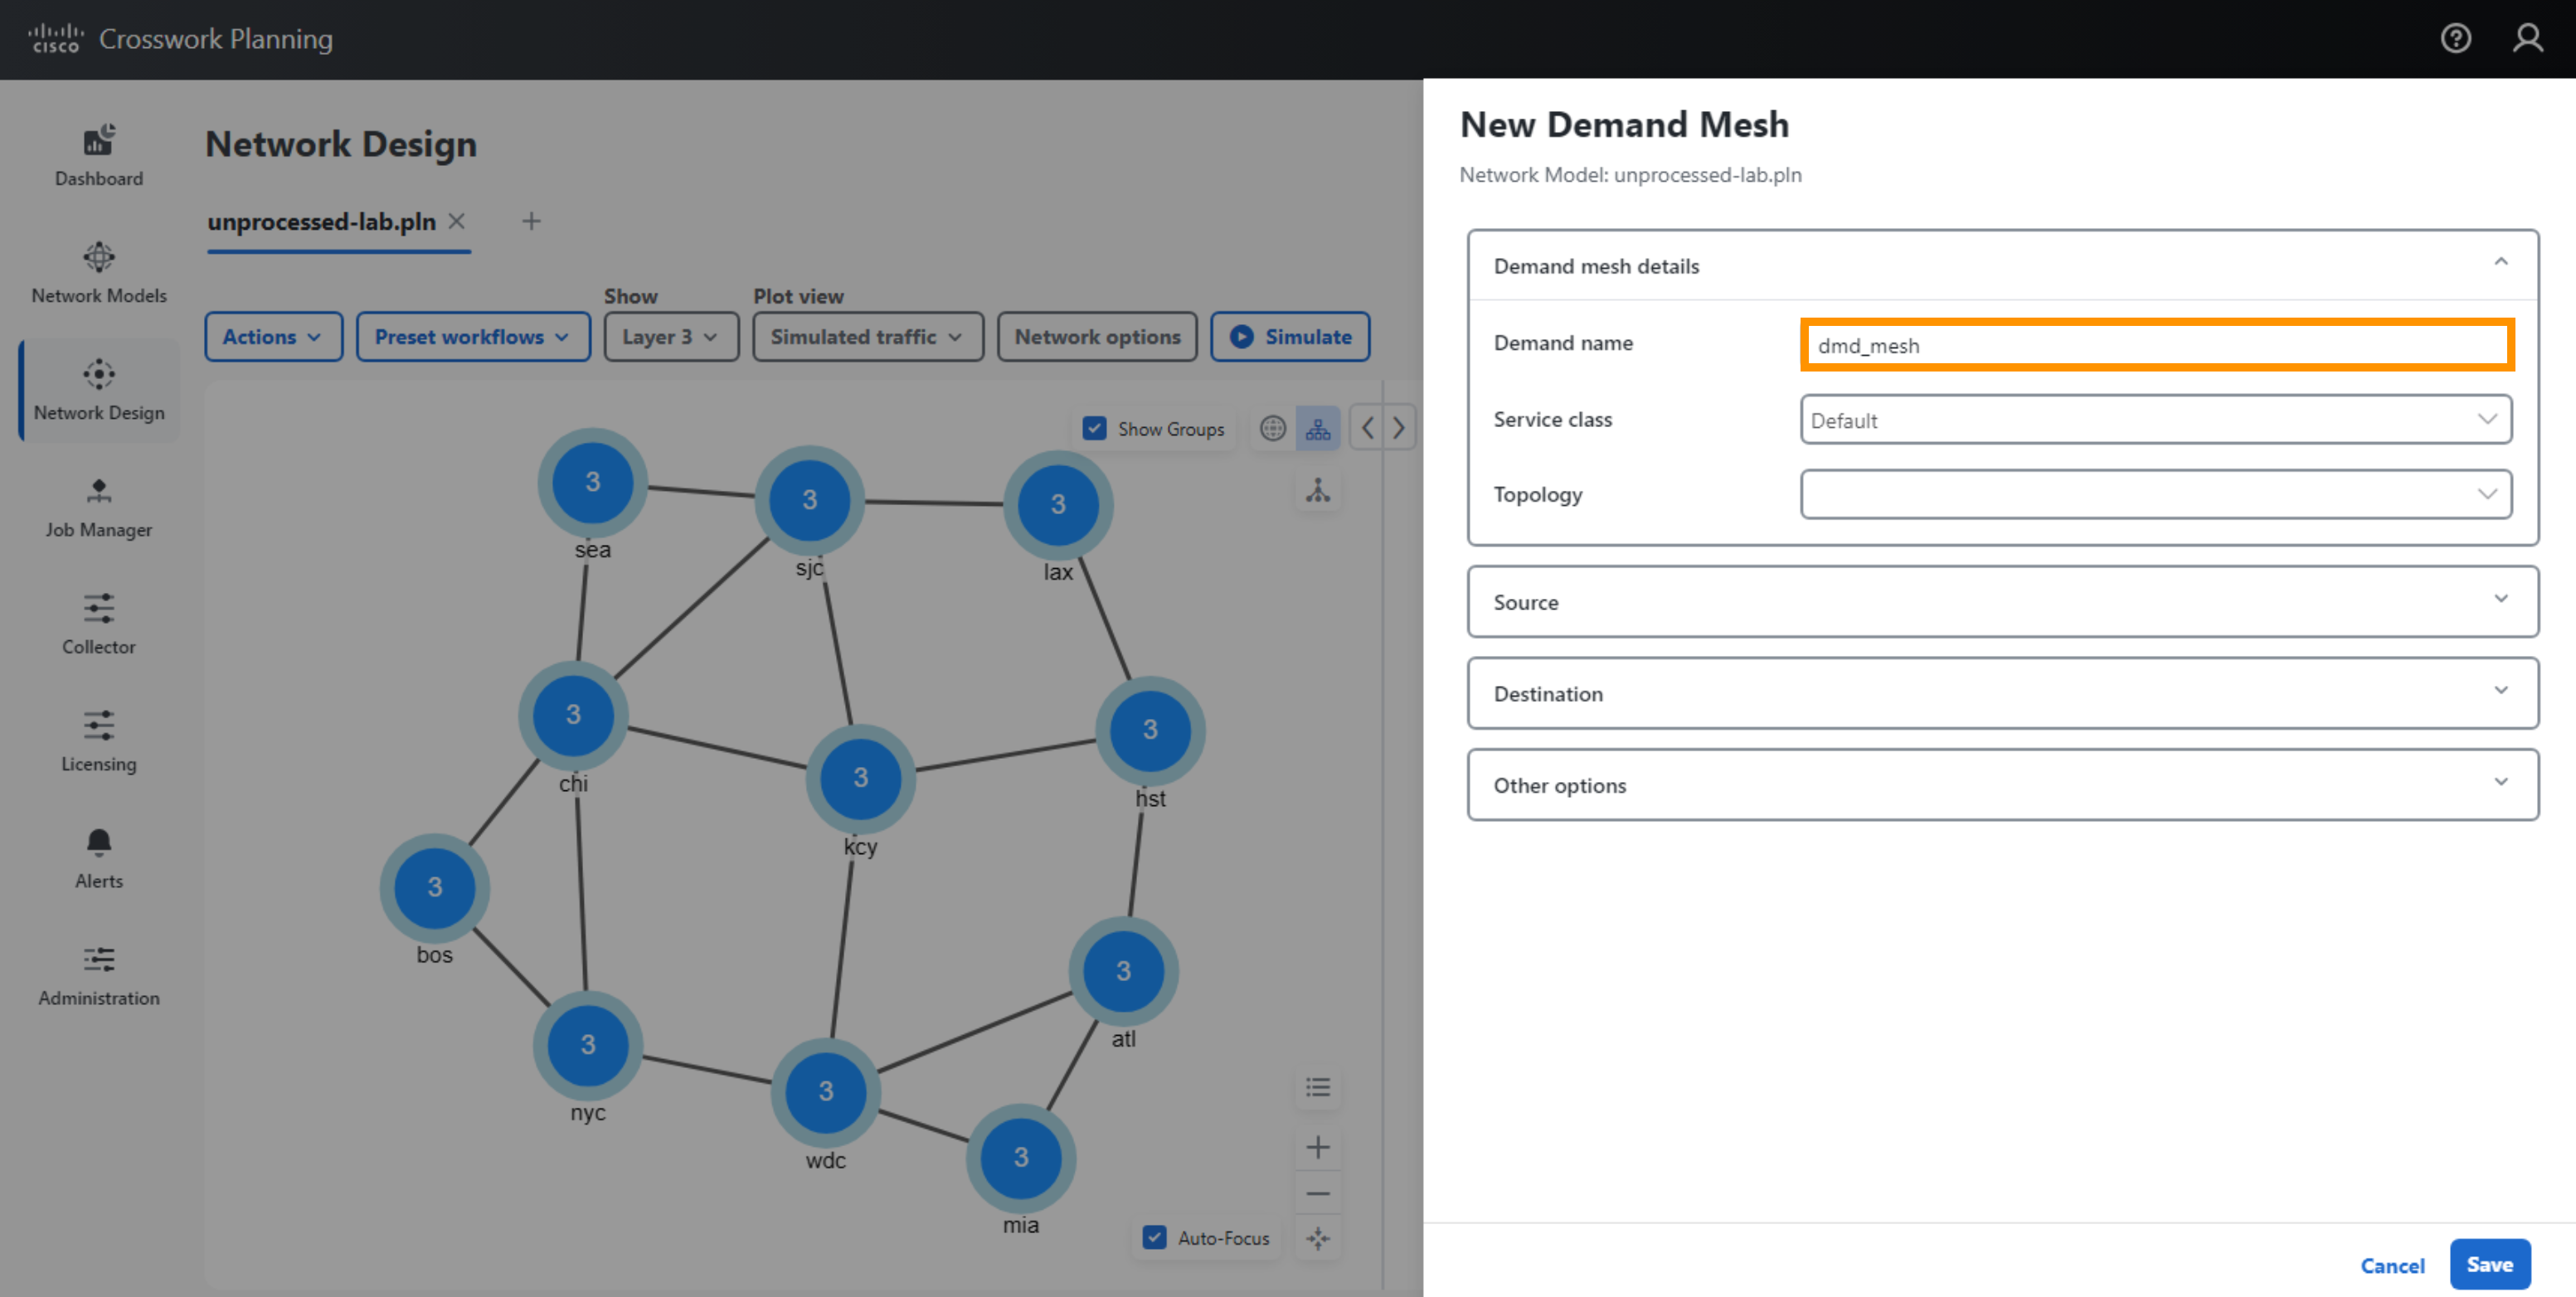
- Under Demand mesh details, enter the Demand name dmd_mesh.
- Under Sources: Nodes: Select “Selected in Table”
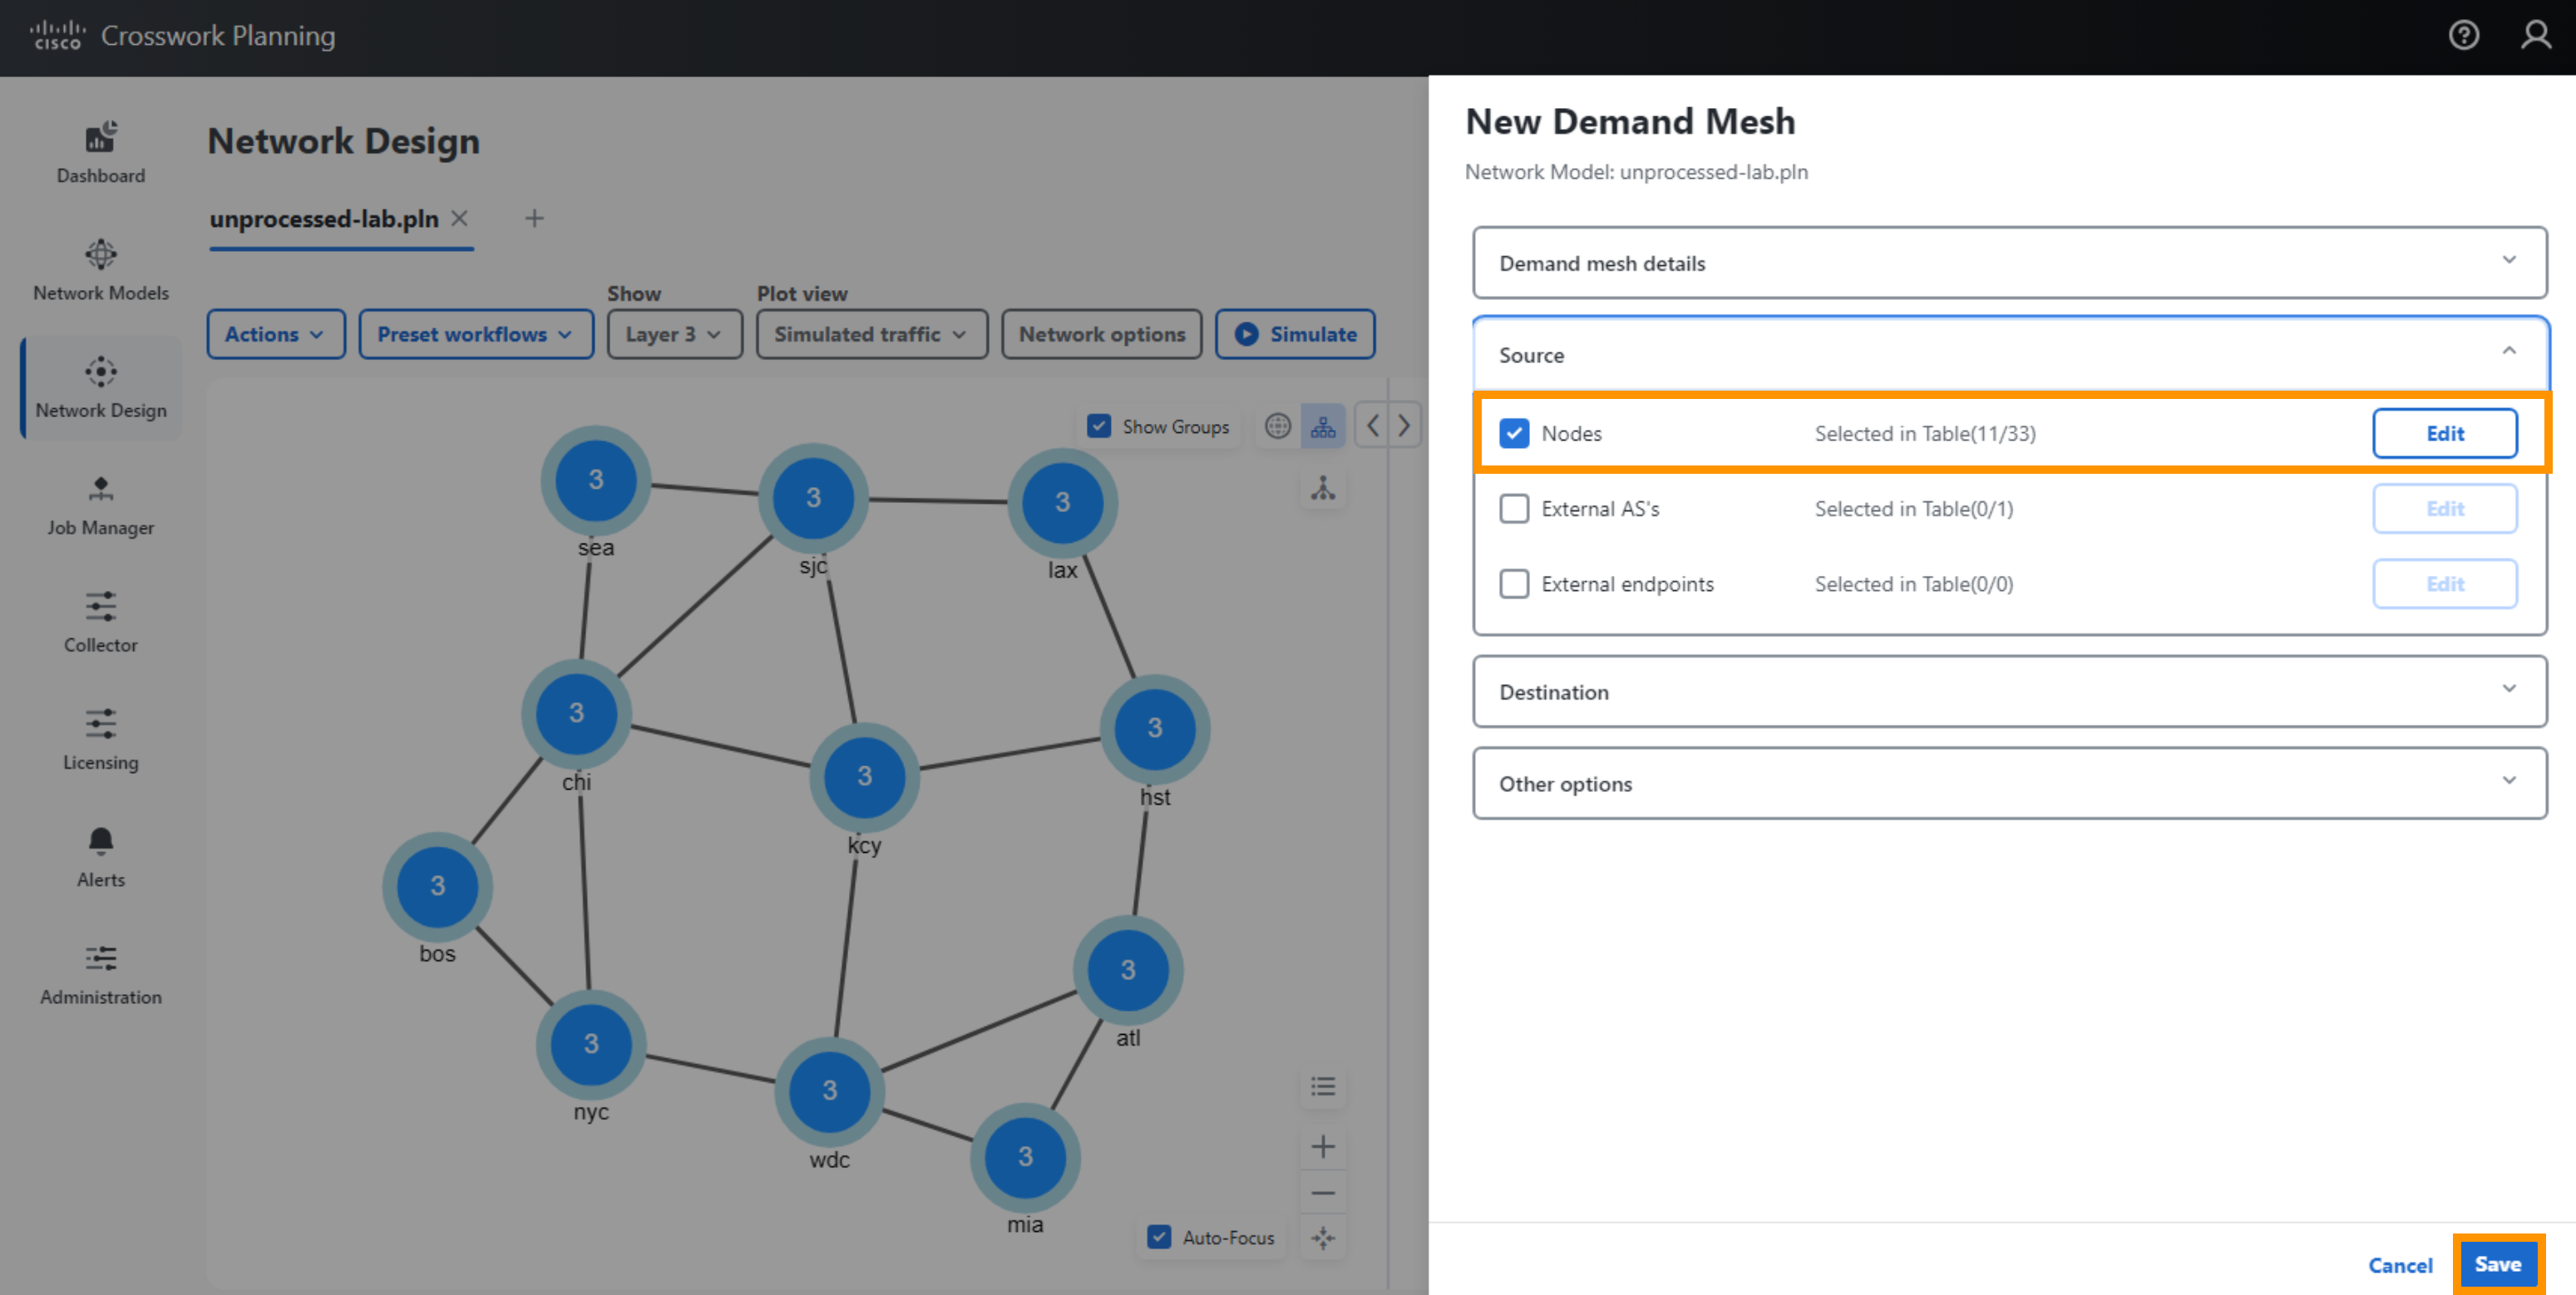
- You can keep all the default options and select Save.
Step 7 Run Demand Deduction
Now the demands are in the model, but the demand traffic values are 0 (mbps). Crosswork Planning has a tool called Demand Deduction that uses measured data from the network to determine what the demand traffic values should be.
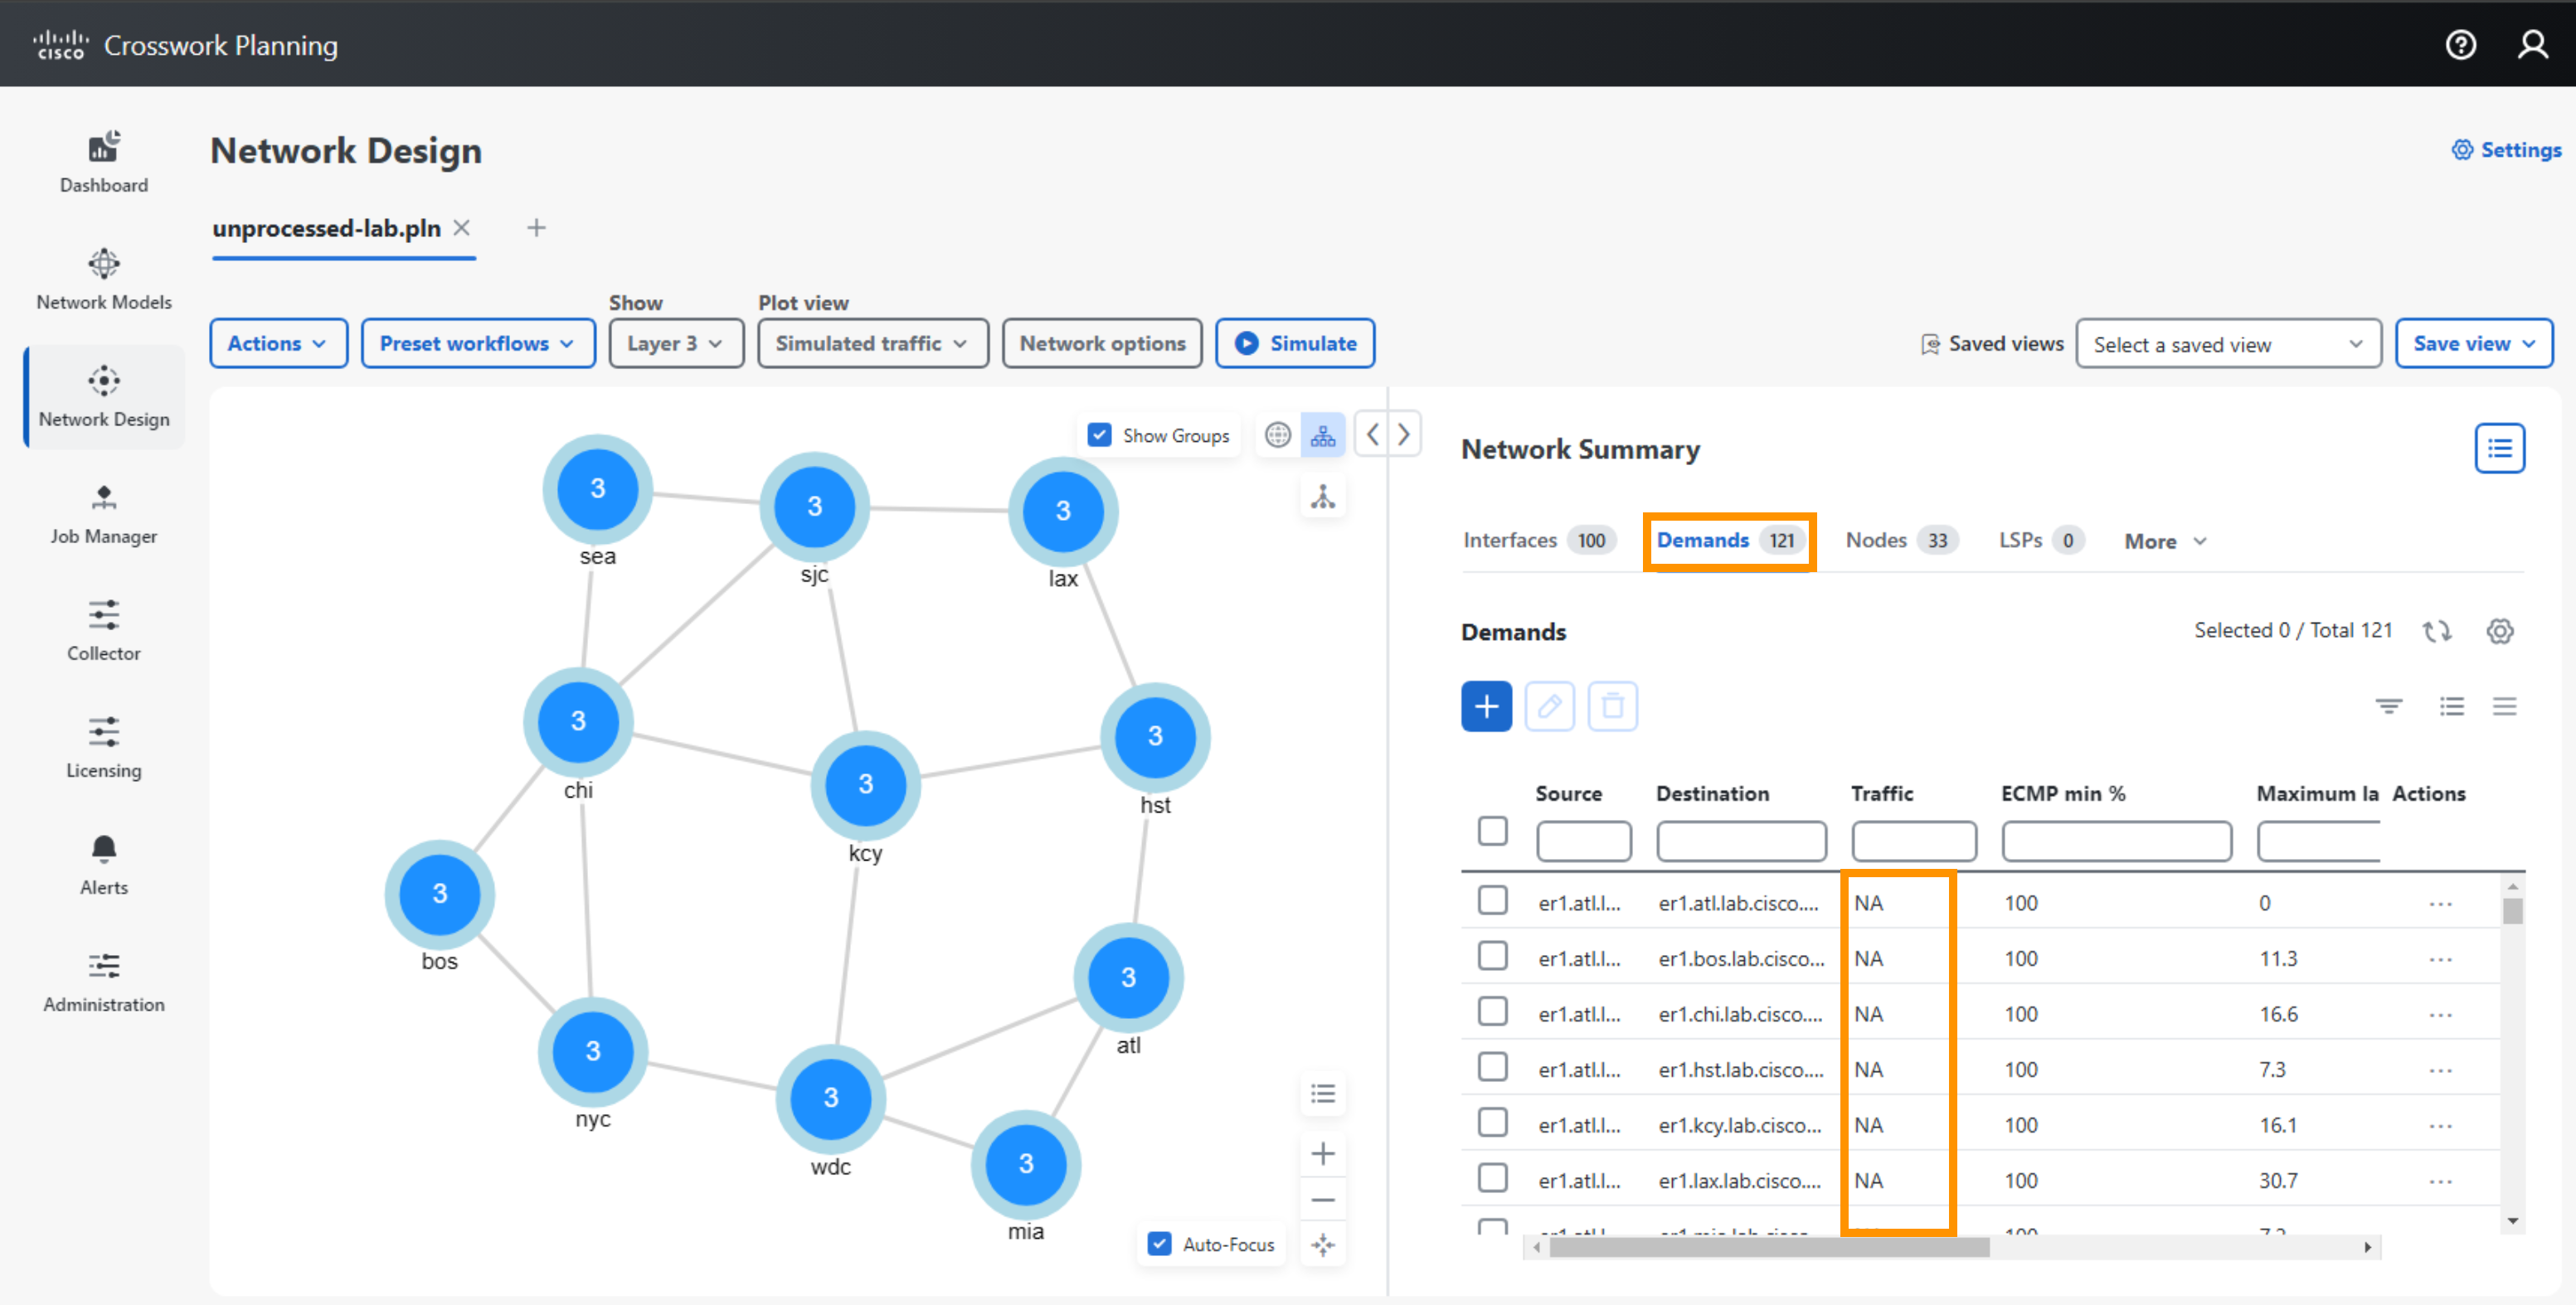
[INFO] In this network we have collected SNMP traffic data on the interfaces. If you select an interface and filter to demands, notice that the sum of the demands going through the interface must equal the measured traffic value. If you were to do this on the entire network, you would begin to see a large system of linear equations. Crosswork Planning Design has a tool called Demand Deduction that takes this, and other information into account to solve the per demand traffic values. NetFlow data can be used in helping determine the demand values, but NetFlow is not requirement for this process.
To run Demand Deduction
- Select Actions > Tools > Demand Deduction.
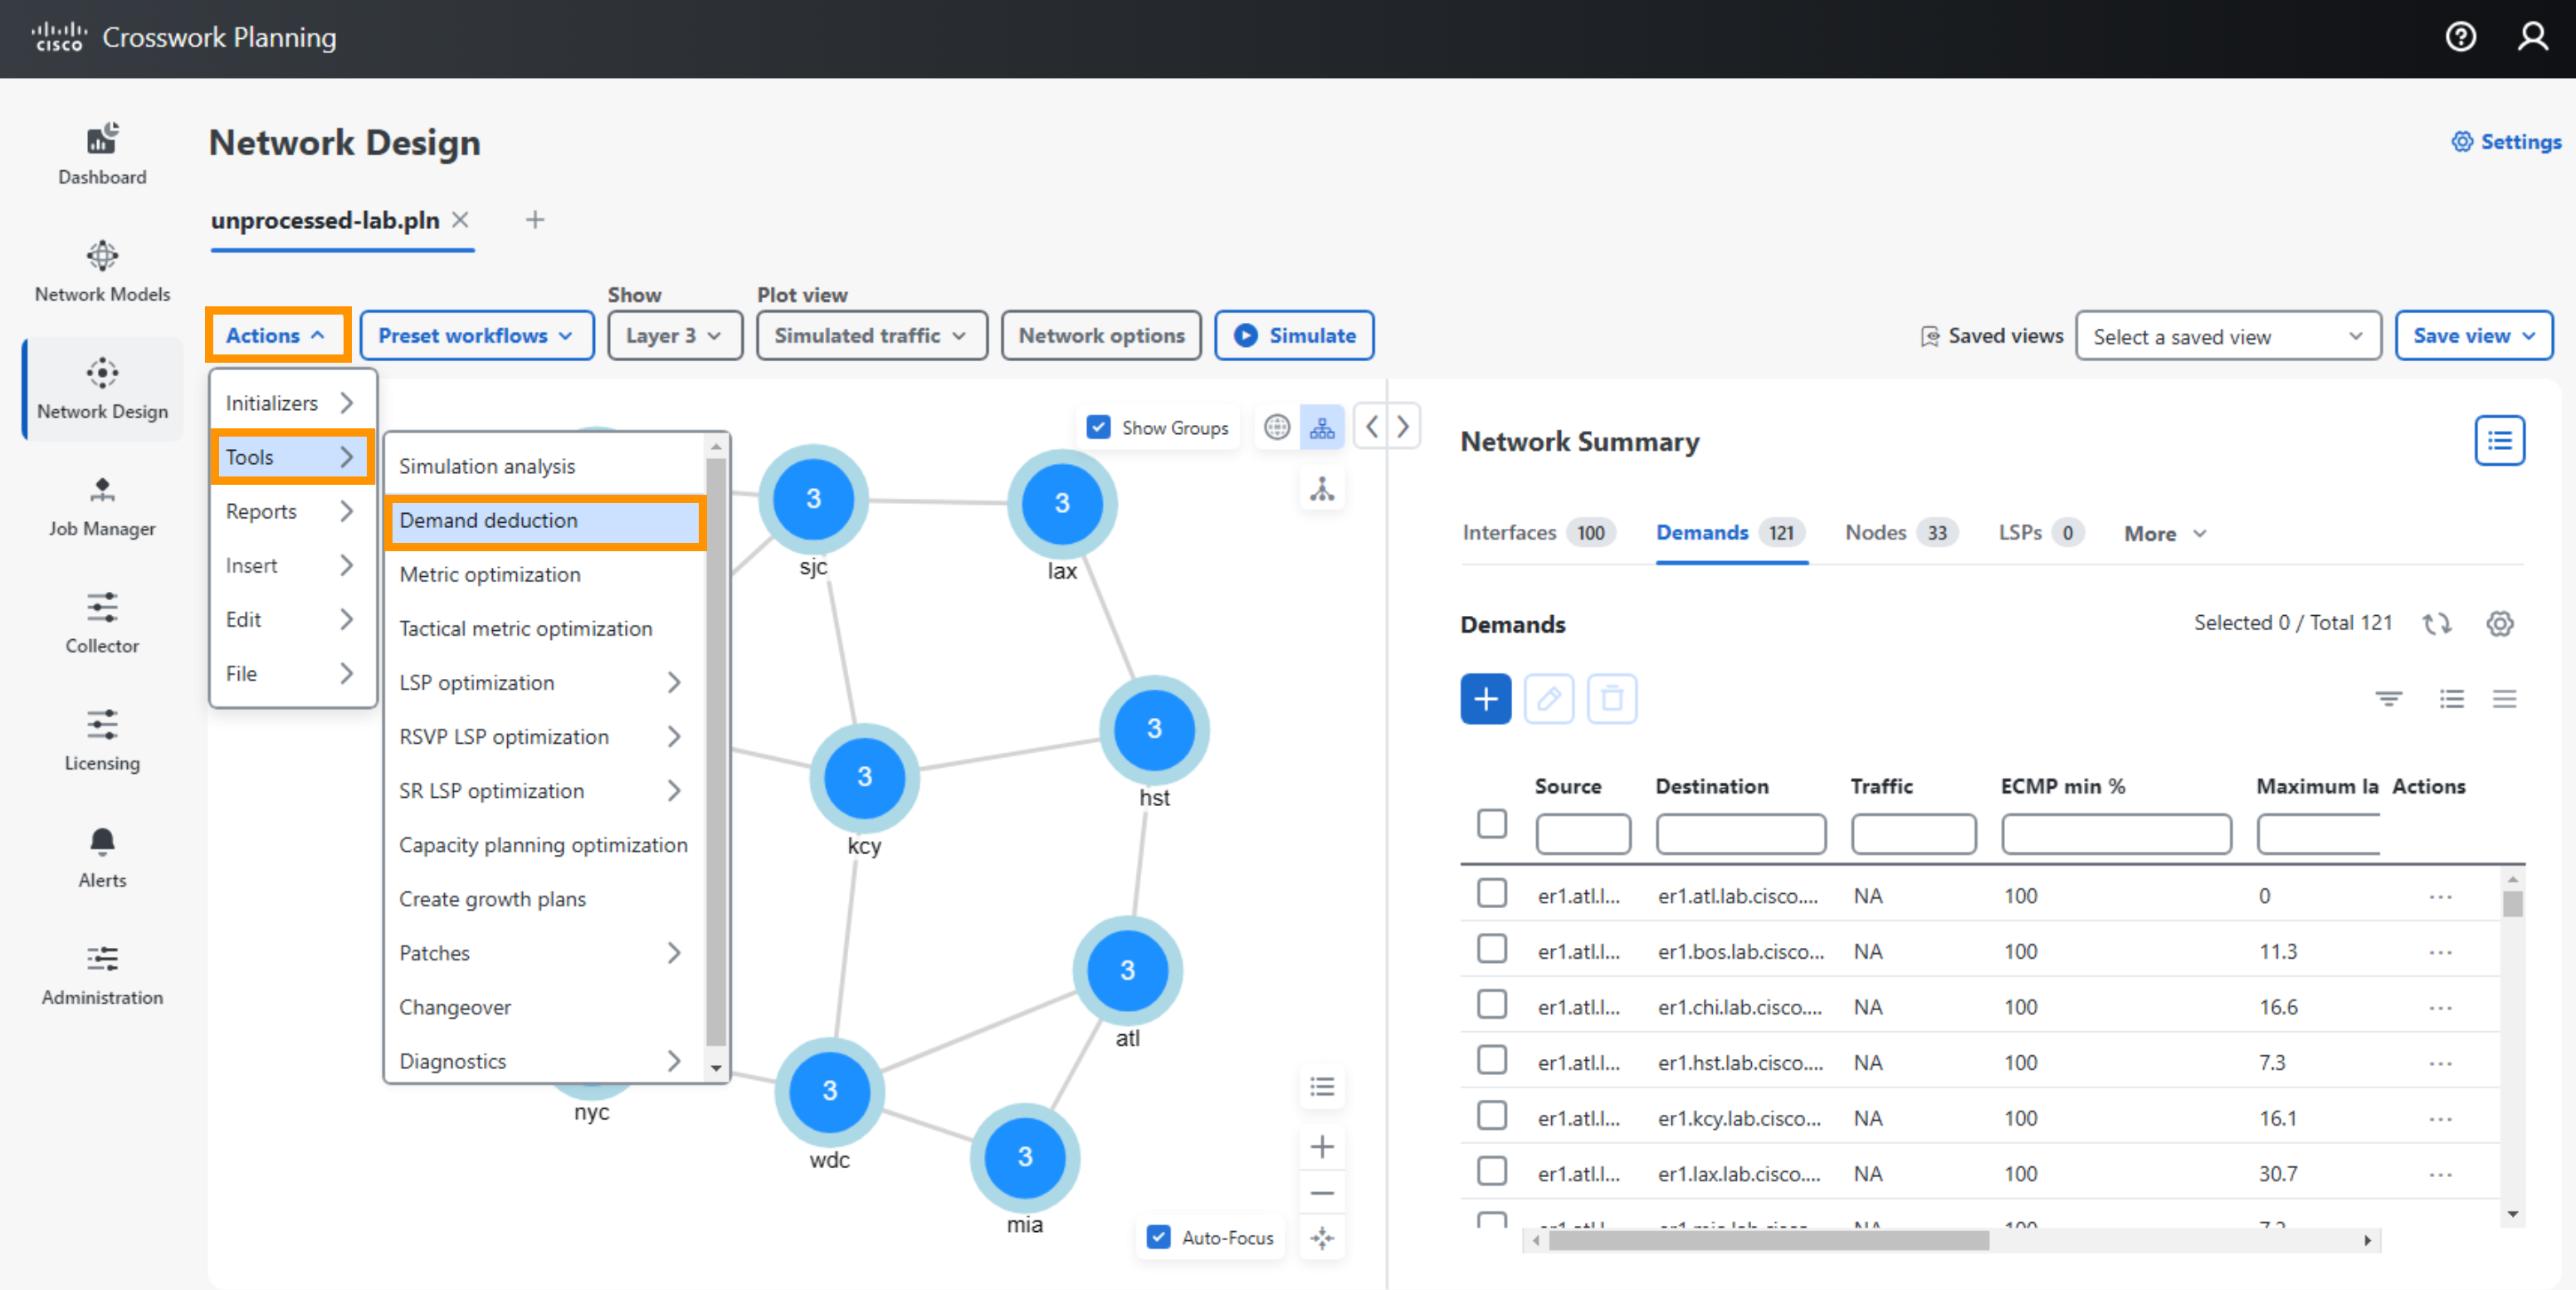
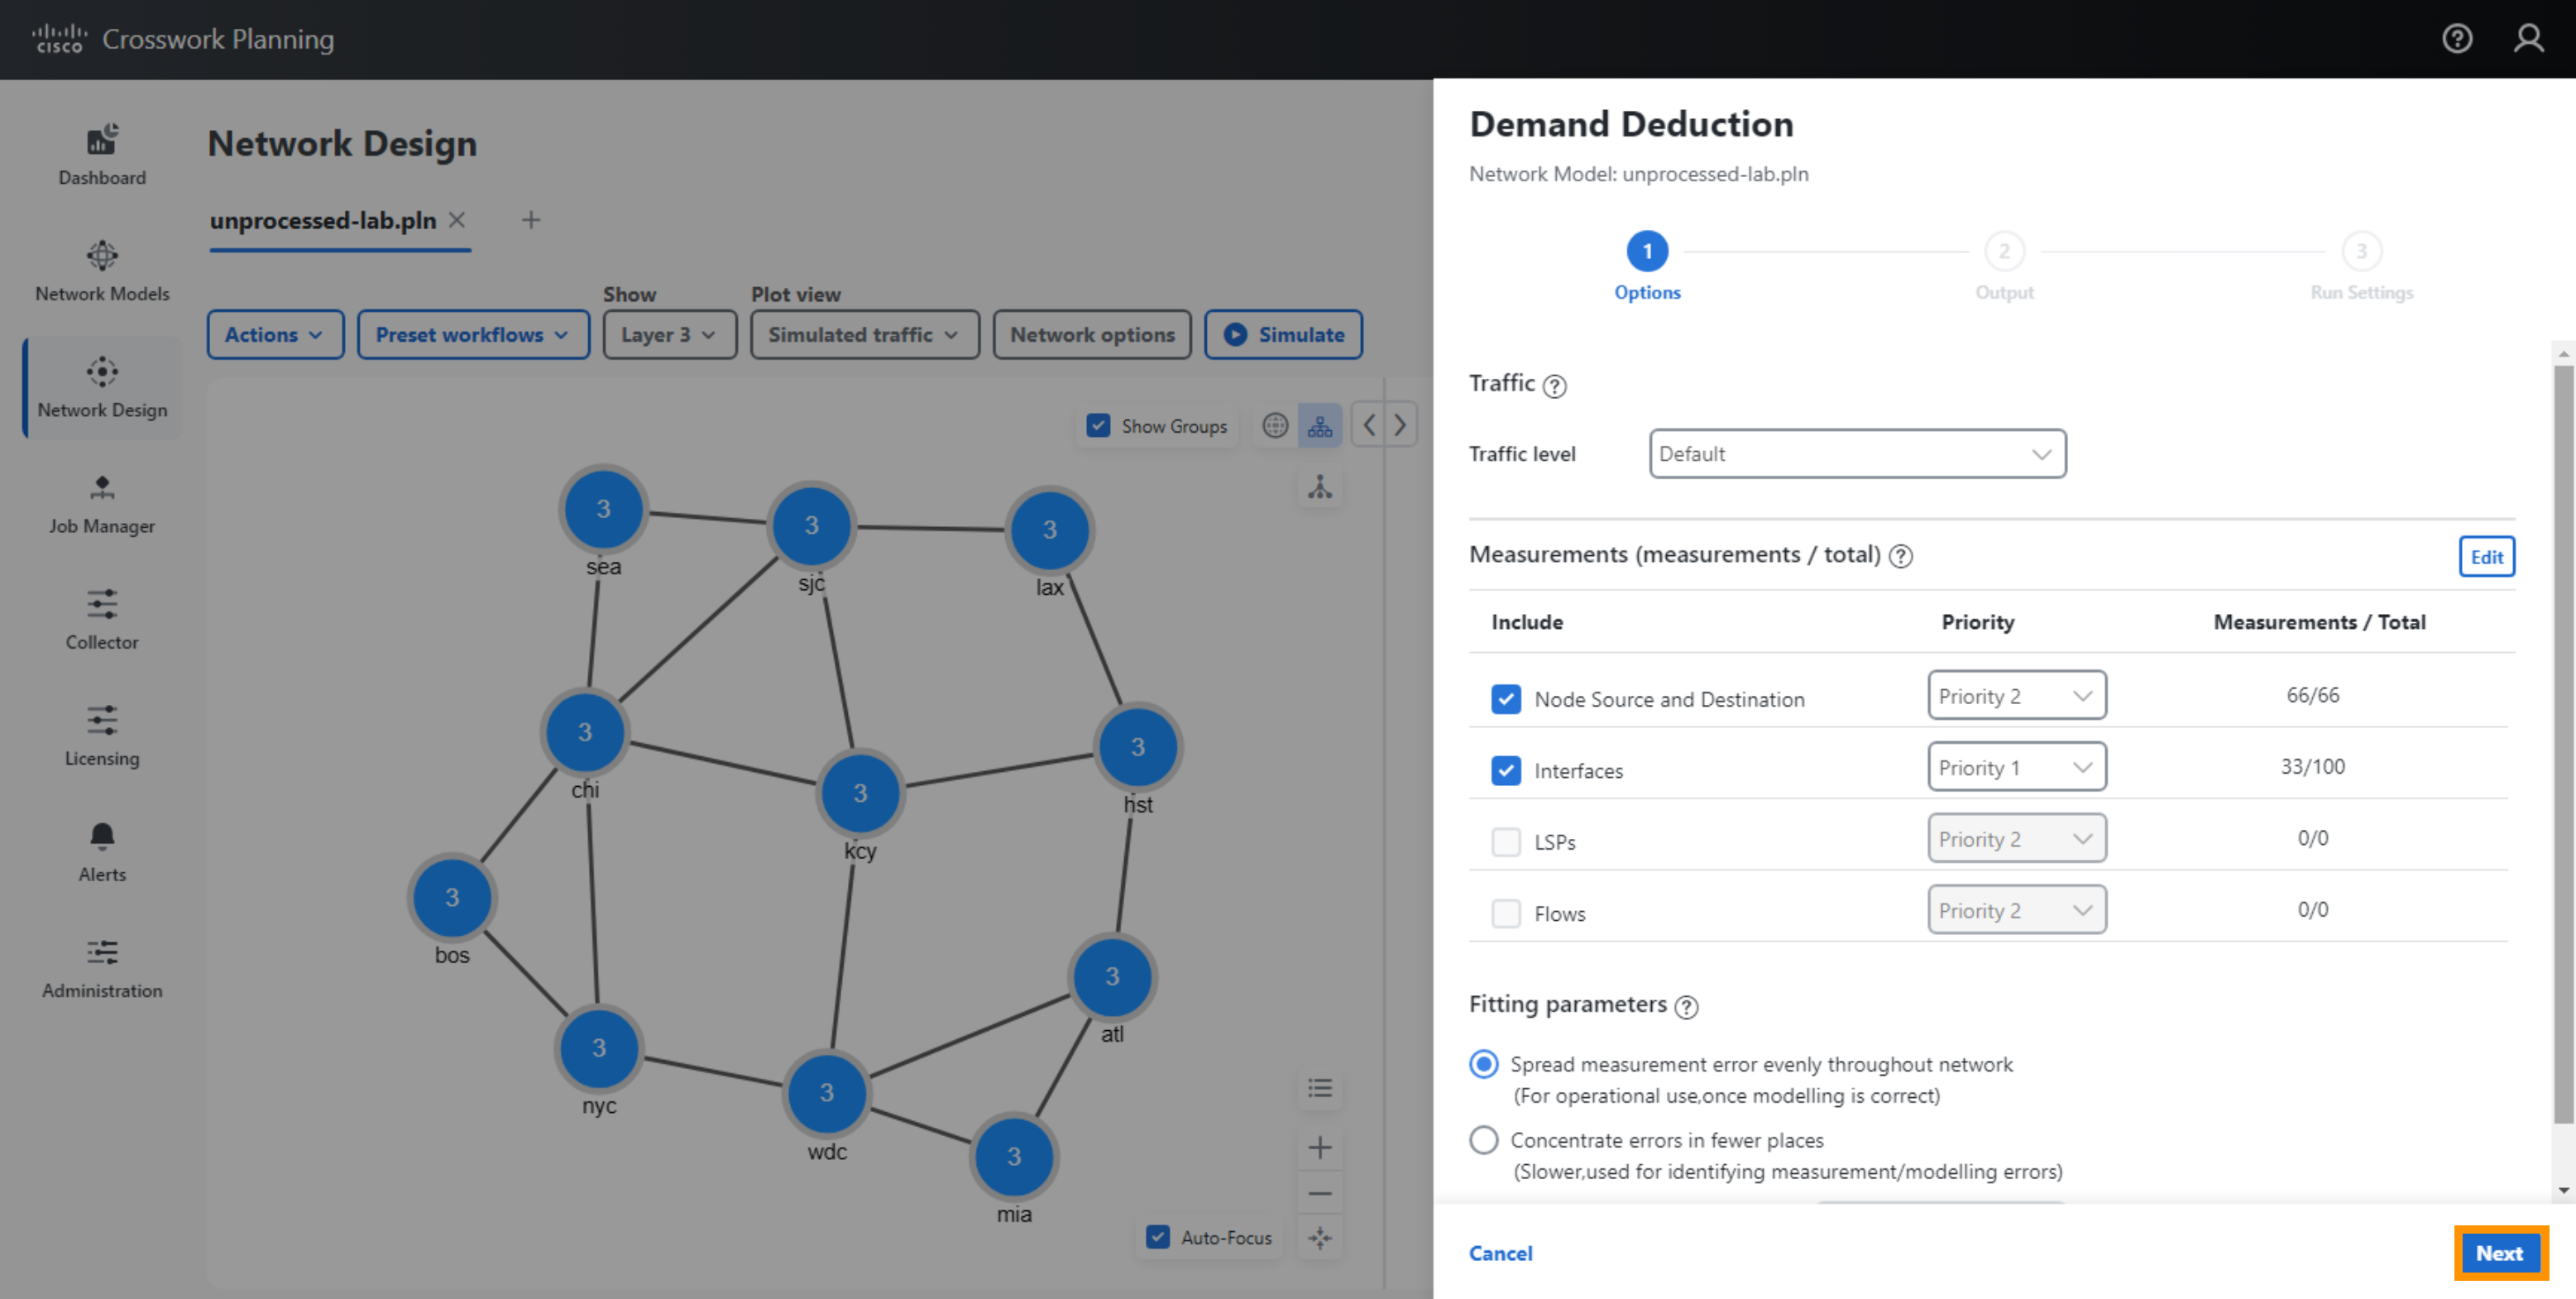
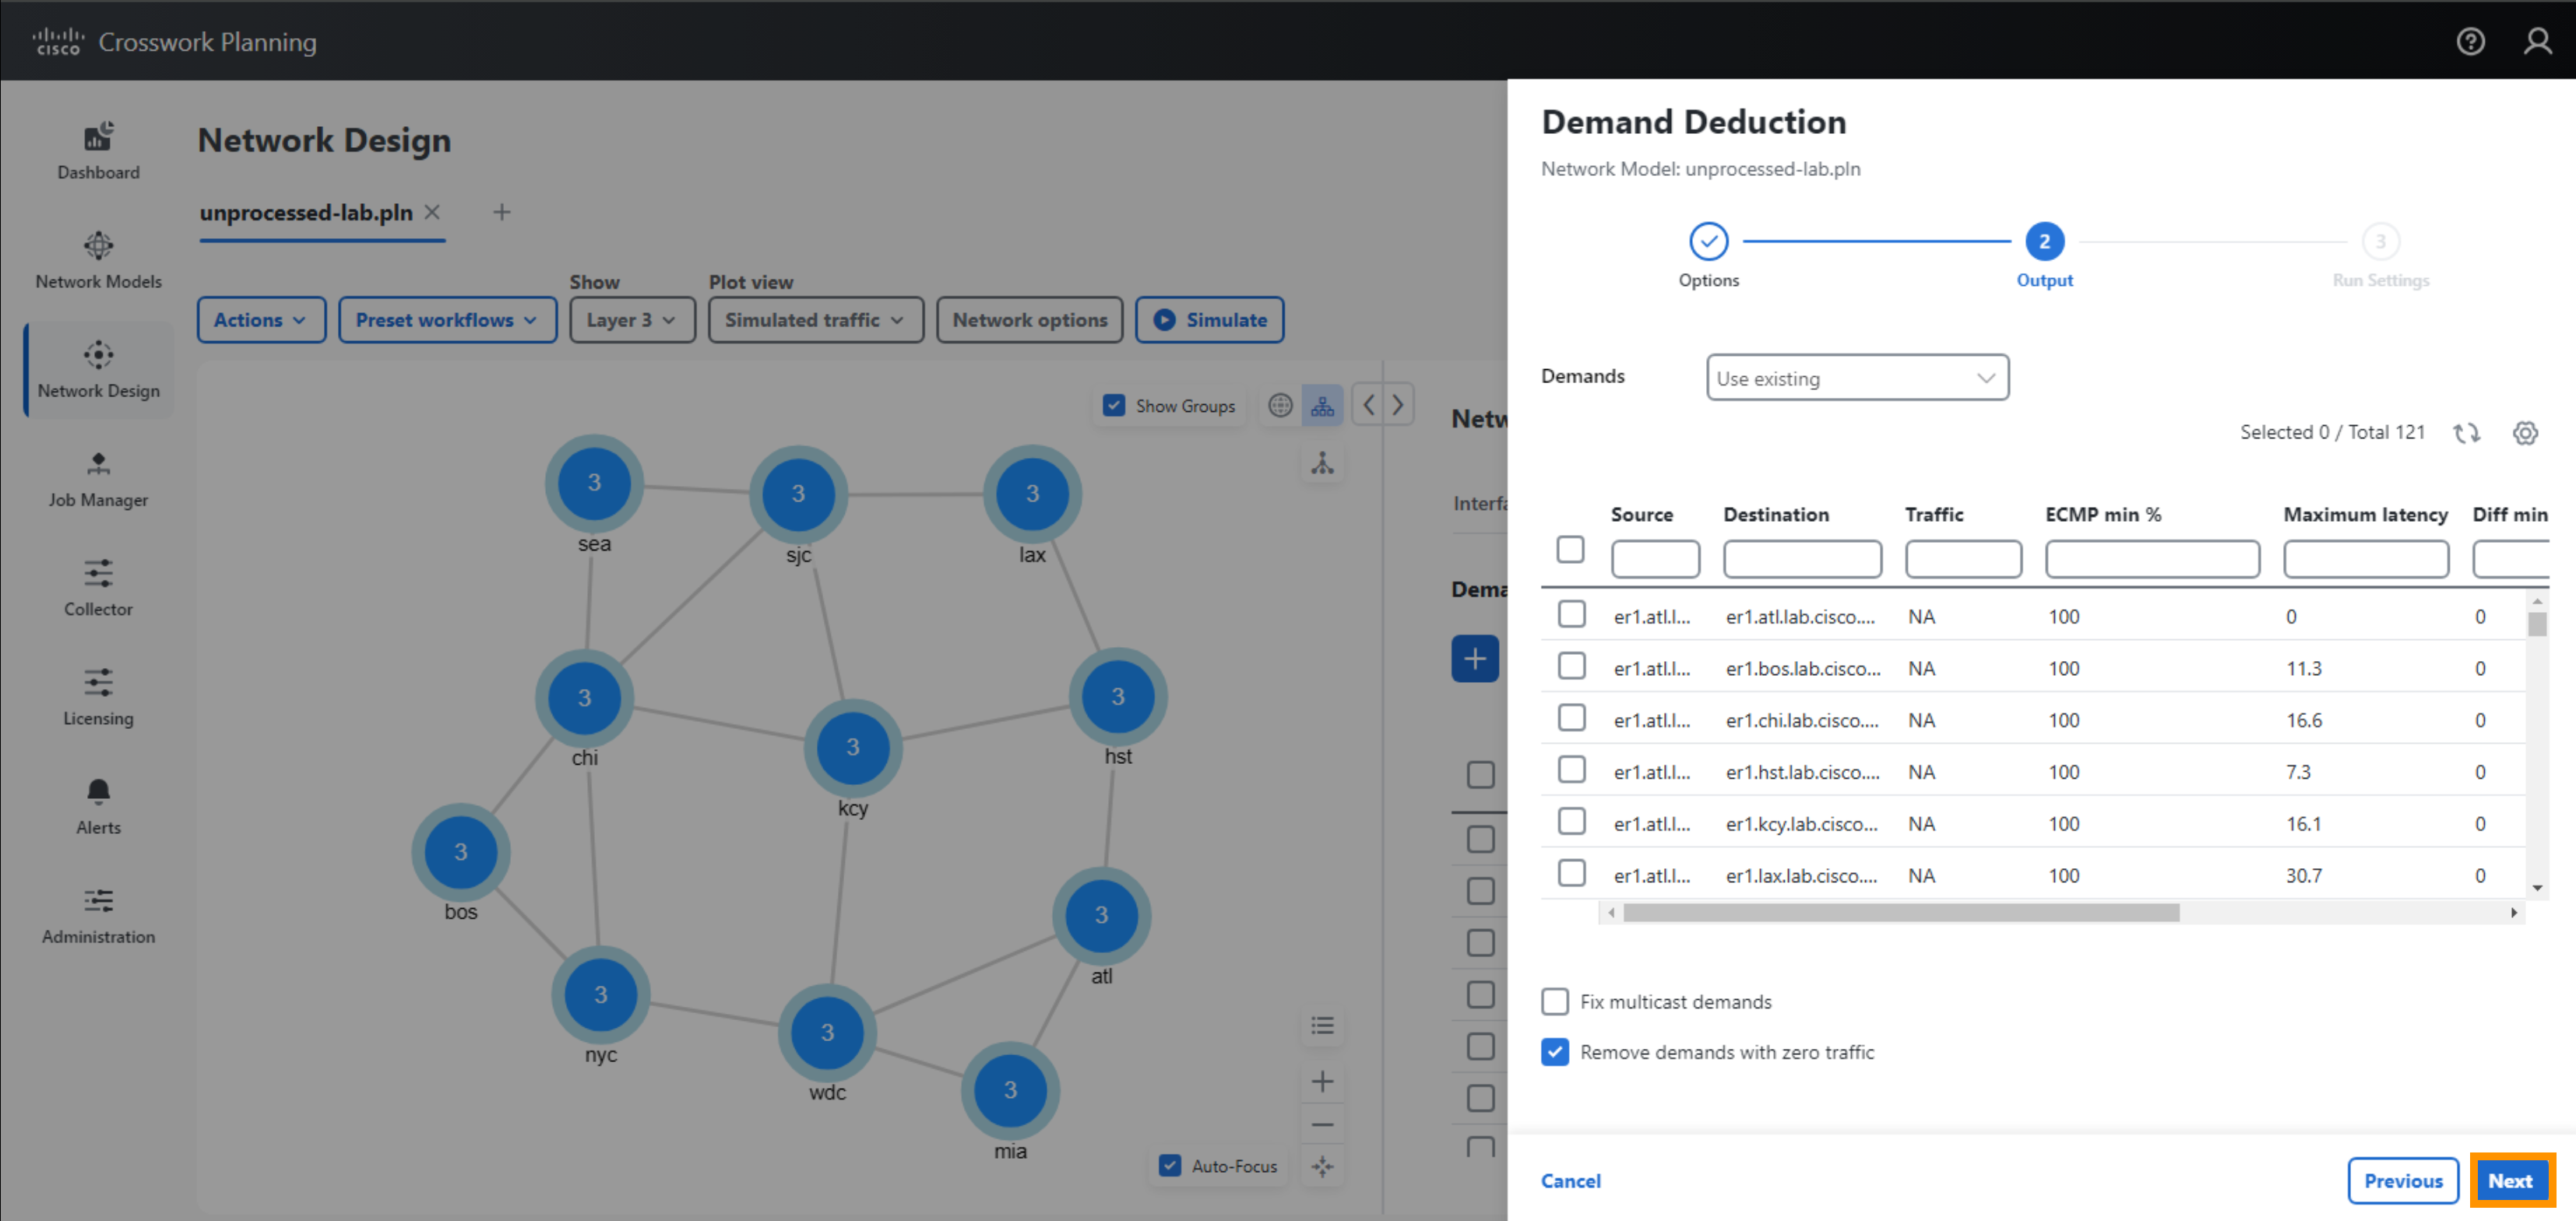
- You can keep all default values and select Next for Options, Output and Run Settings.
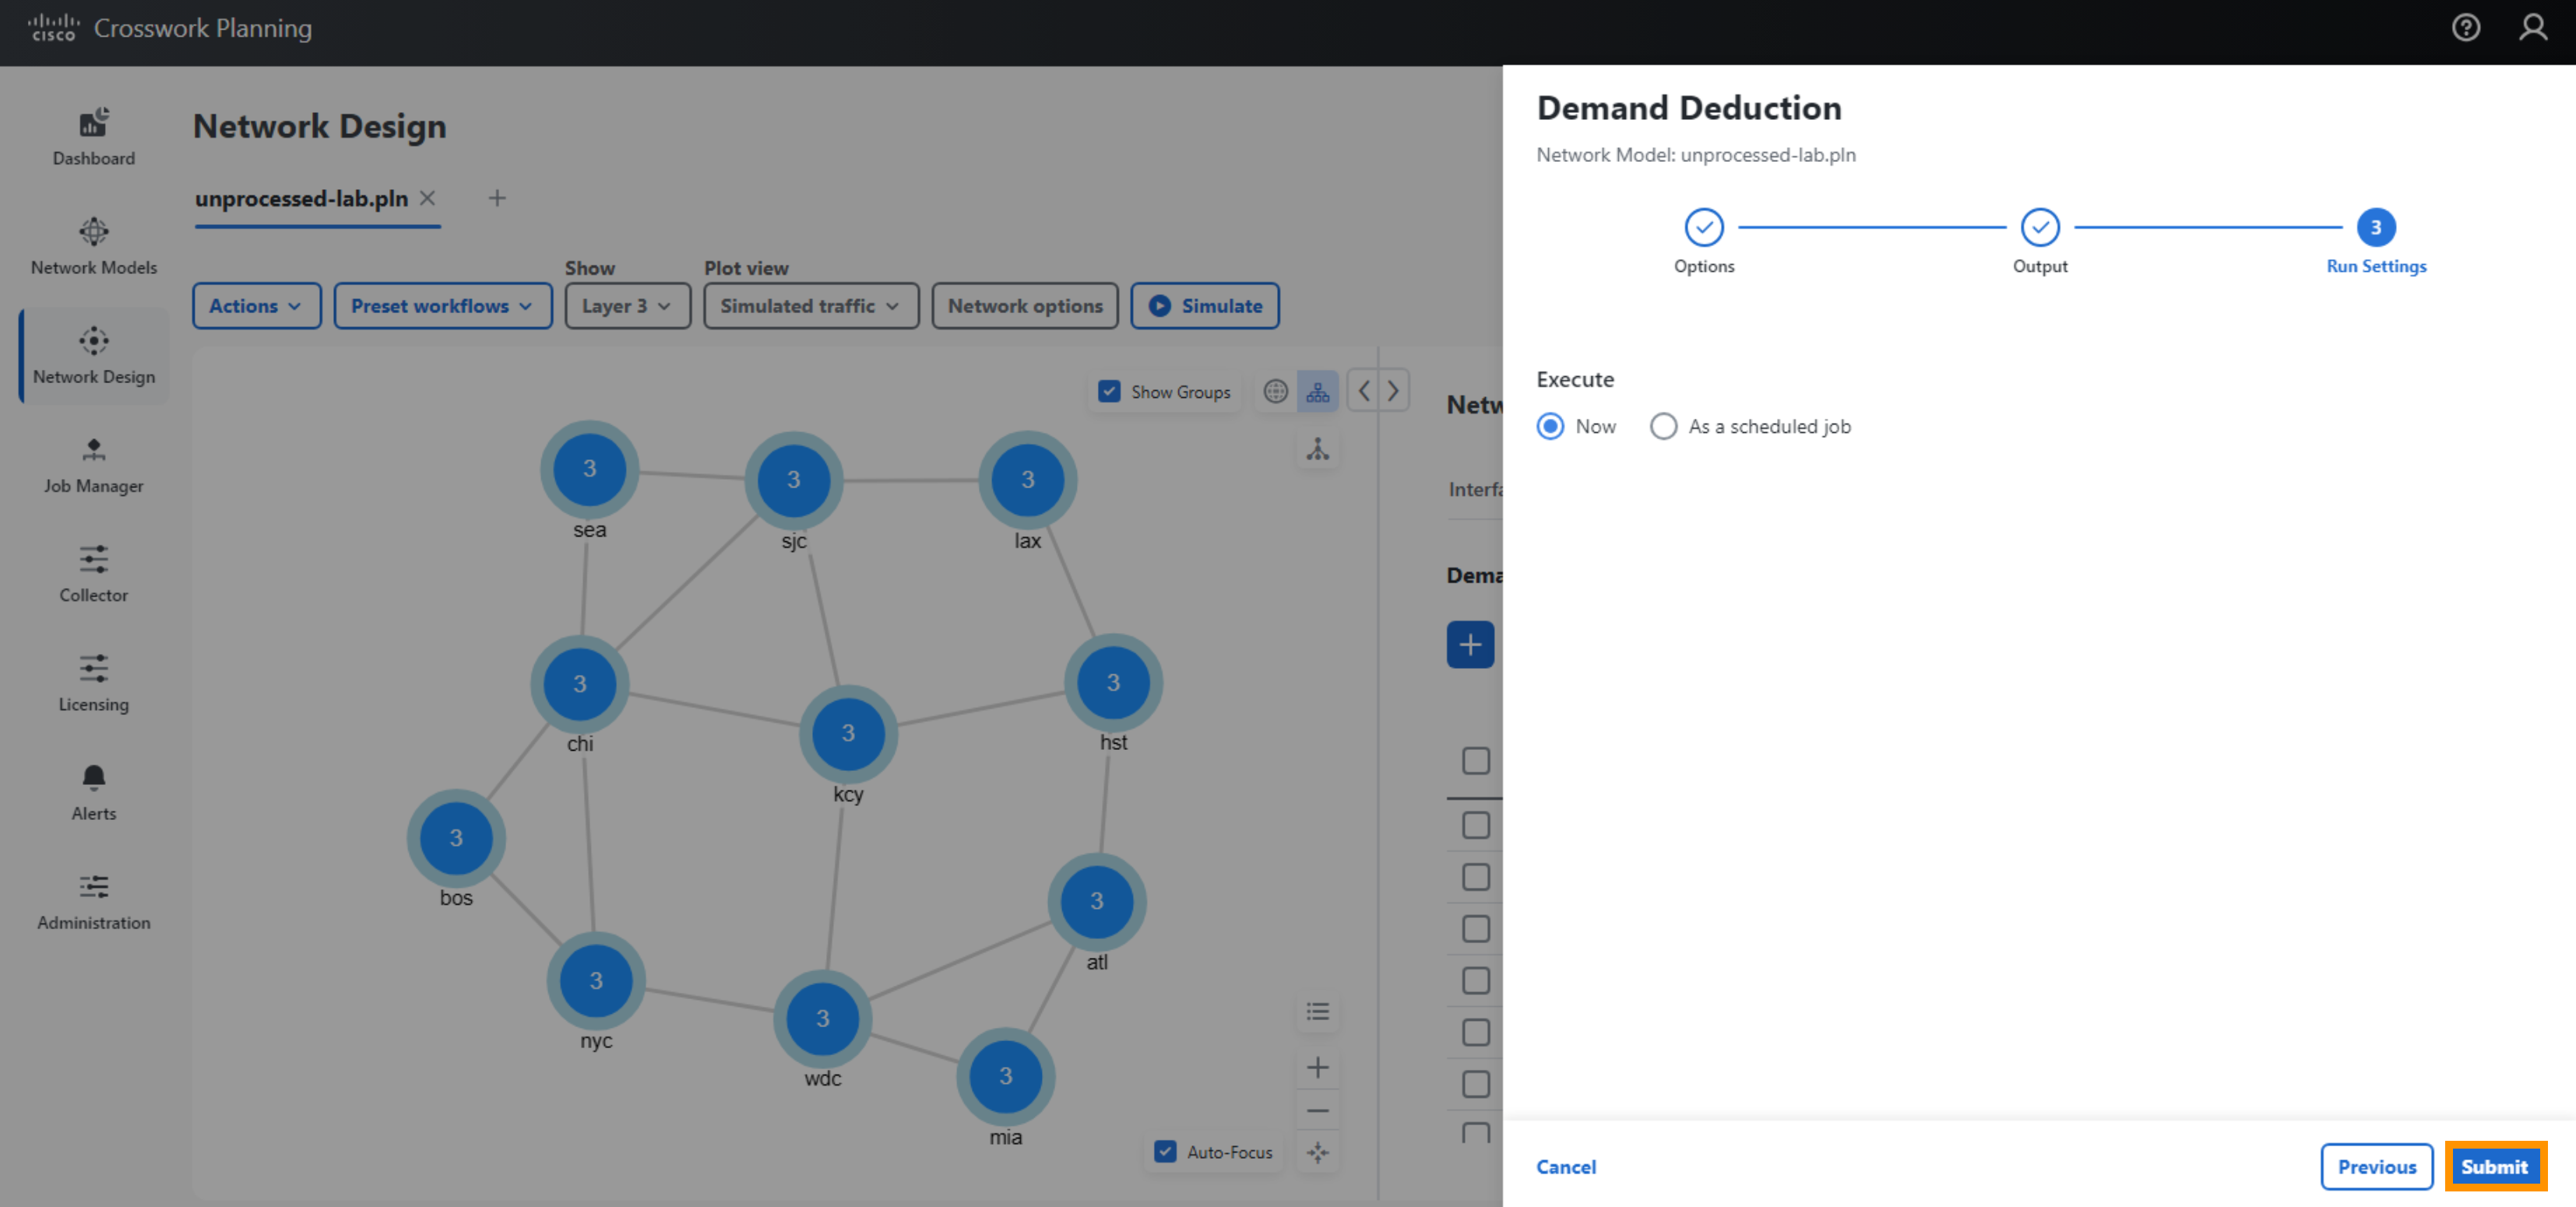
After Demand Deduction has completed running, it will generate a report. Close the report.
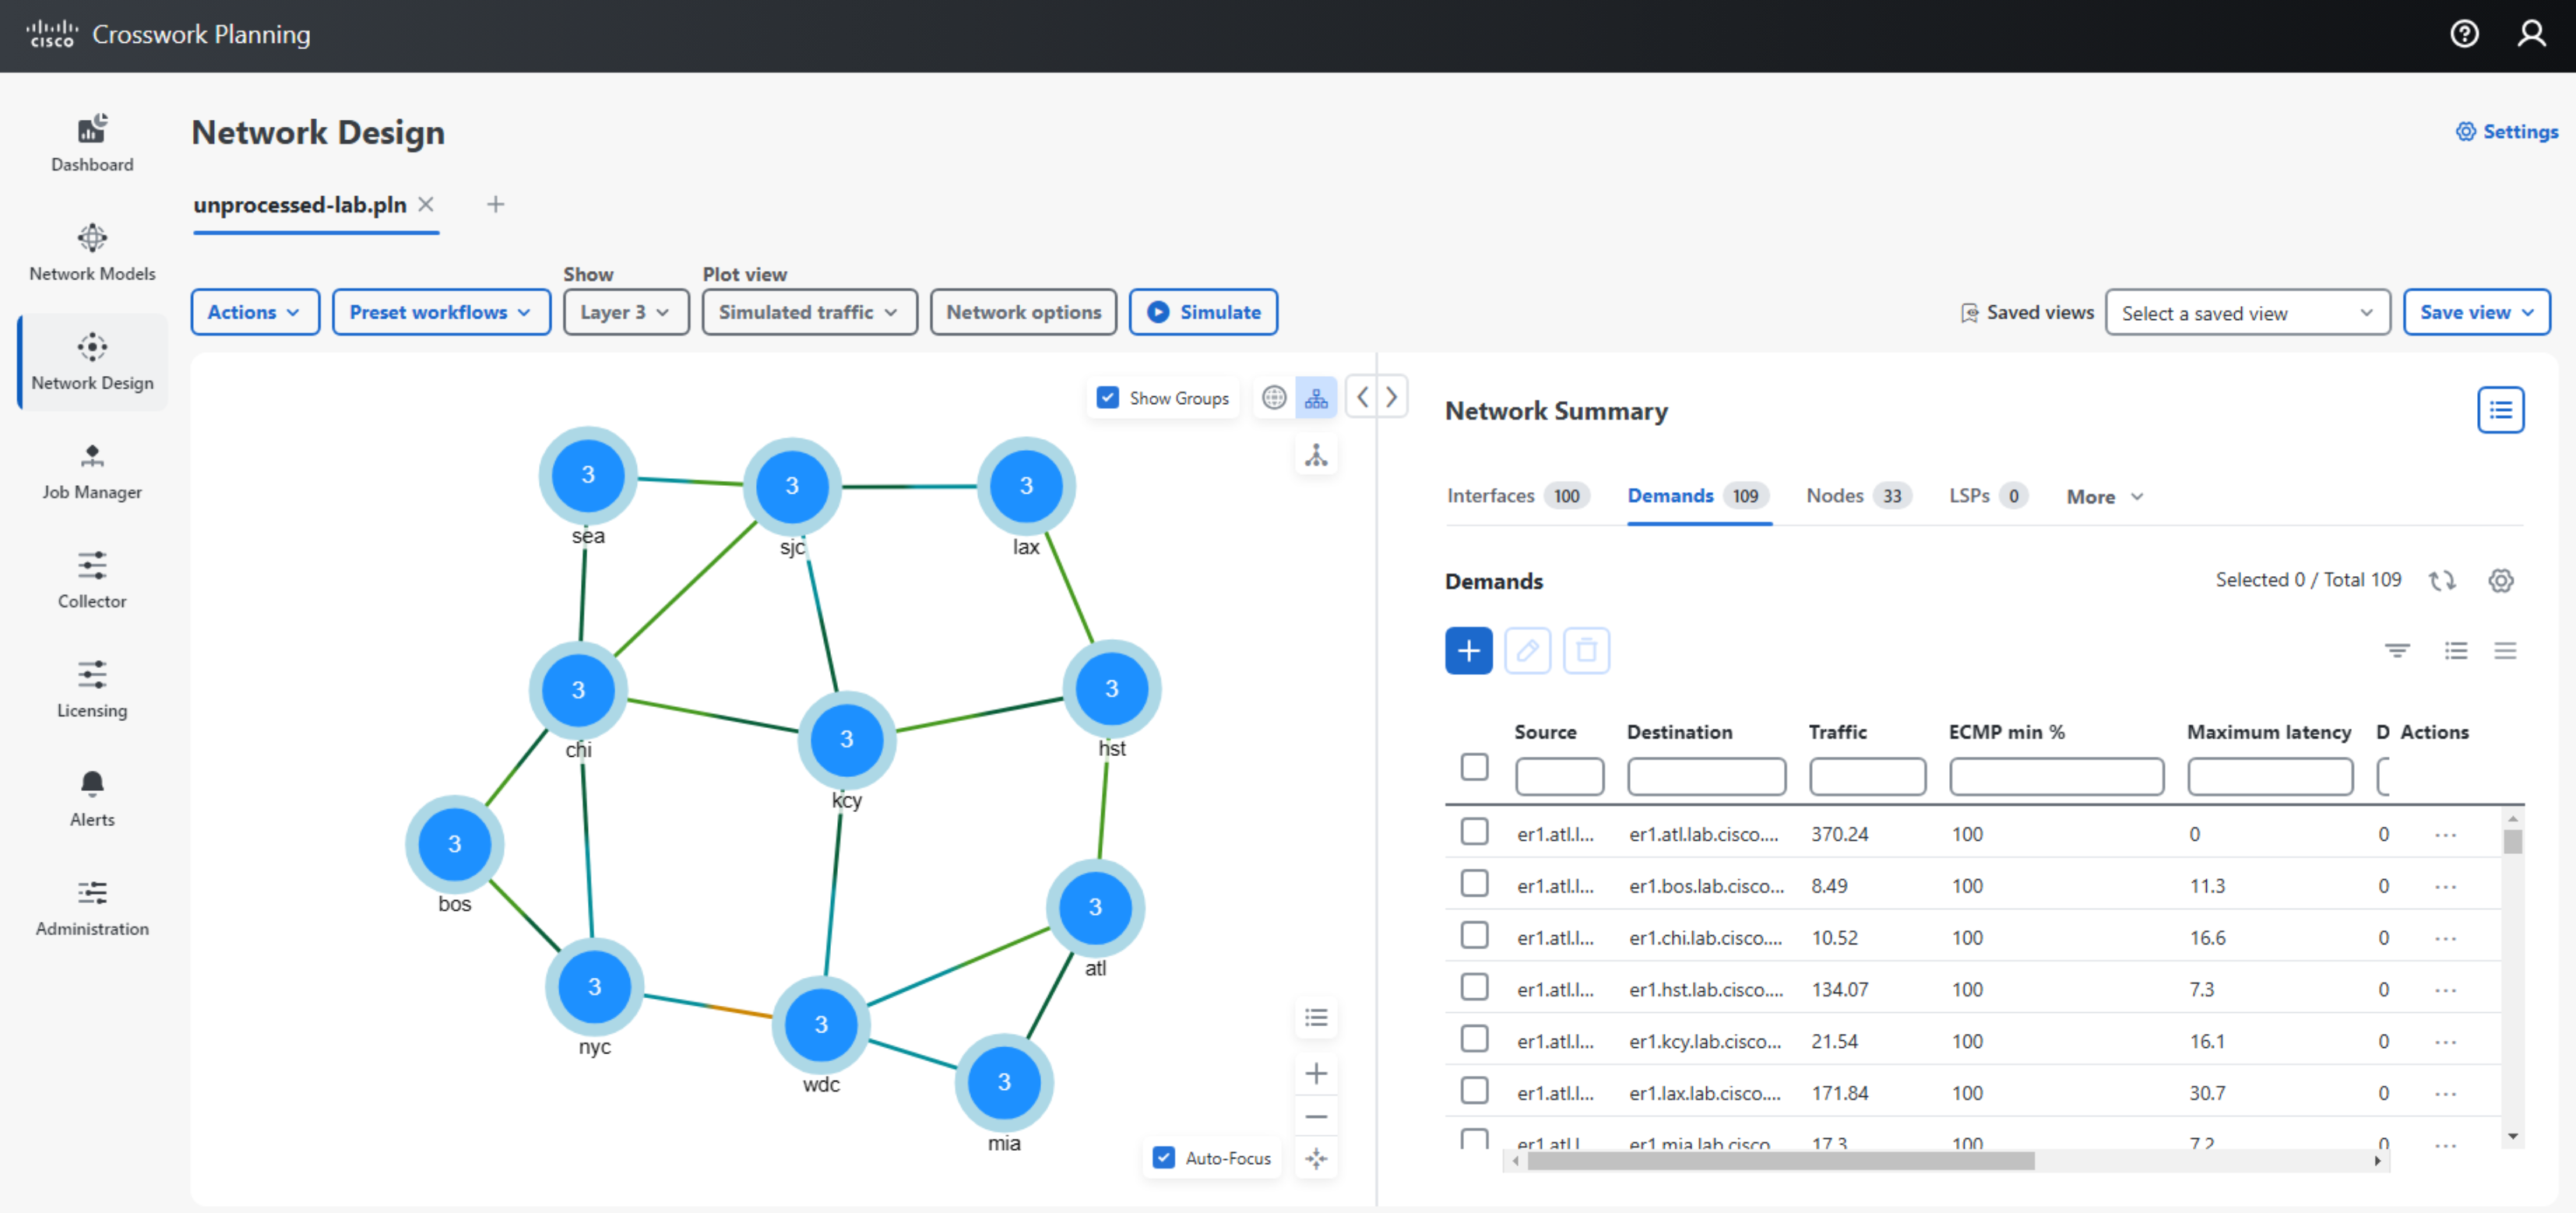
Now if you select the Simulated Traffic from the upper left drop down box you should see the links are colored according to their simulated utilization.
On the Demands and Interfaces tables, the following columns have been populated:
- Demands table: traffic column
- Interfaces table: simulated traffic (Traffic Sim) column
What Can You Do With a Network Simulation
The following tasks will take you through some of the things you can do with a network simulation.
If you have completed the previous steps, you can continue to use the same network model, or download the processed plan (processed-lab.pln) file.
[DANGER] All the steps below assume you are starting with this plan.
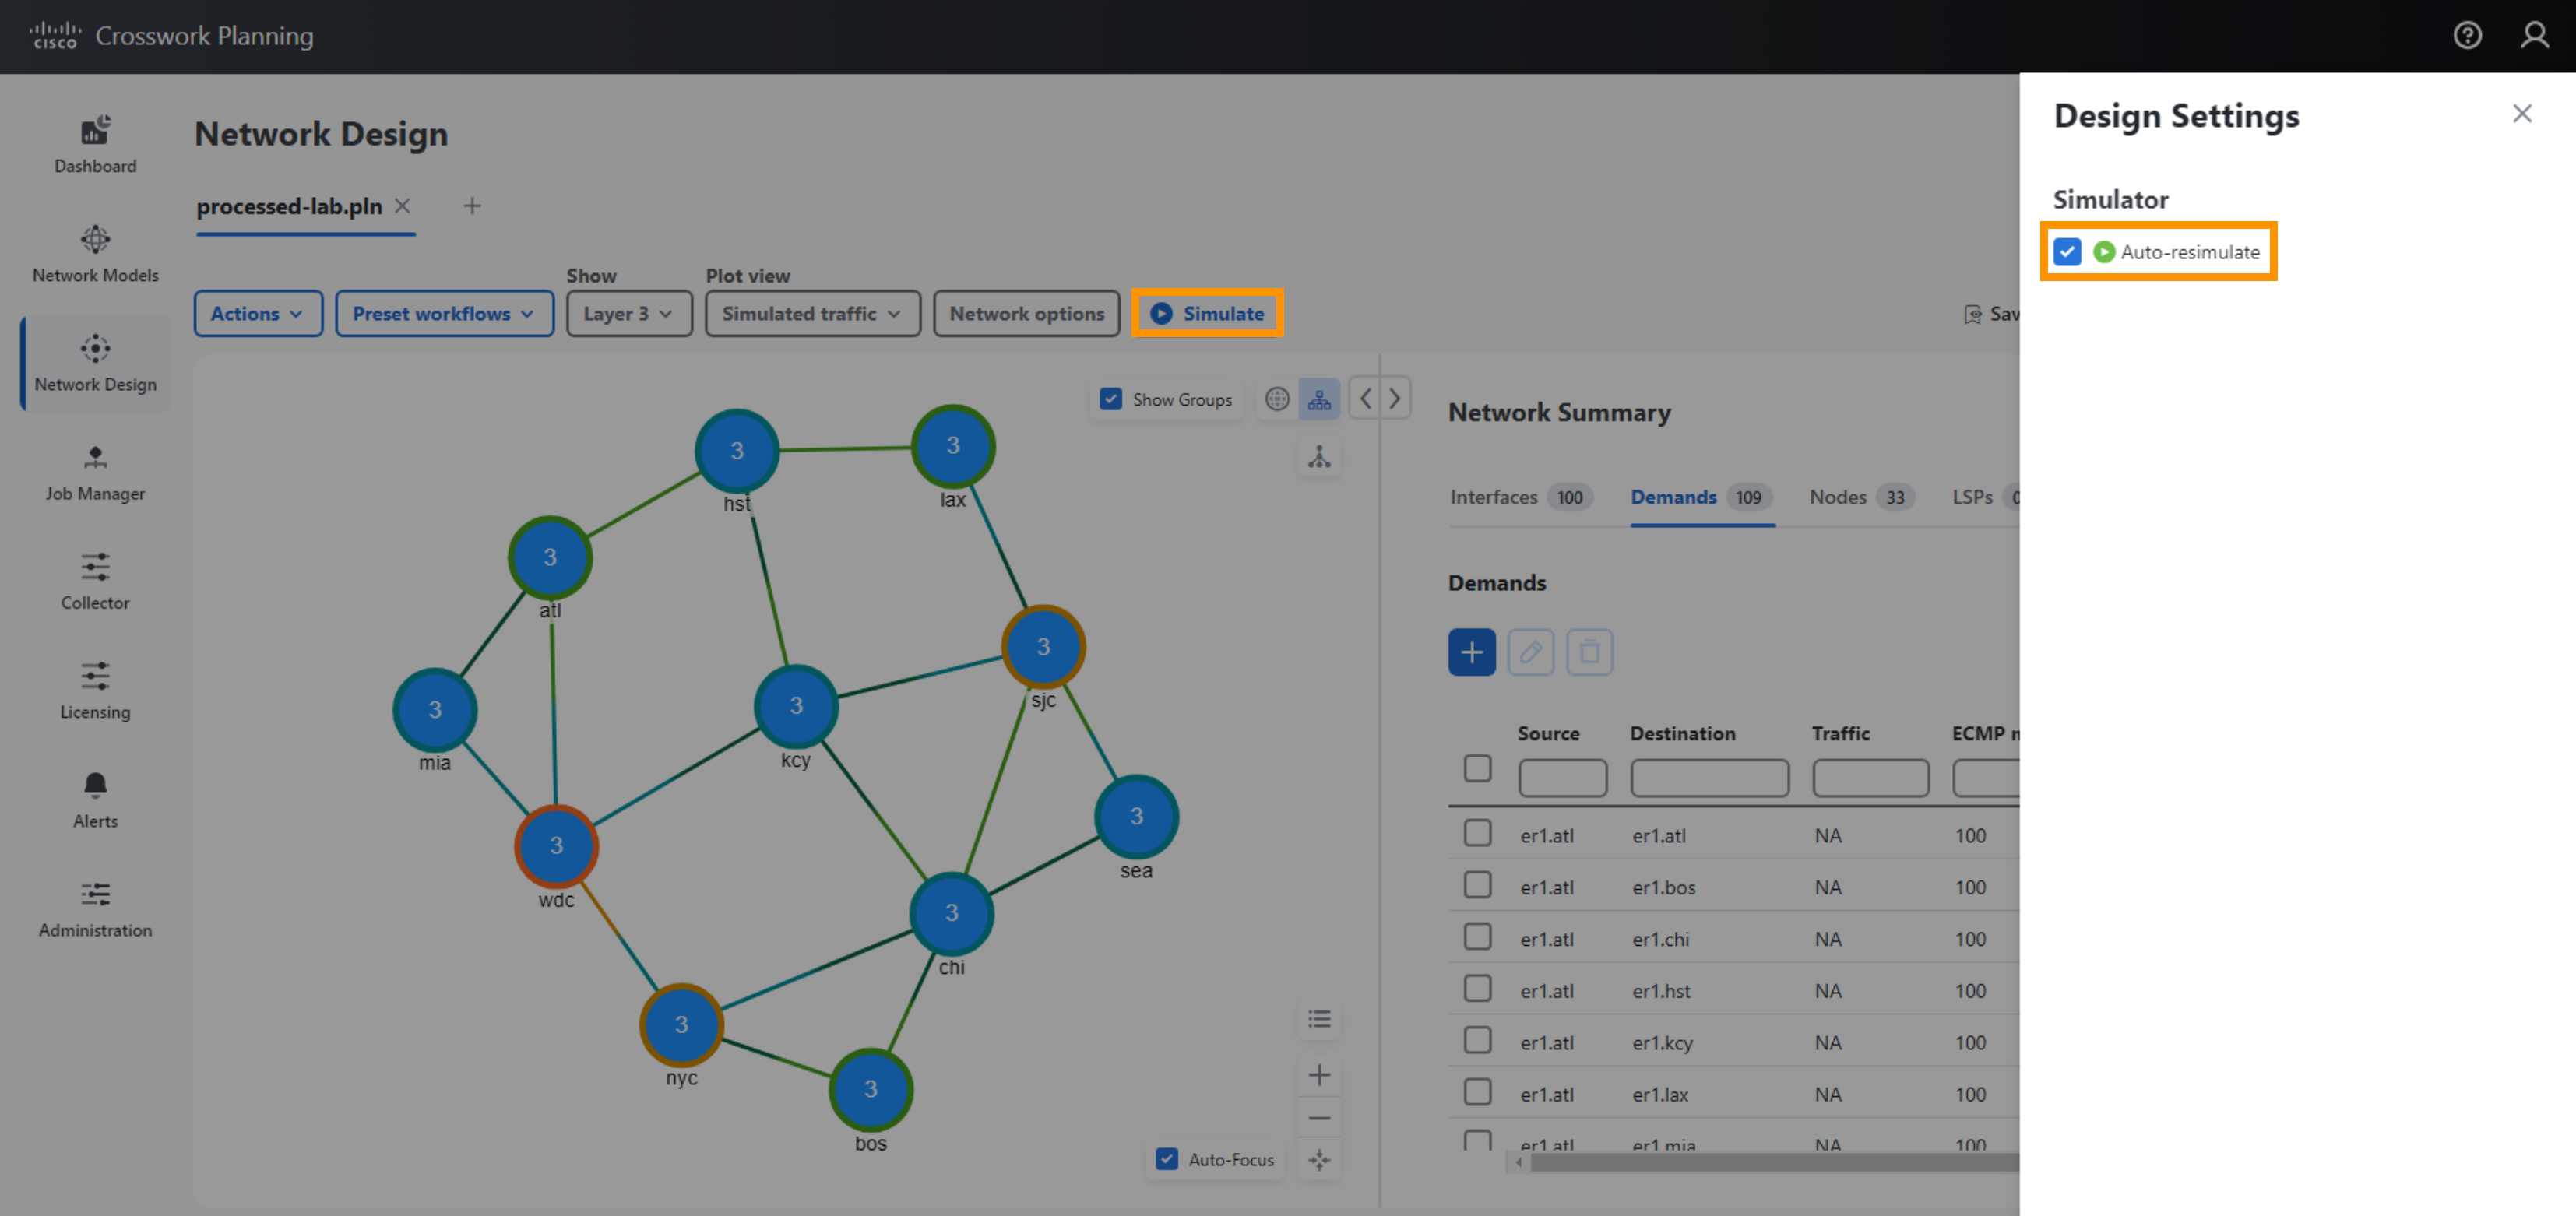
Note: Crosswork Planning by default has Auto-Simulate set to off. This means that after any changes, the user will need to select the Simulate button in order to run simulation. This provides the benefit of a more responsive interface with reduced resource consumption. If desired, you may toggle Auto-Simulate to on by selecting the settings icon on the top-right-hand corner of the Network Design screen and checking the Auto-resimulate checkbox.
What if Analysis
You can examine what happens if you change any aspect of the model.
Step 8 Examine a Few Scenarios
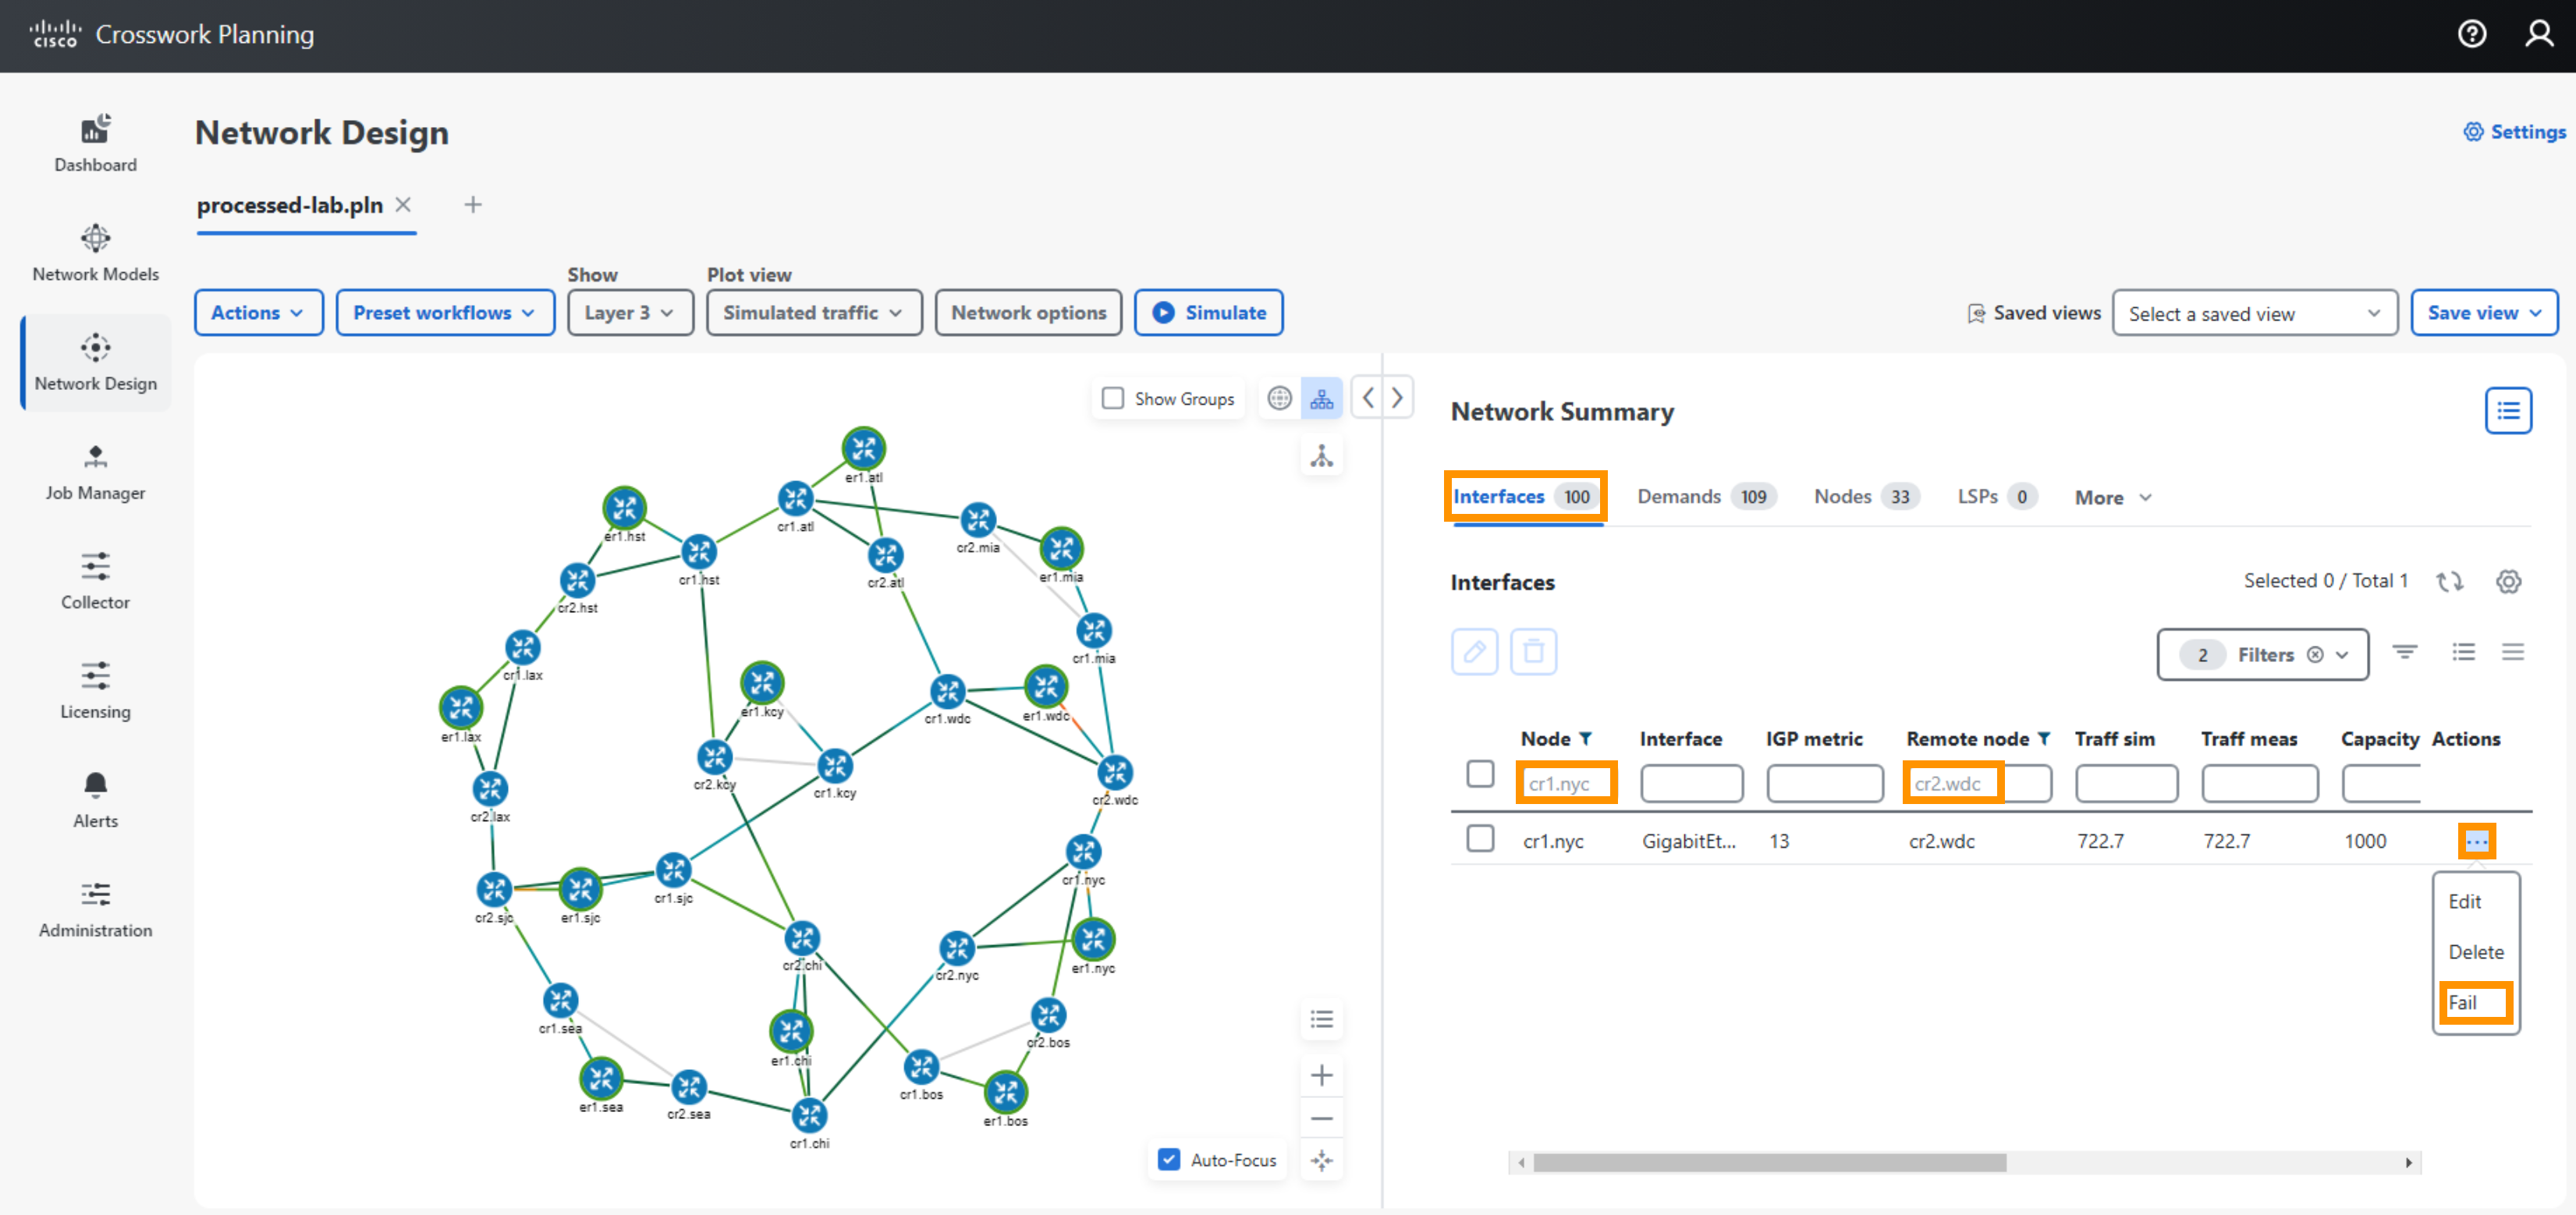
- What happens if a link fails?
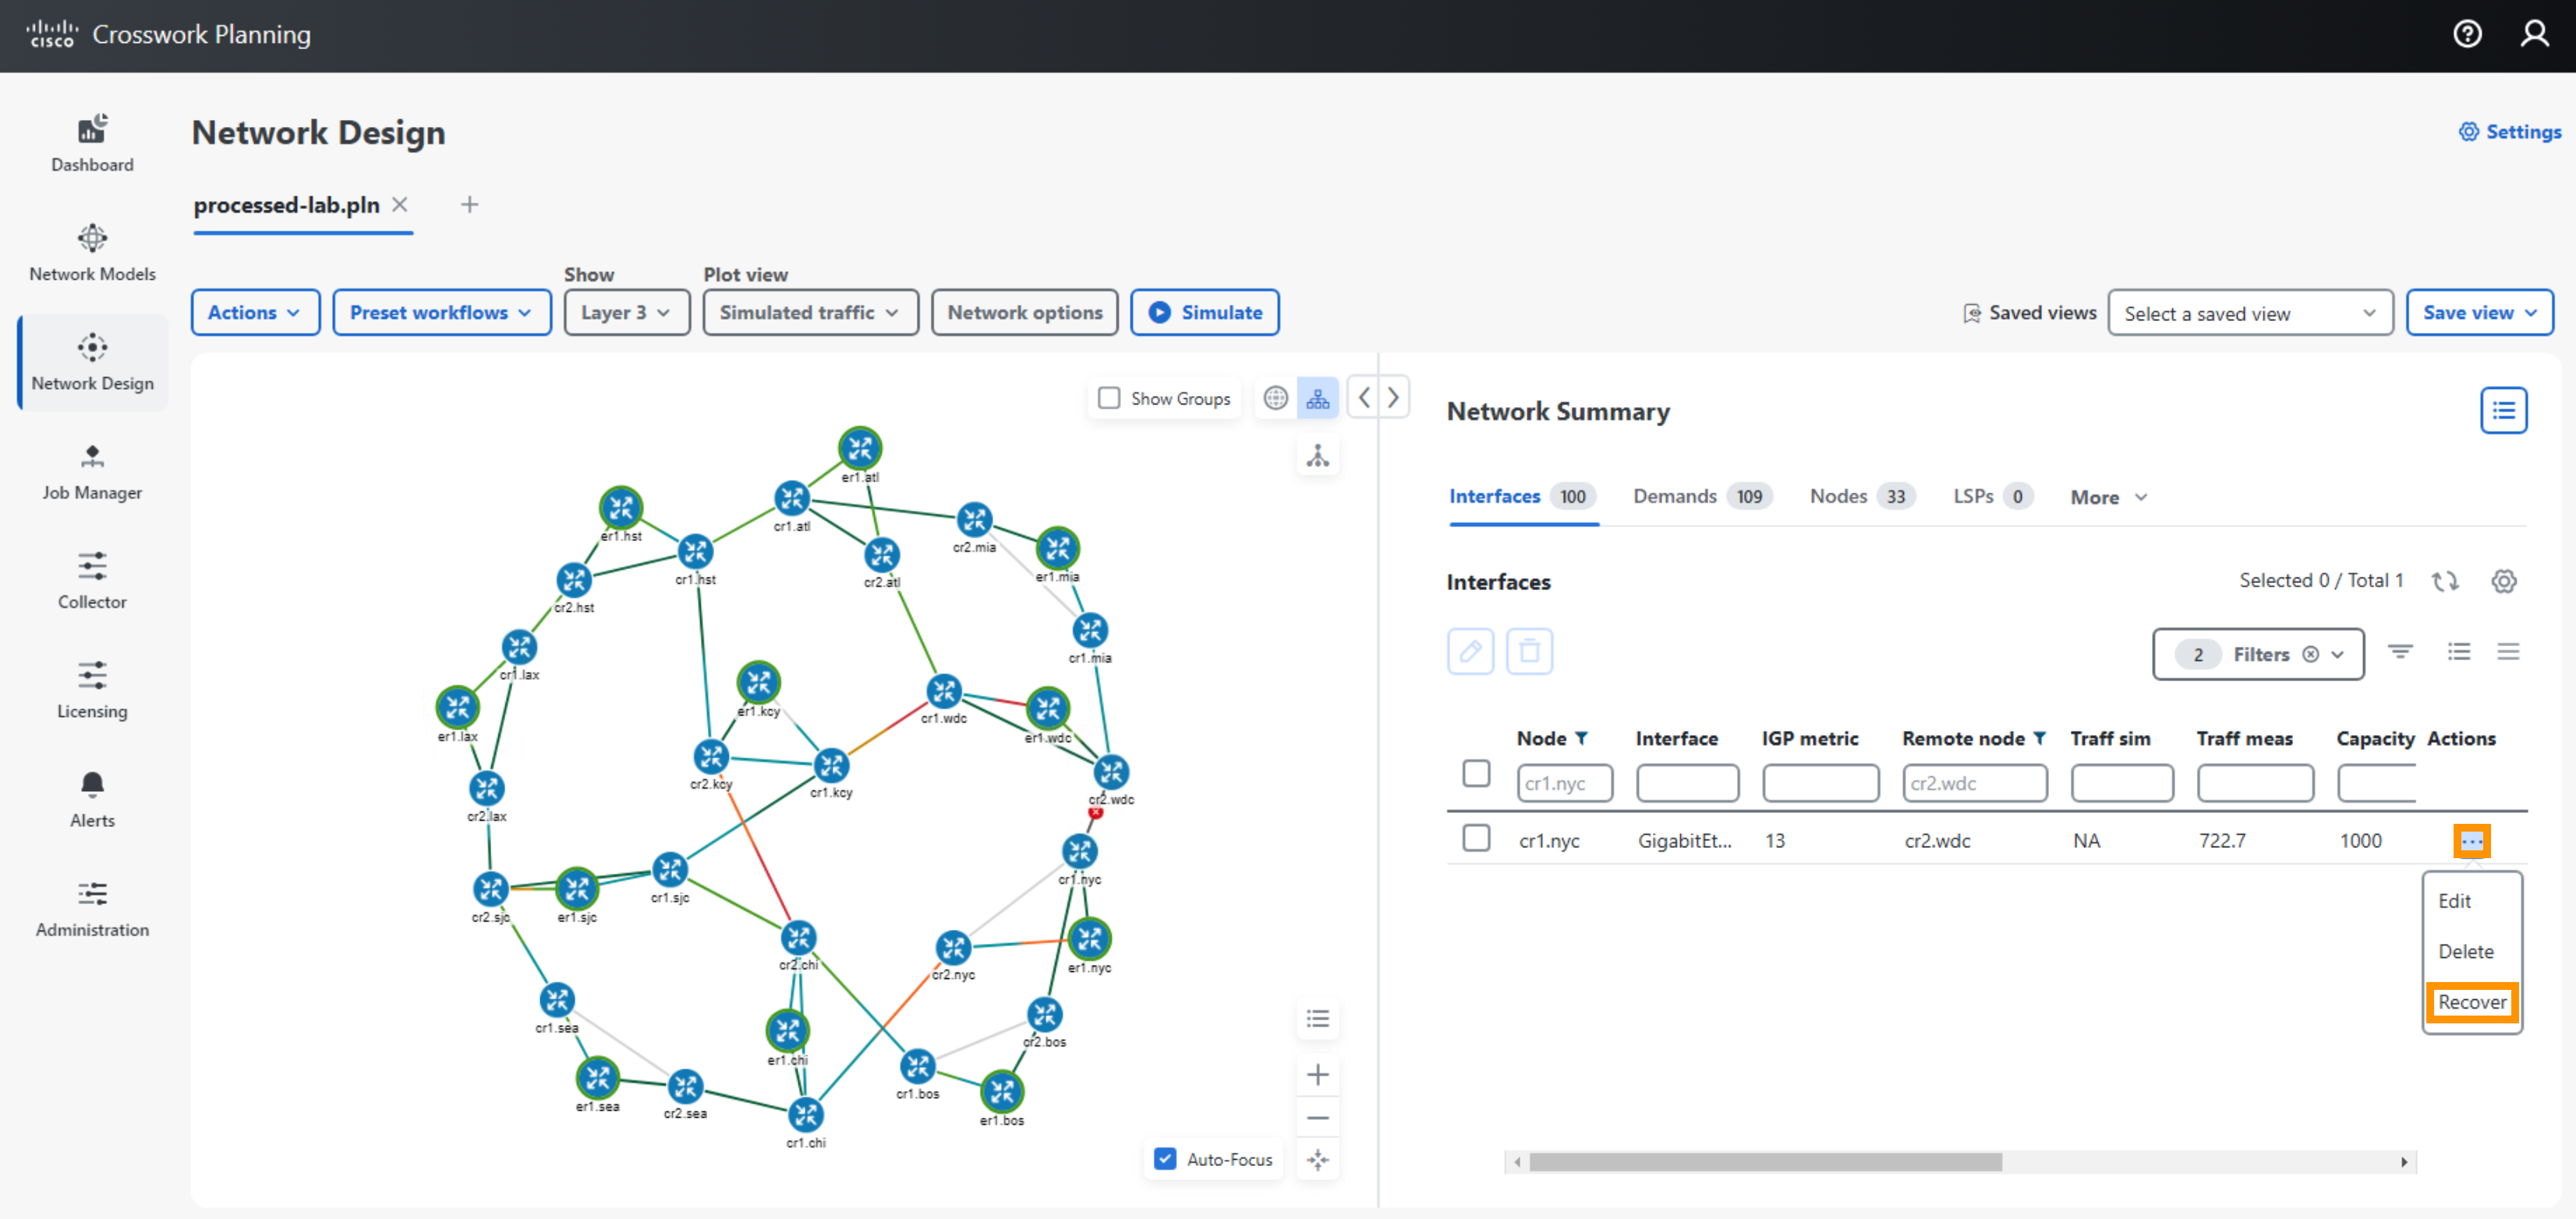
- On the Interfaces table, enter the filter for Node cr1.nyc and Remote Node cr2.wdc. Select the ellipsis icon and select Fail to fail this link.
- Notice that the links between cr2.chi and cr2.kcy, and from cr2.nyc to cr1.chi (along with other links) has high utilization as a result of the single link failure.
- When done, Recover the link by selecting the ellipsis icon and select Recover.
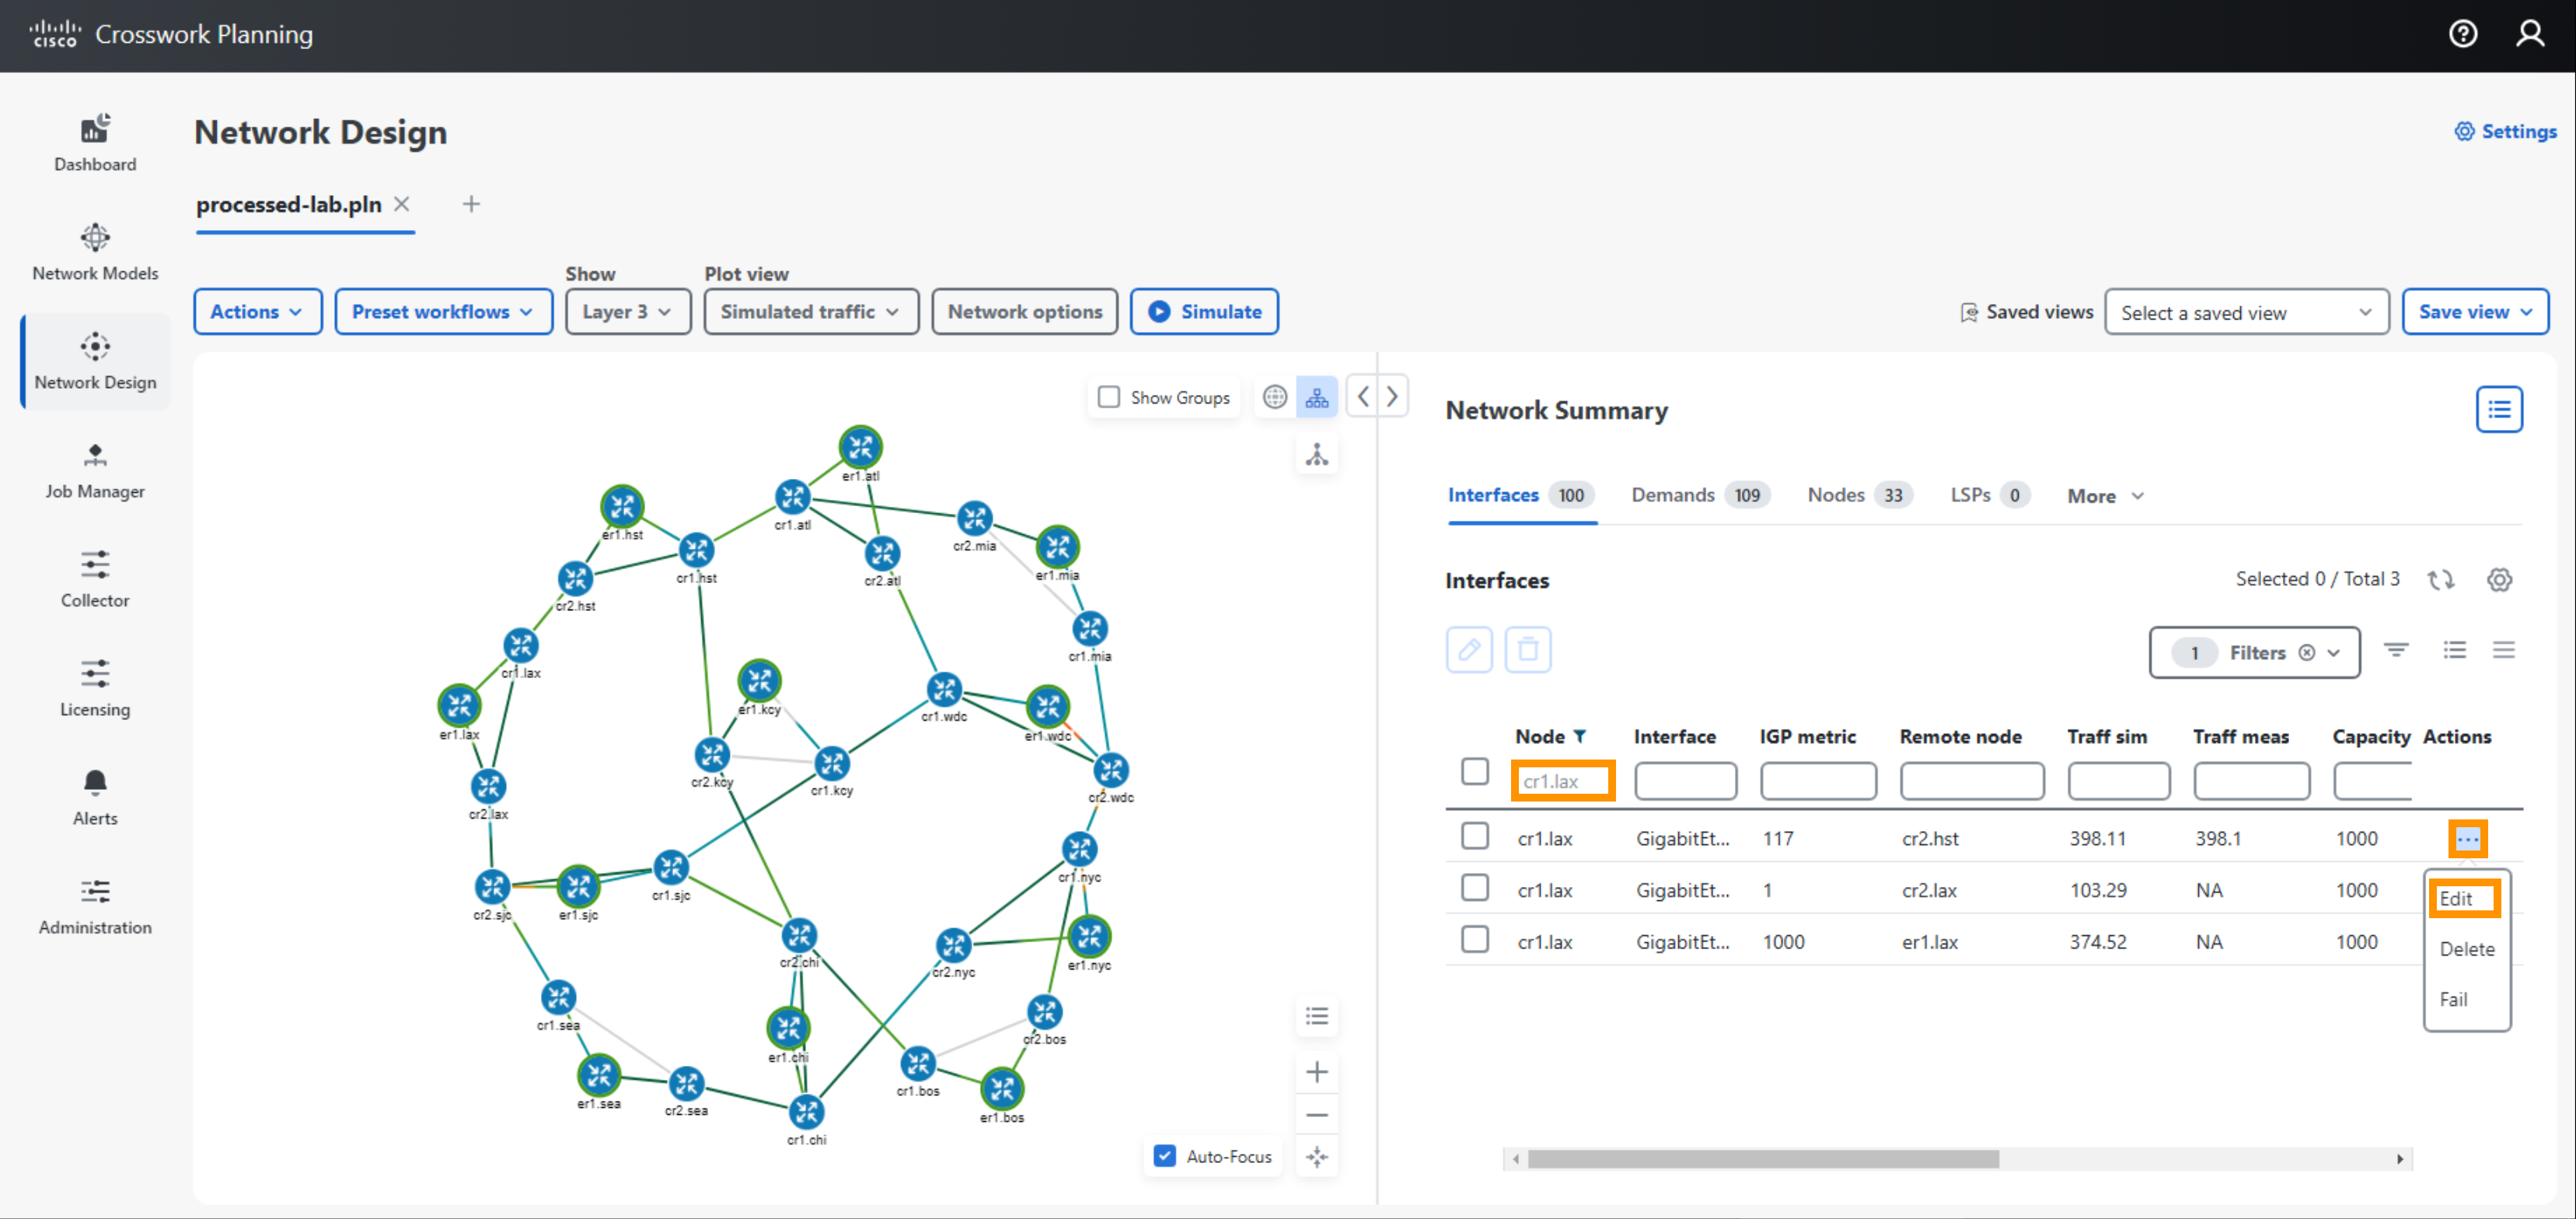
- What happens if you change a metric?
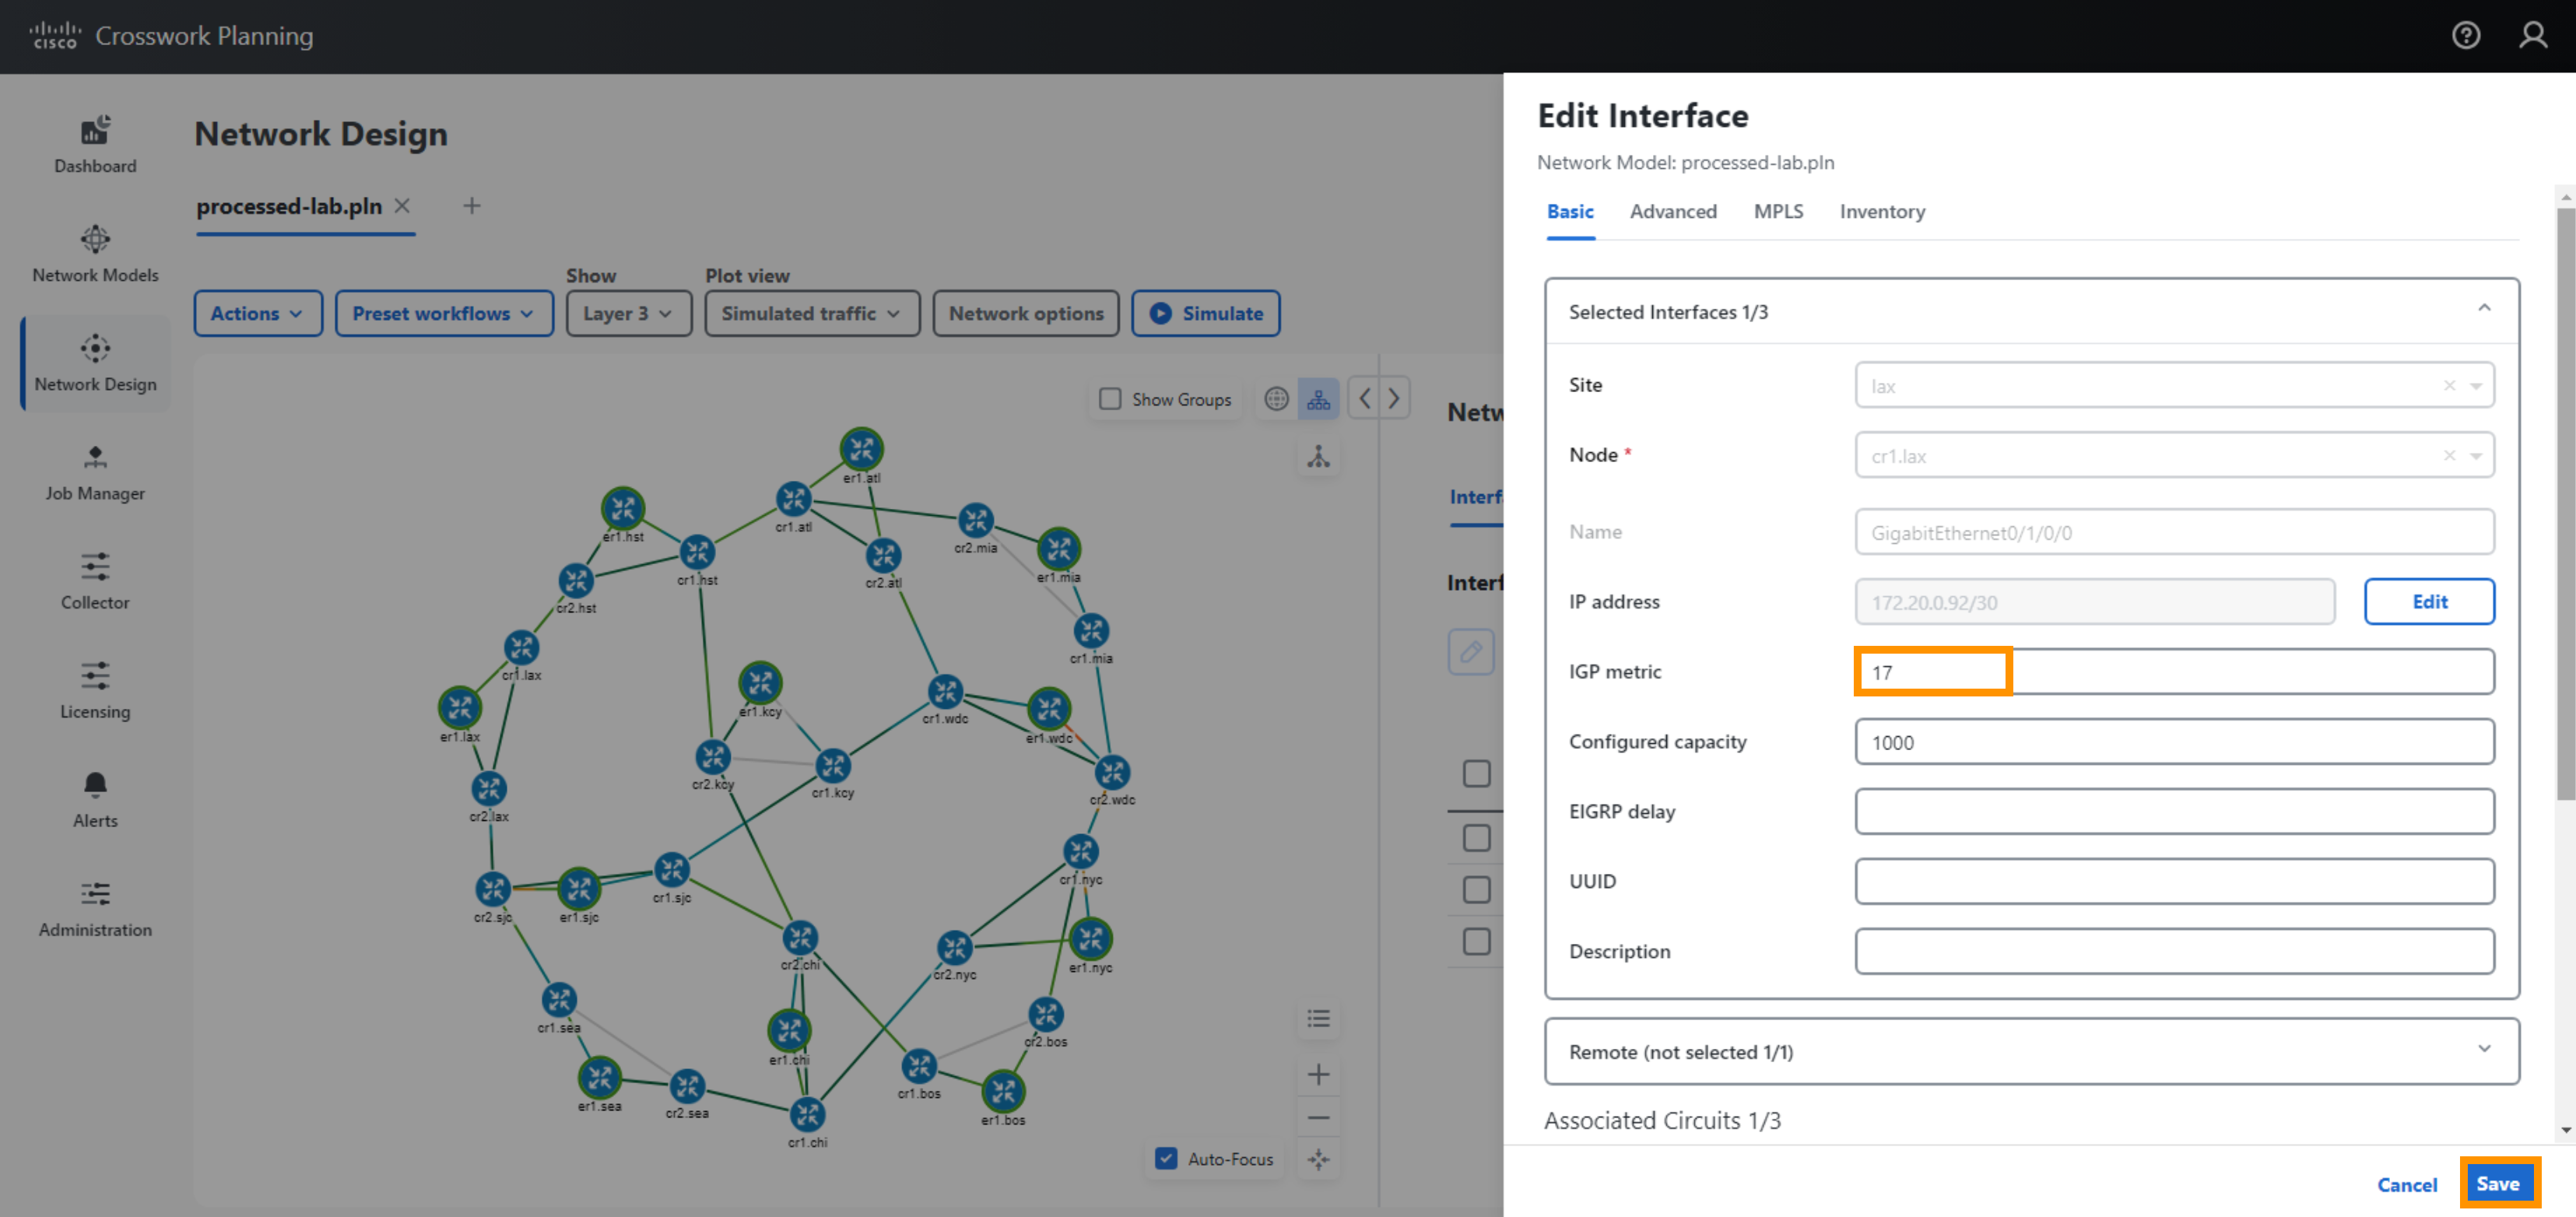
- On the Interfaces table, enter the filter for cr1.lax. Select the ellipsis icon for the row for Remote Node cr2.hst. Select Edit.
- Change the Metric to 17, Select Save.
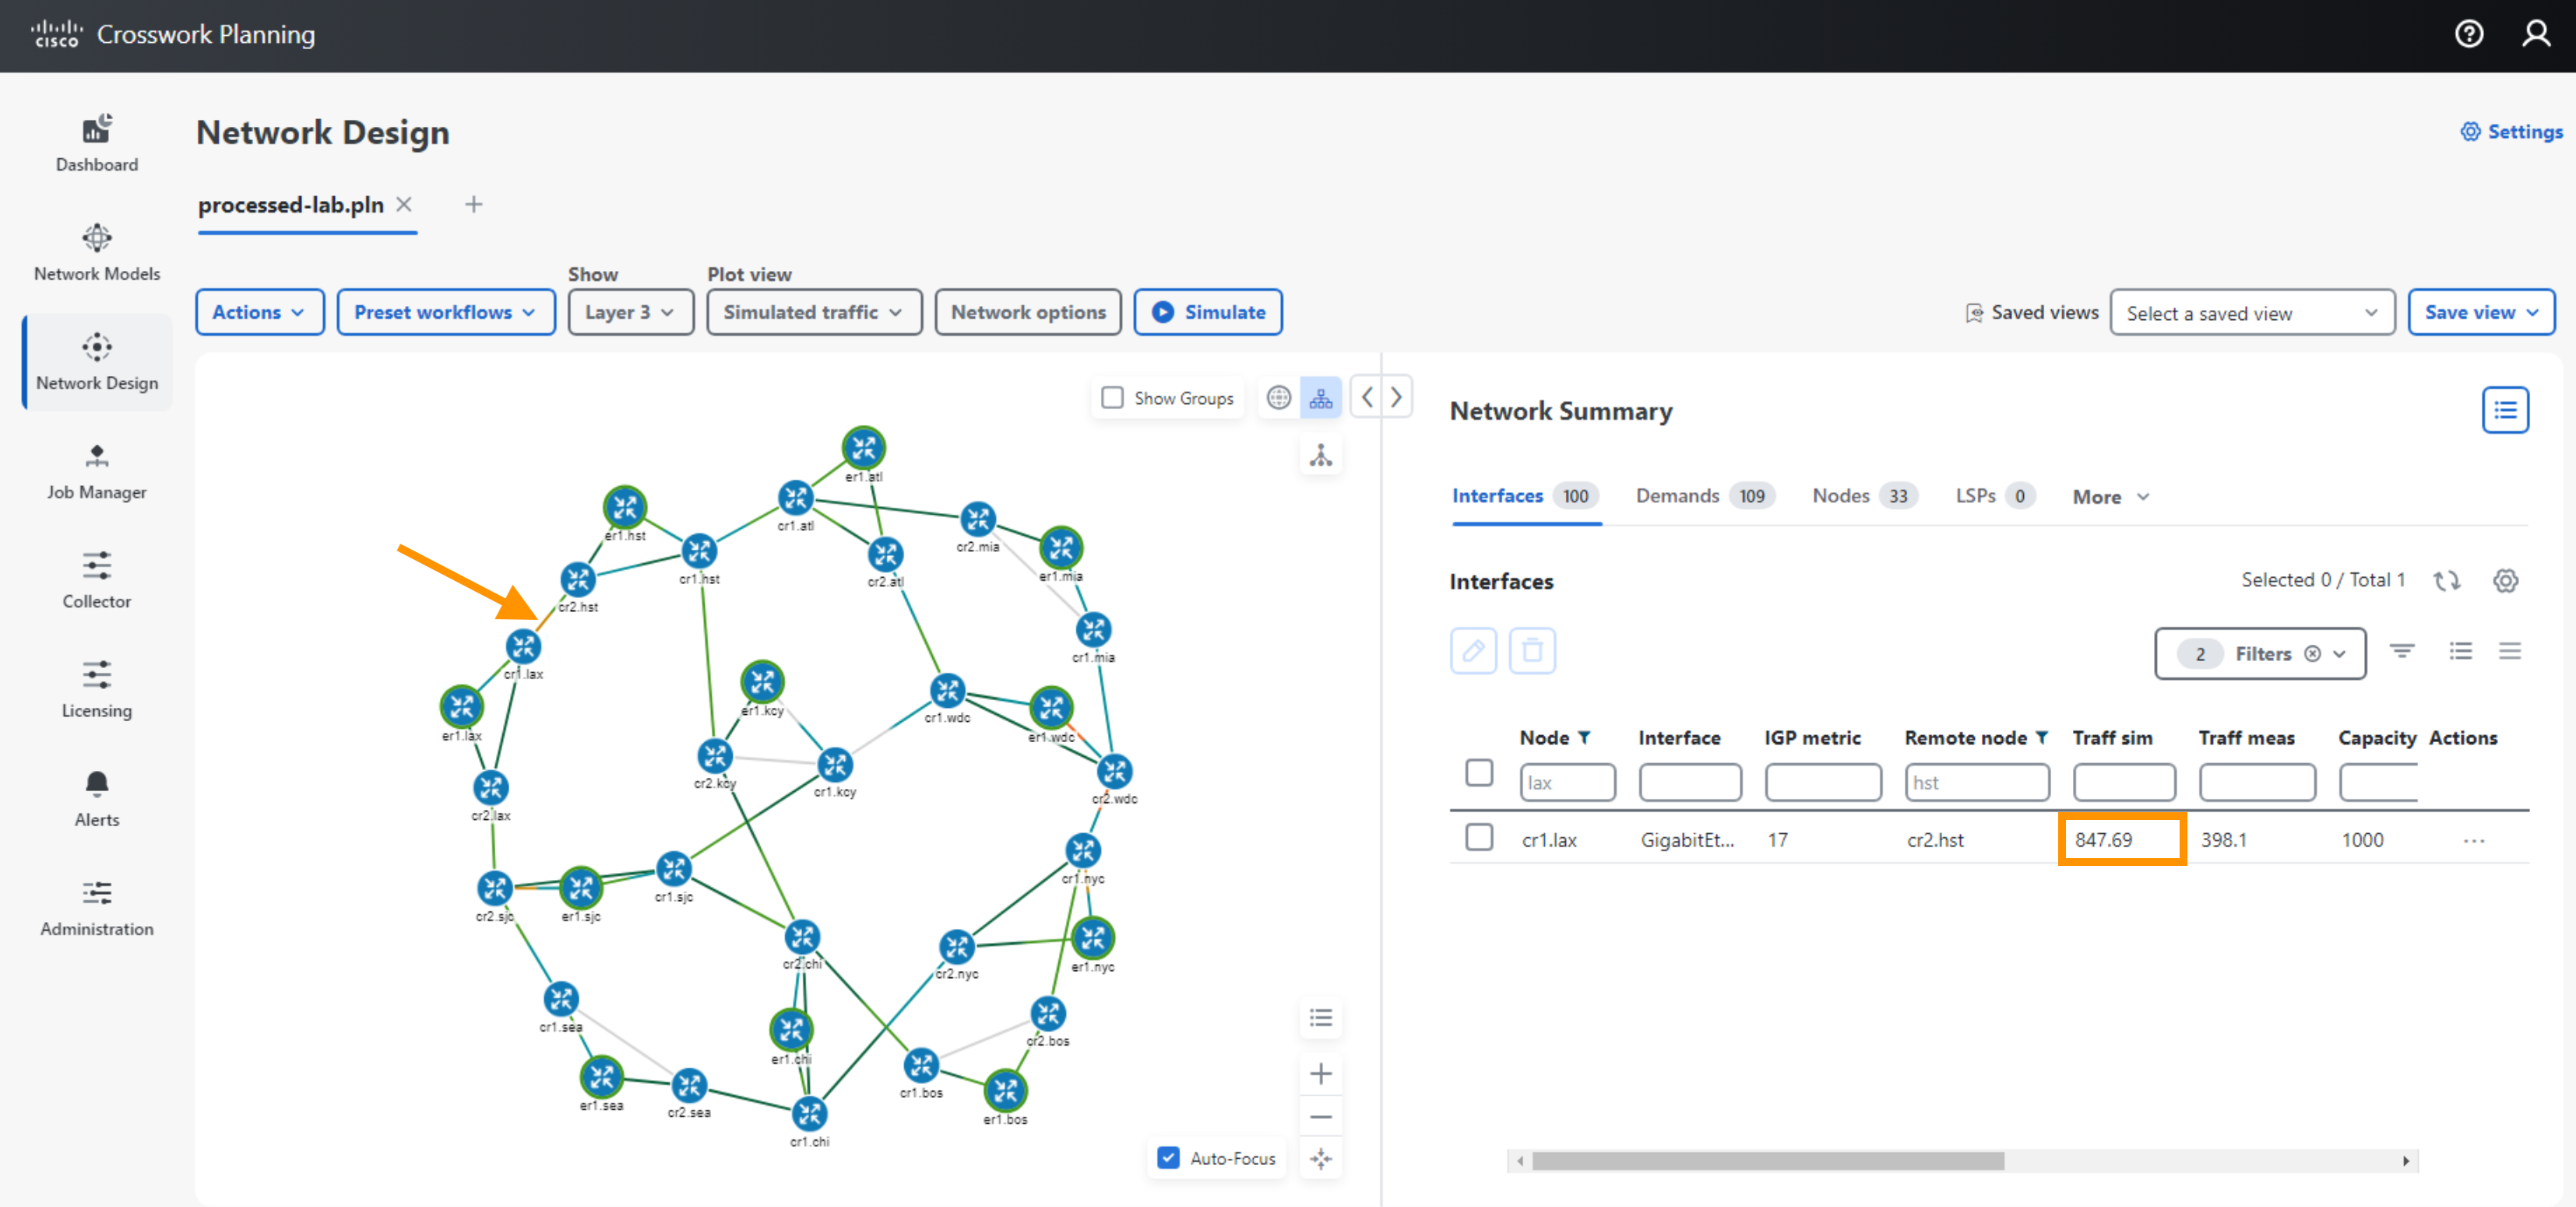
- Notice that the Traffic Sim has increased from 398 to 847 Mbps.
- What happens if you change the topology?
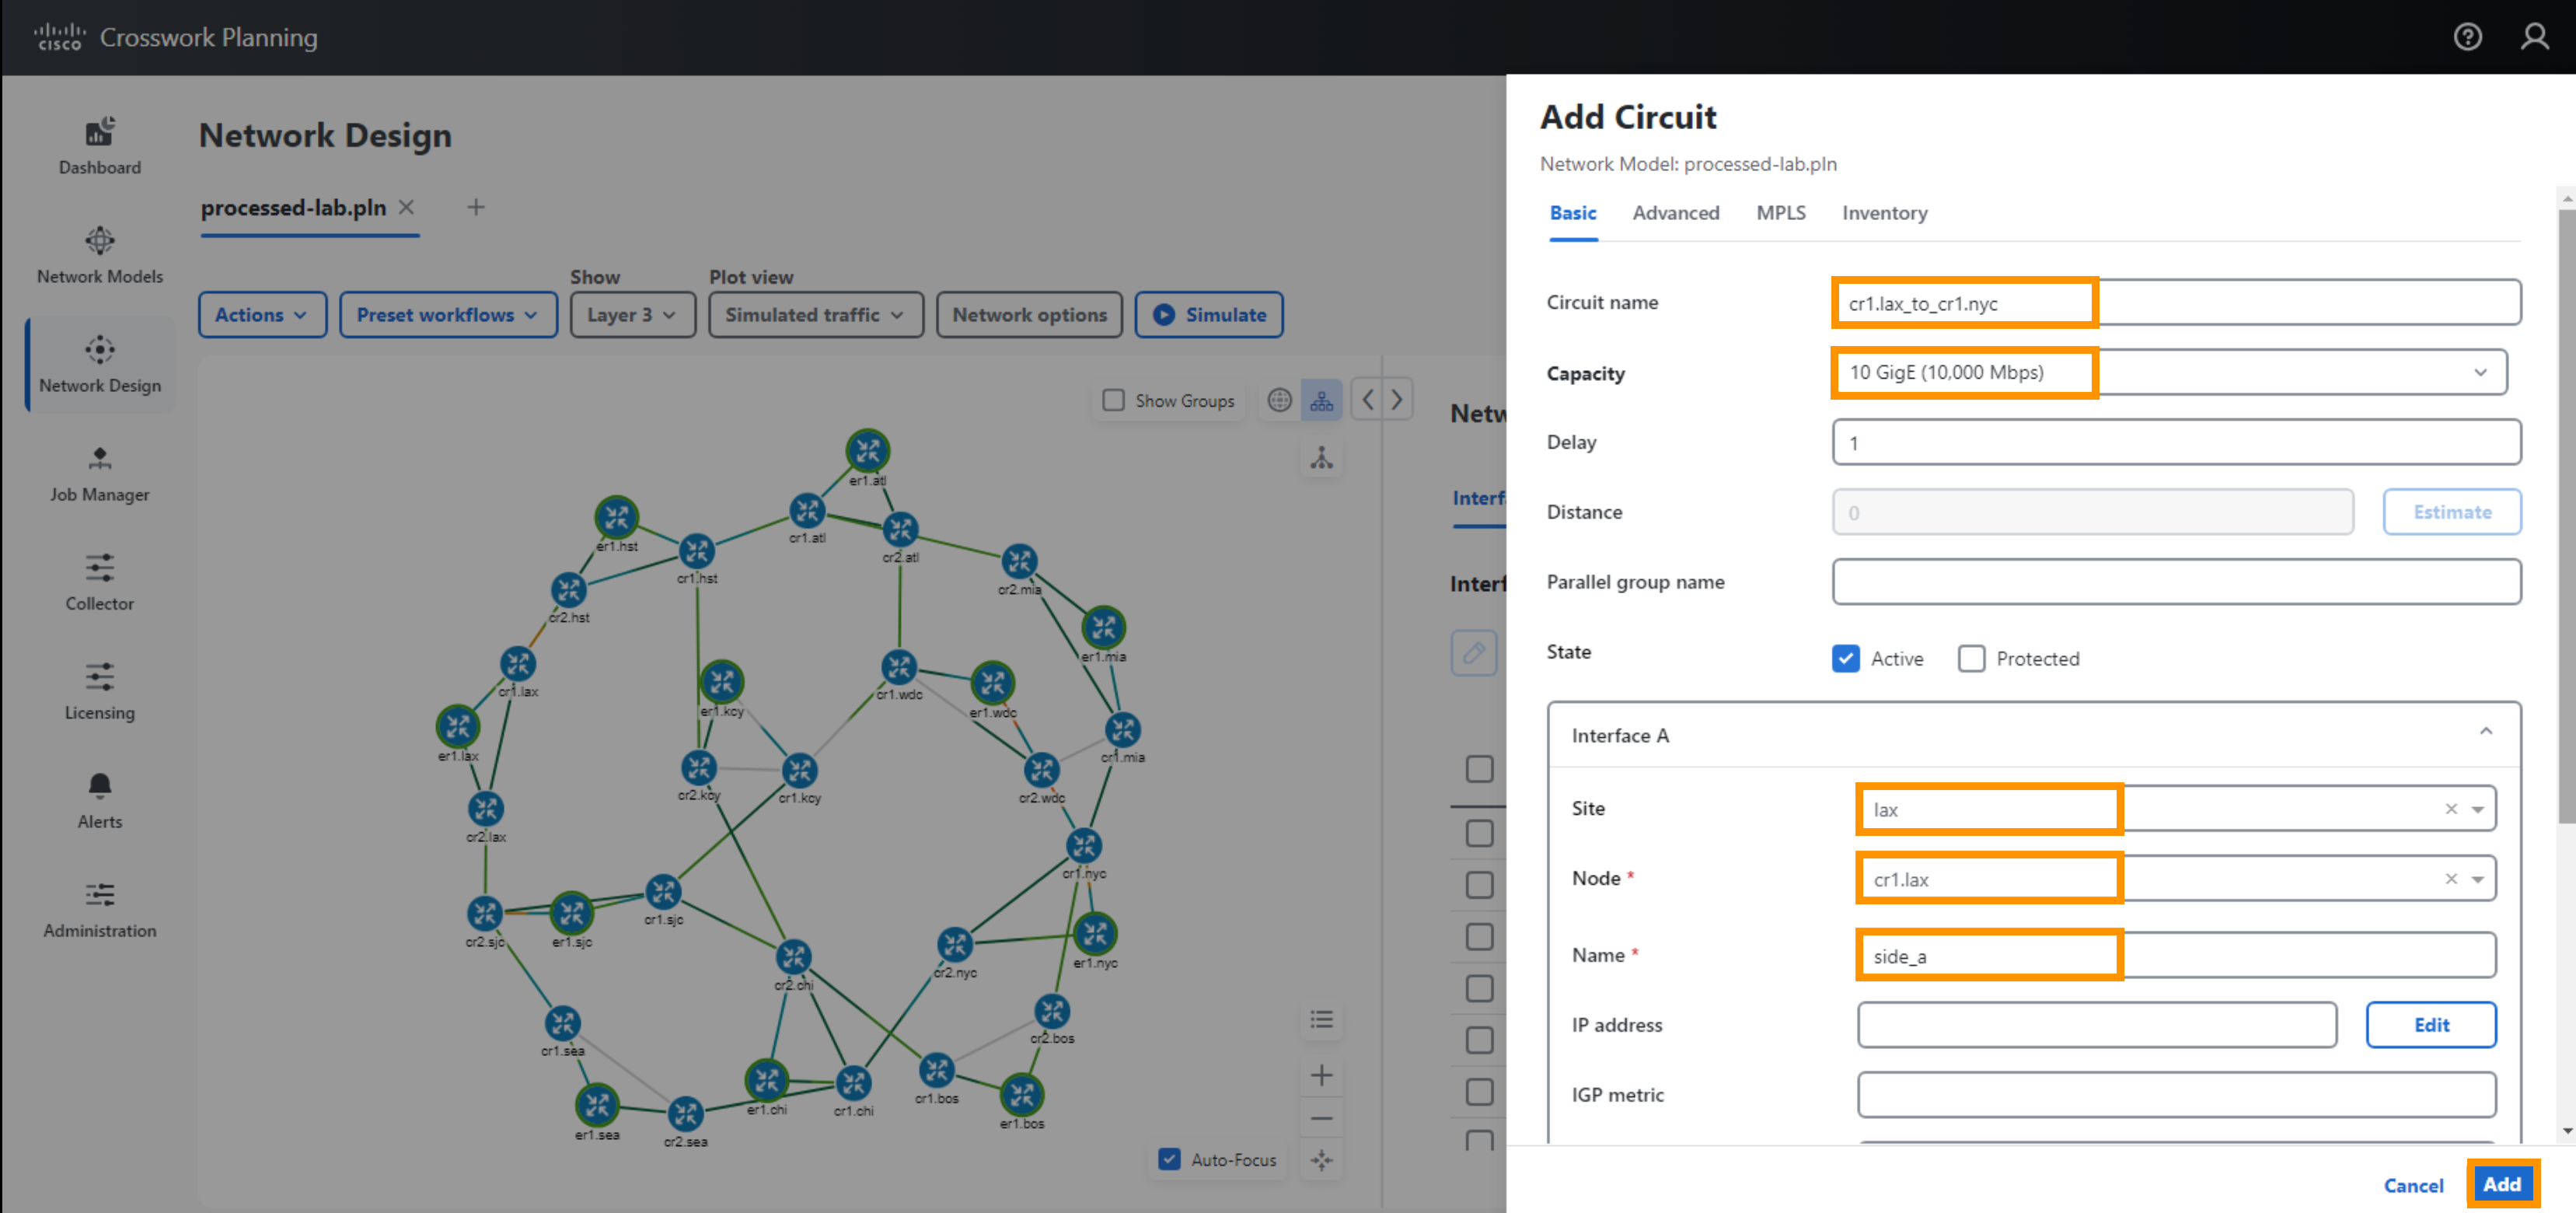
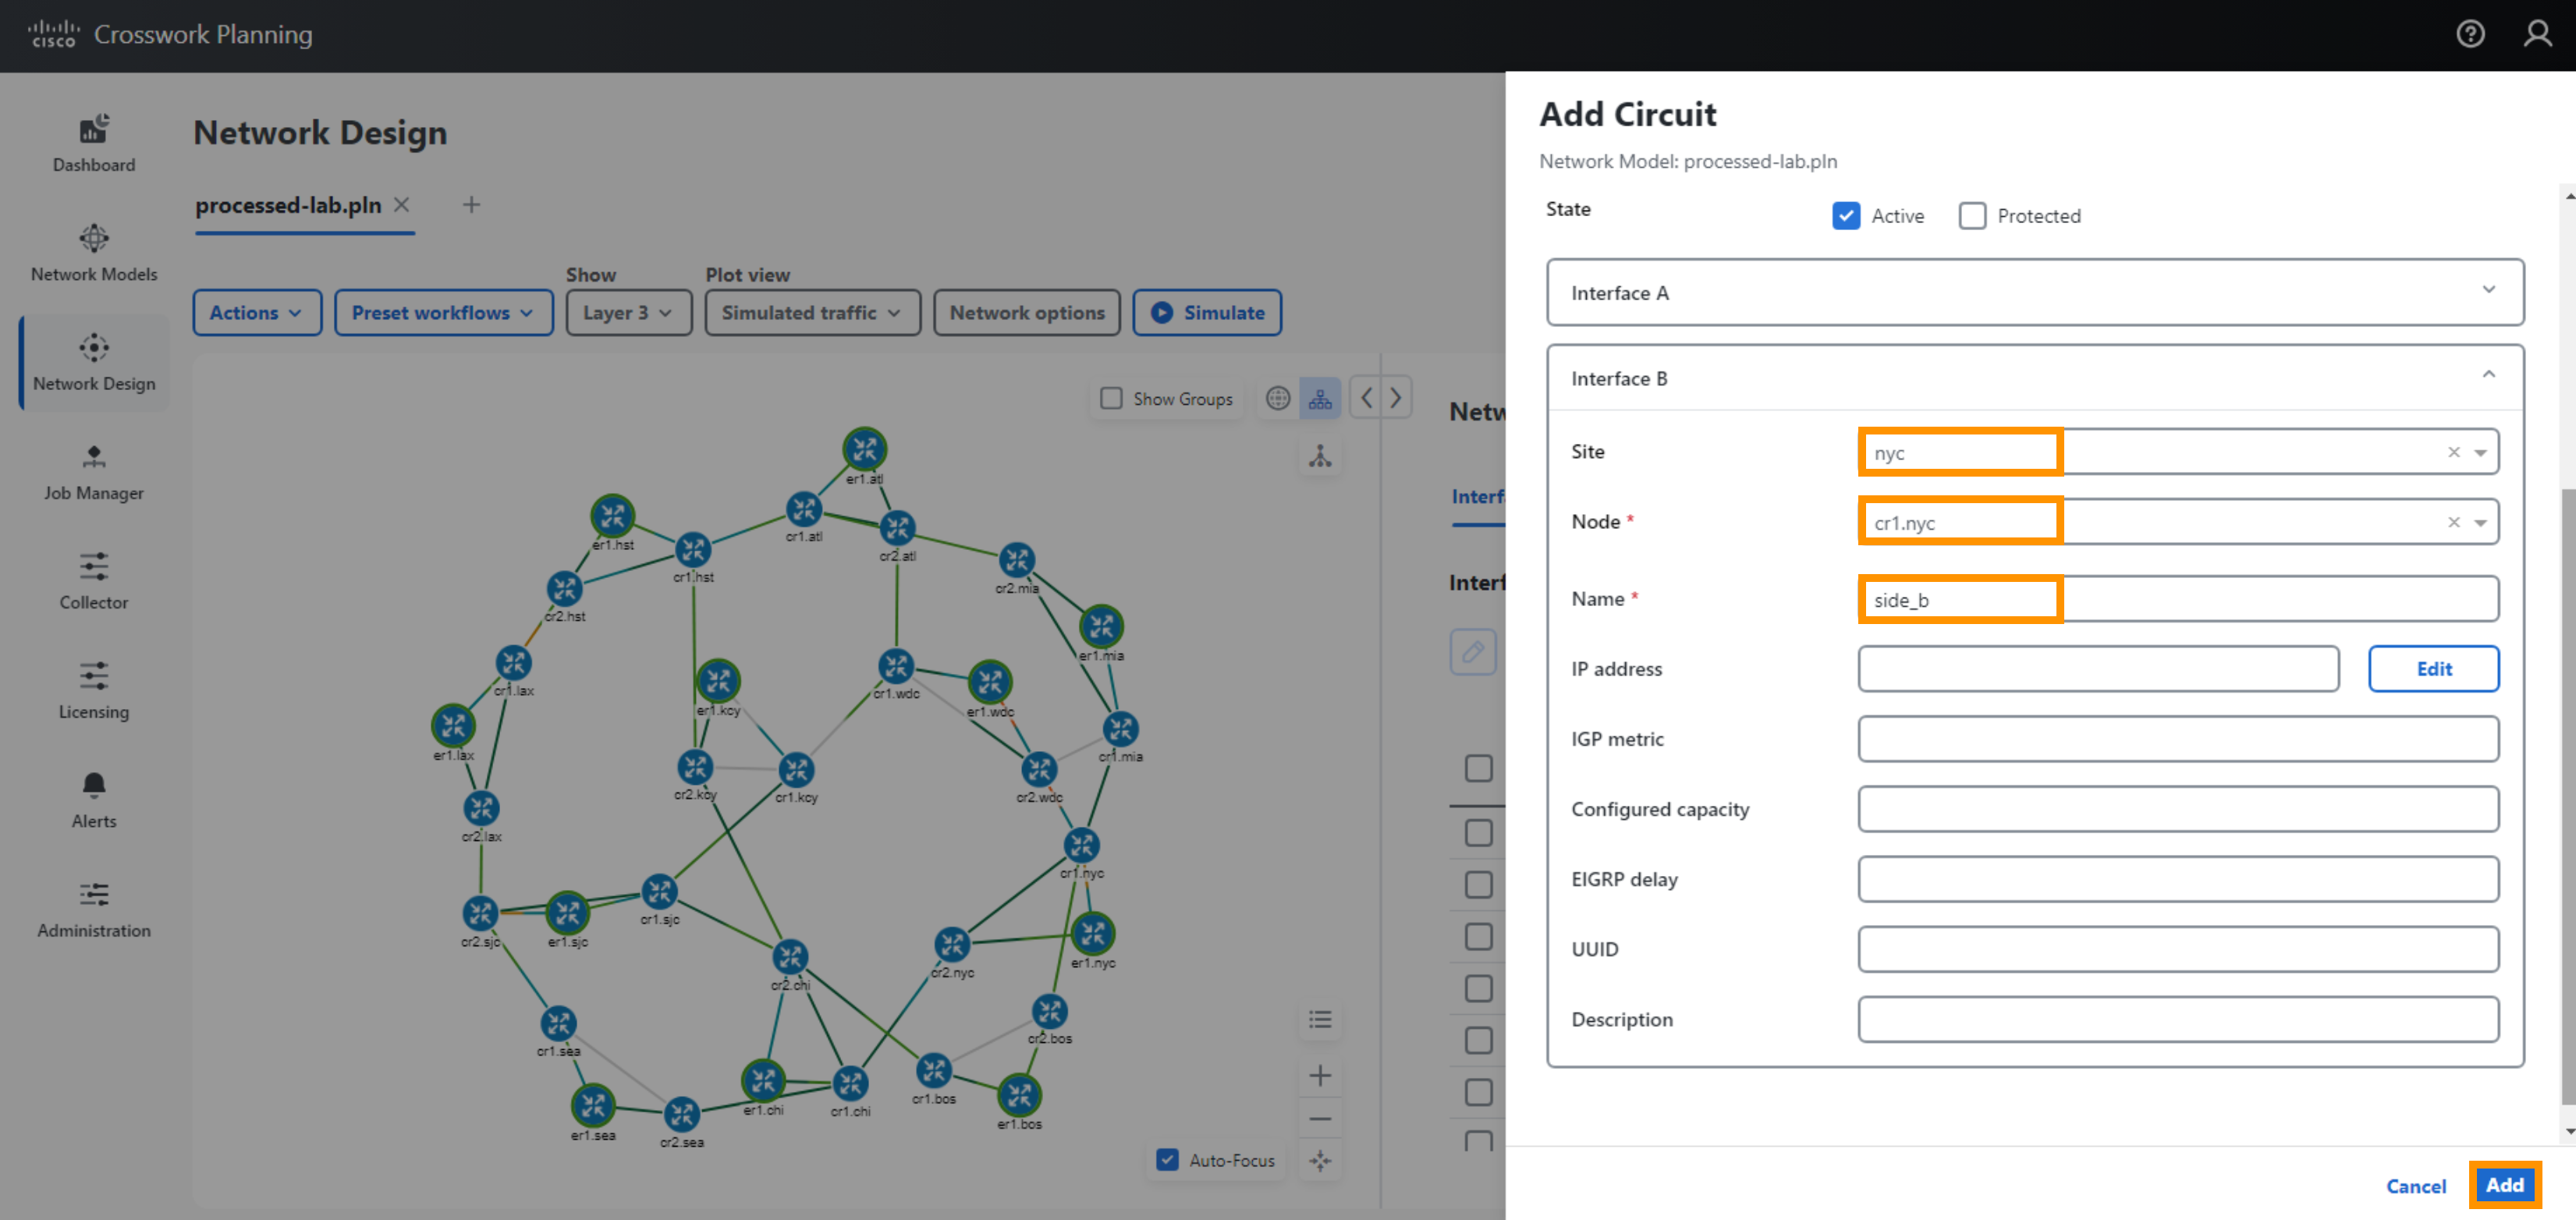
- Insert a new interface from cr1.lax to cr1.nyc, using default for all values.
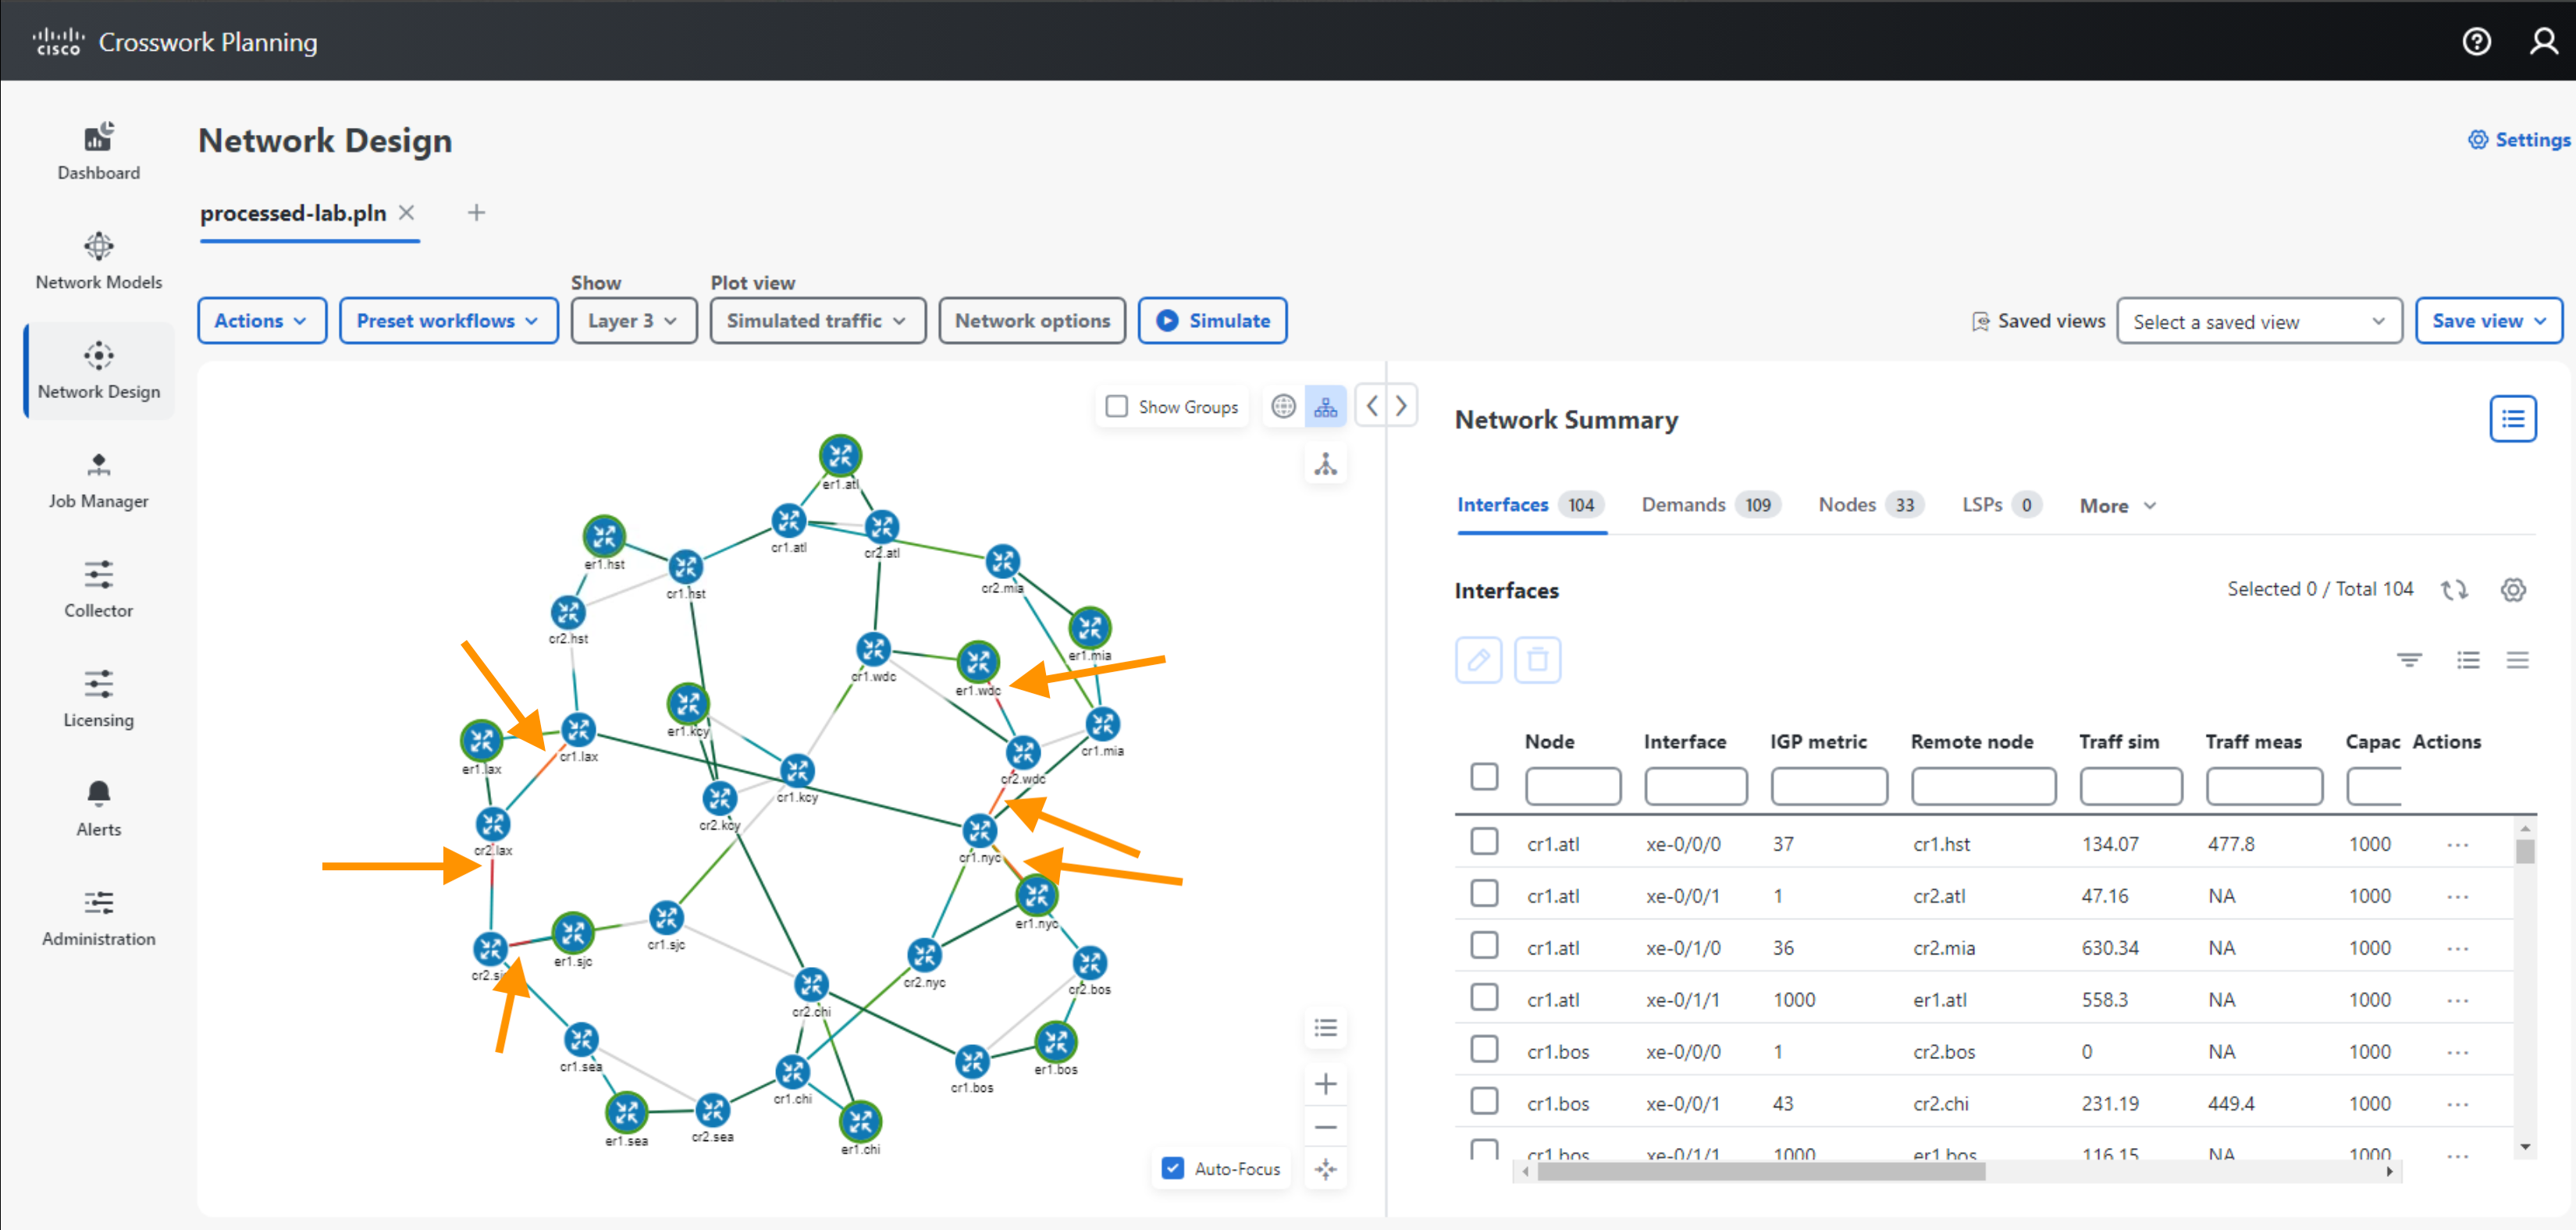
- Watch what happens to the traffic from other links as this link gets added.
- This example shows that we can introduce congestions on other links if we add circuits without due consideration.
- This is where tools such as Crosswork Planning would be useful.
In the previous steps you have seen some of the simple cases you can examine with the simulation. Now lets look at some use cases.
Bandwidth on Demand and Traffic Engineering
[INFO] Make sure you have reversed any changes made in the previous step. Crosswork Planning Design does not have an “undo” function so you need to undo any changes manually. You can always re-download and open up a copy of the model using the button below the heading “What Can You Do With a Network Simulation”.
Before adding traffic to your network, you would like to know the impact the traffic would have. If there is congestion are there topology changes or optimizations that can be done to support the traffic?
Step 9 Bandwidth on Demand and Traffic Engineering
- Add a Demand
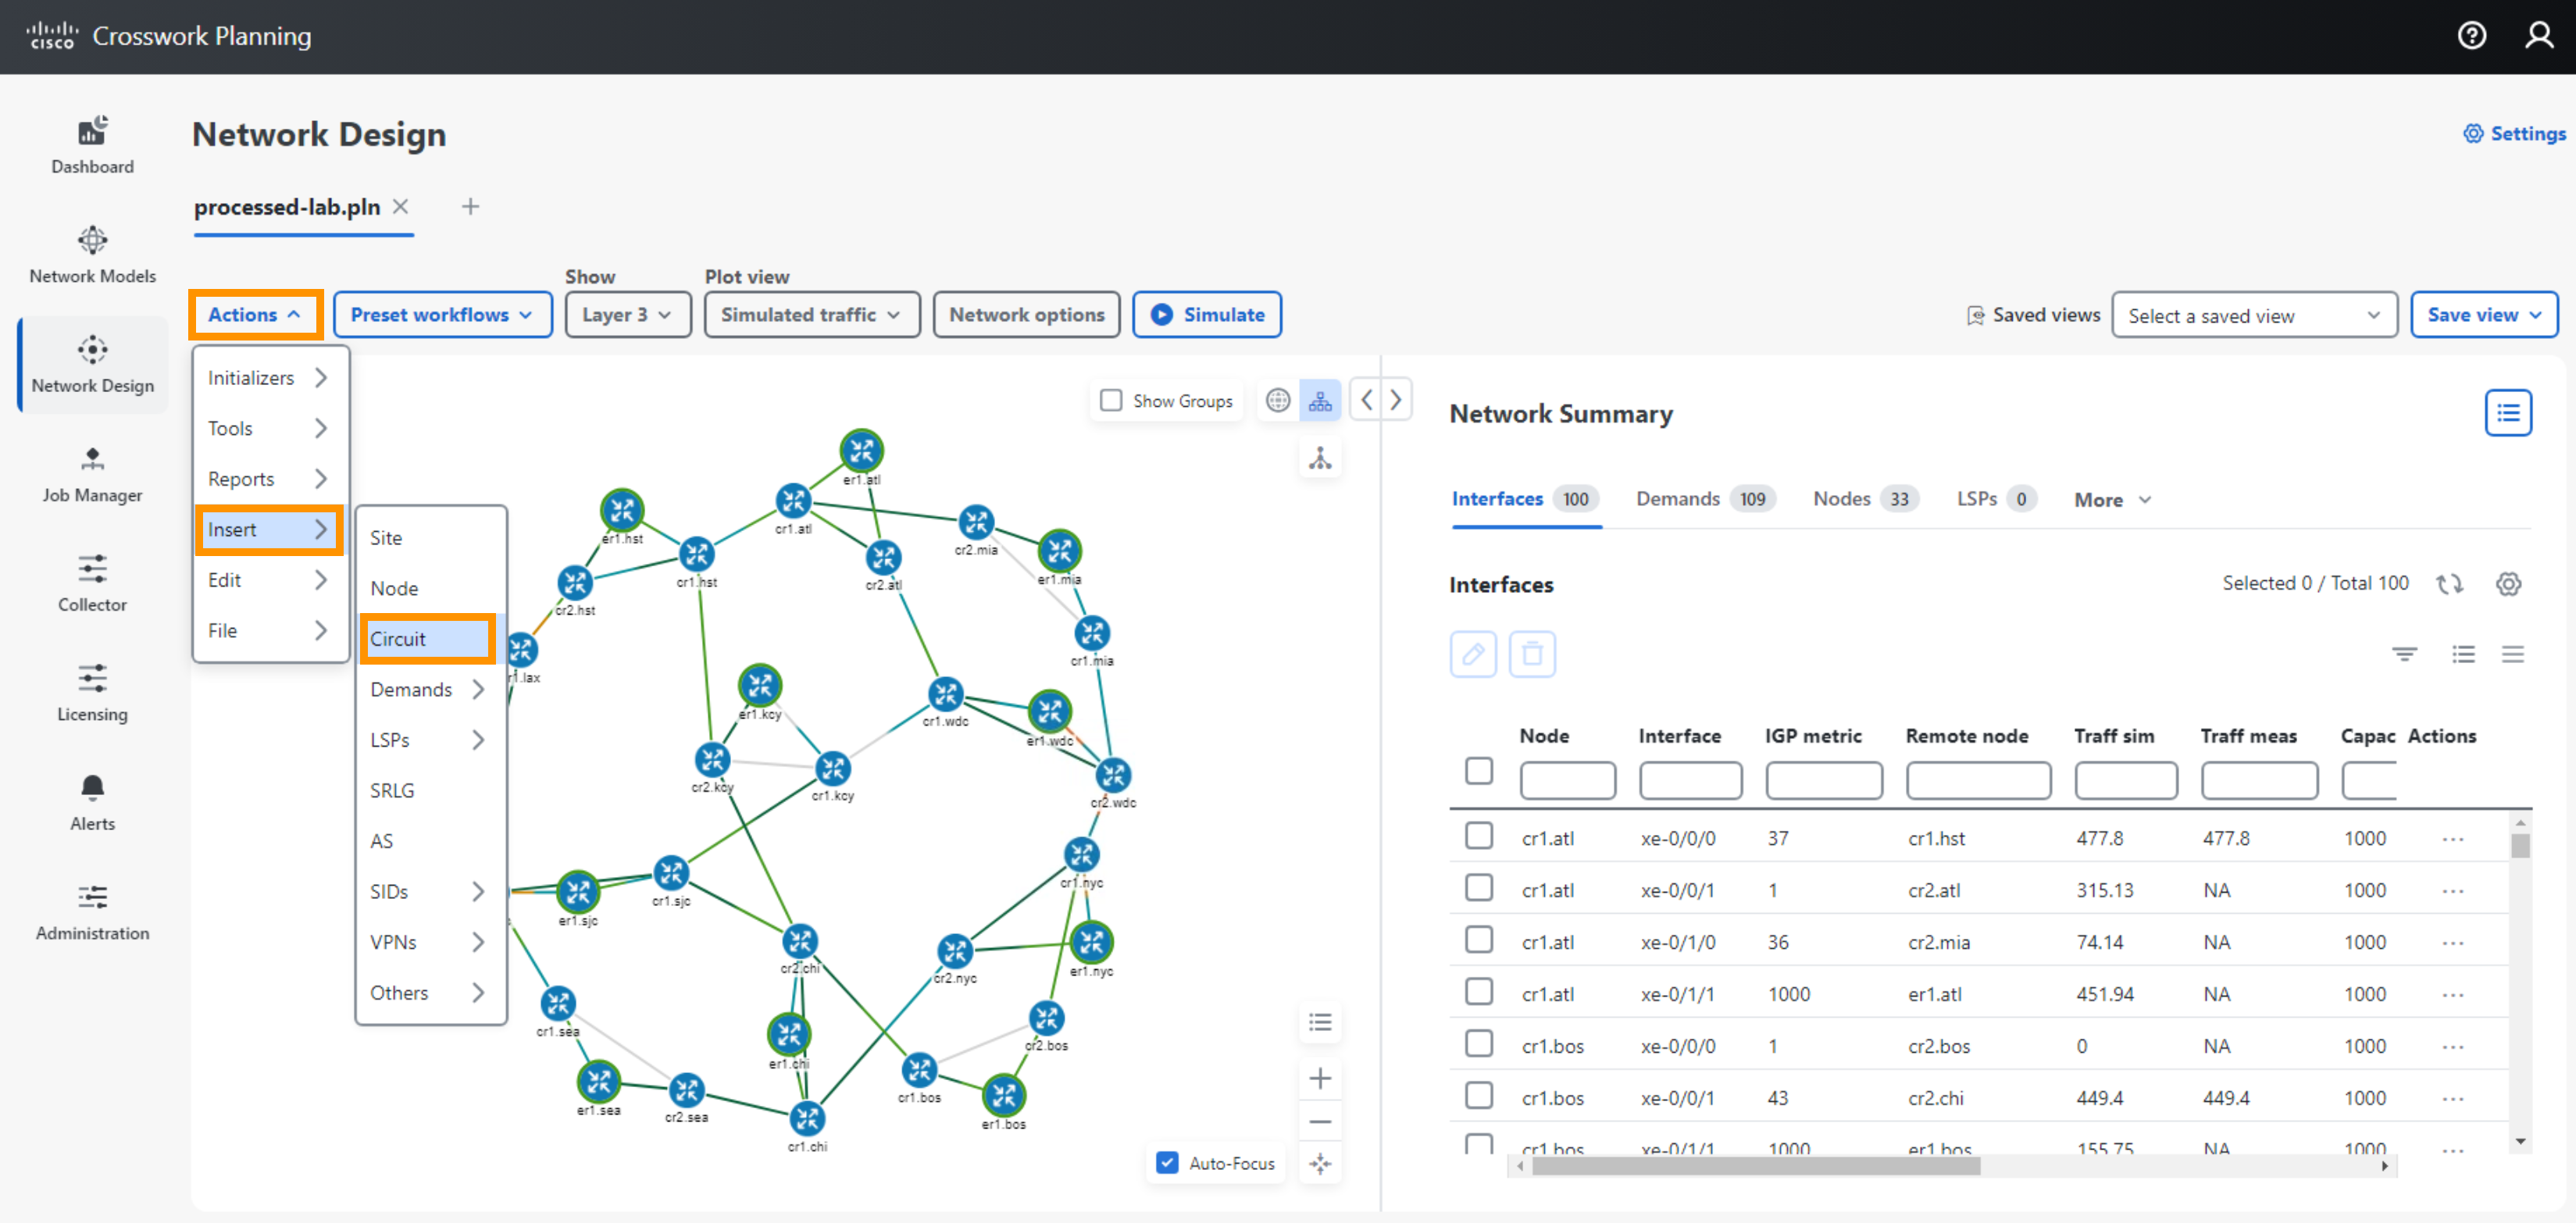
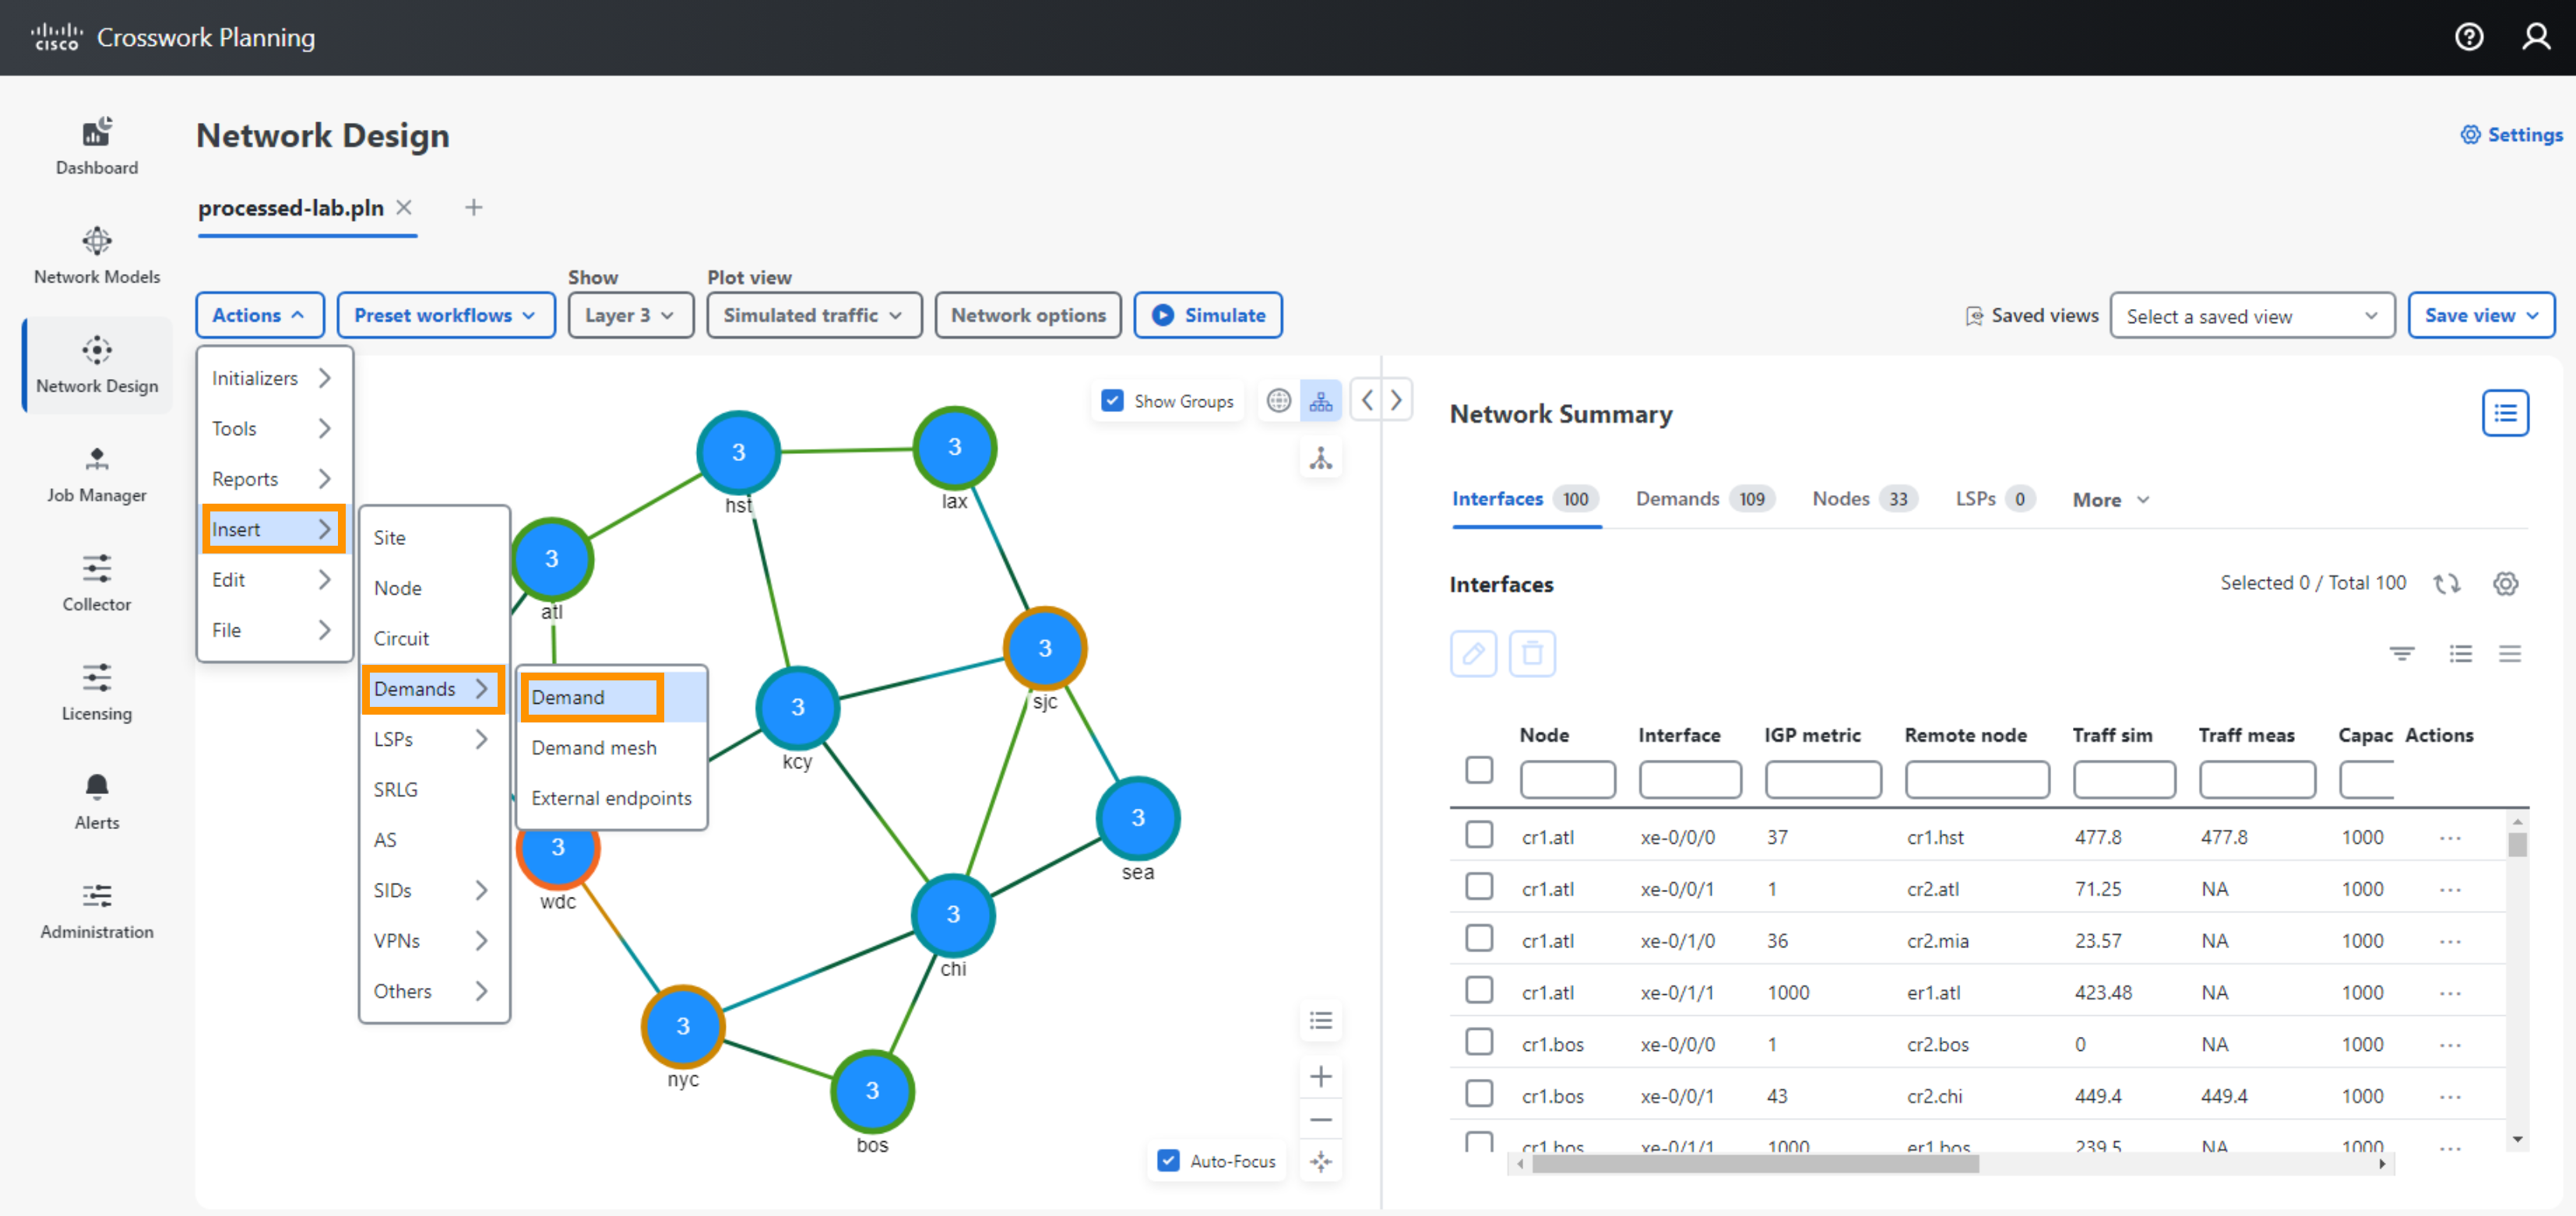
- Insert a new Demand by selecting Actions > Insert > Demands > Demand
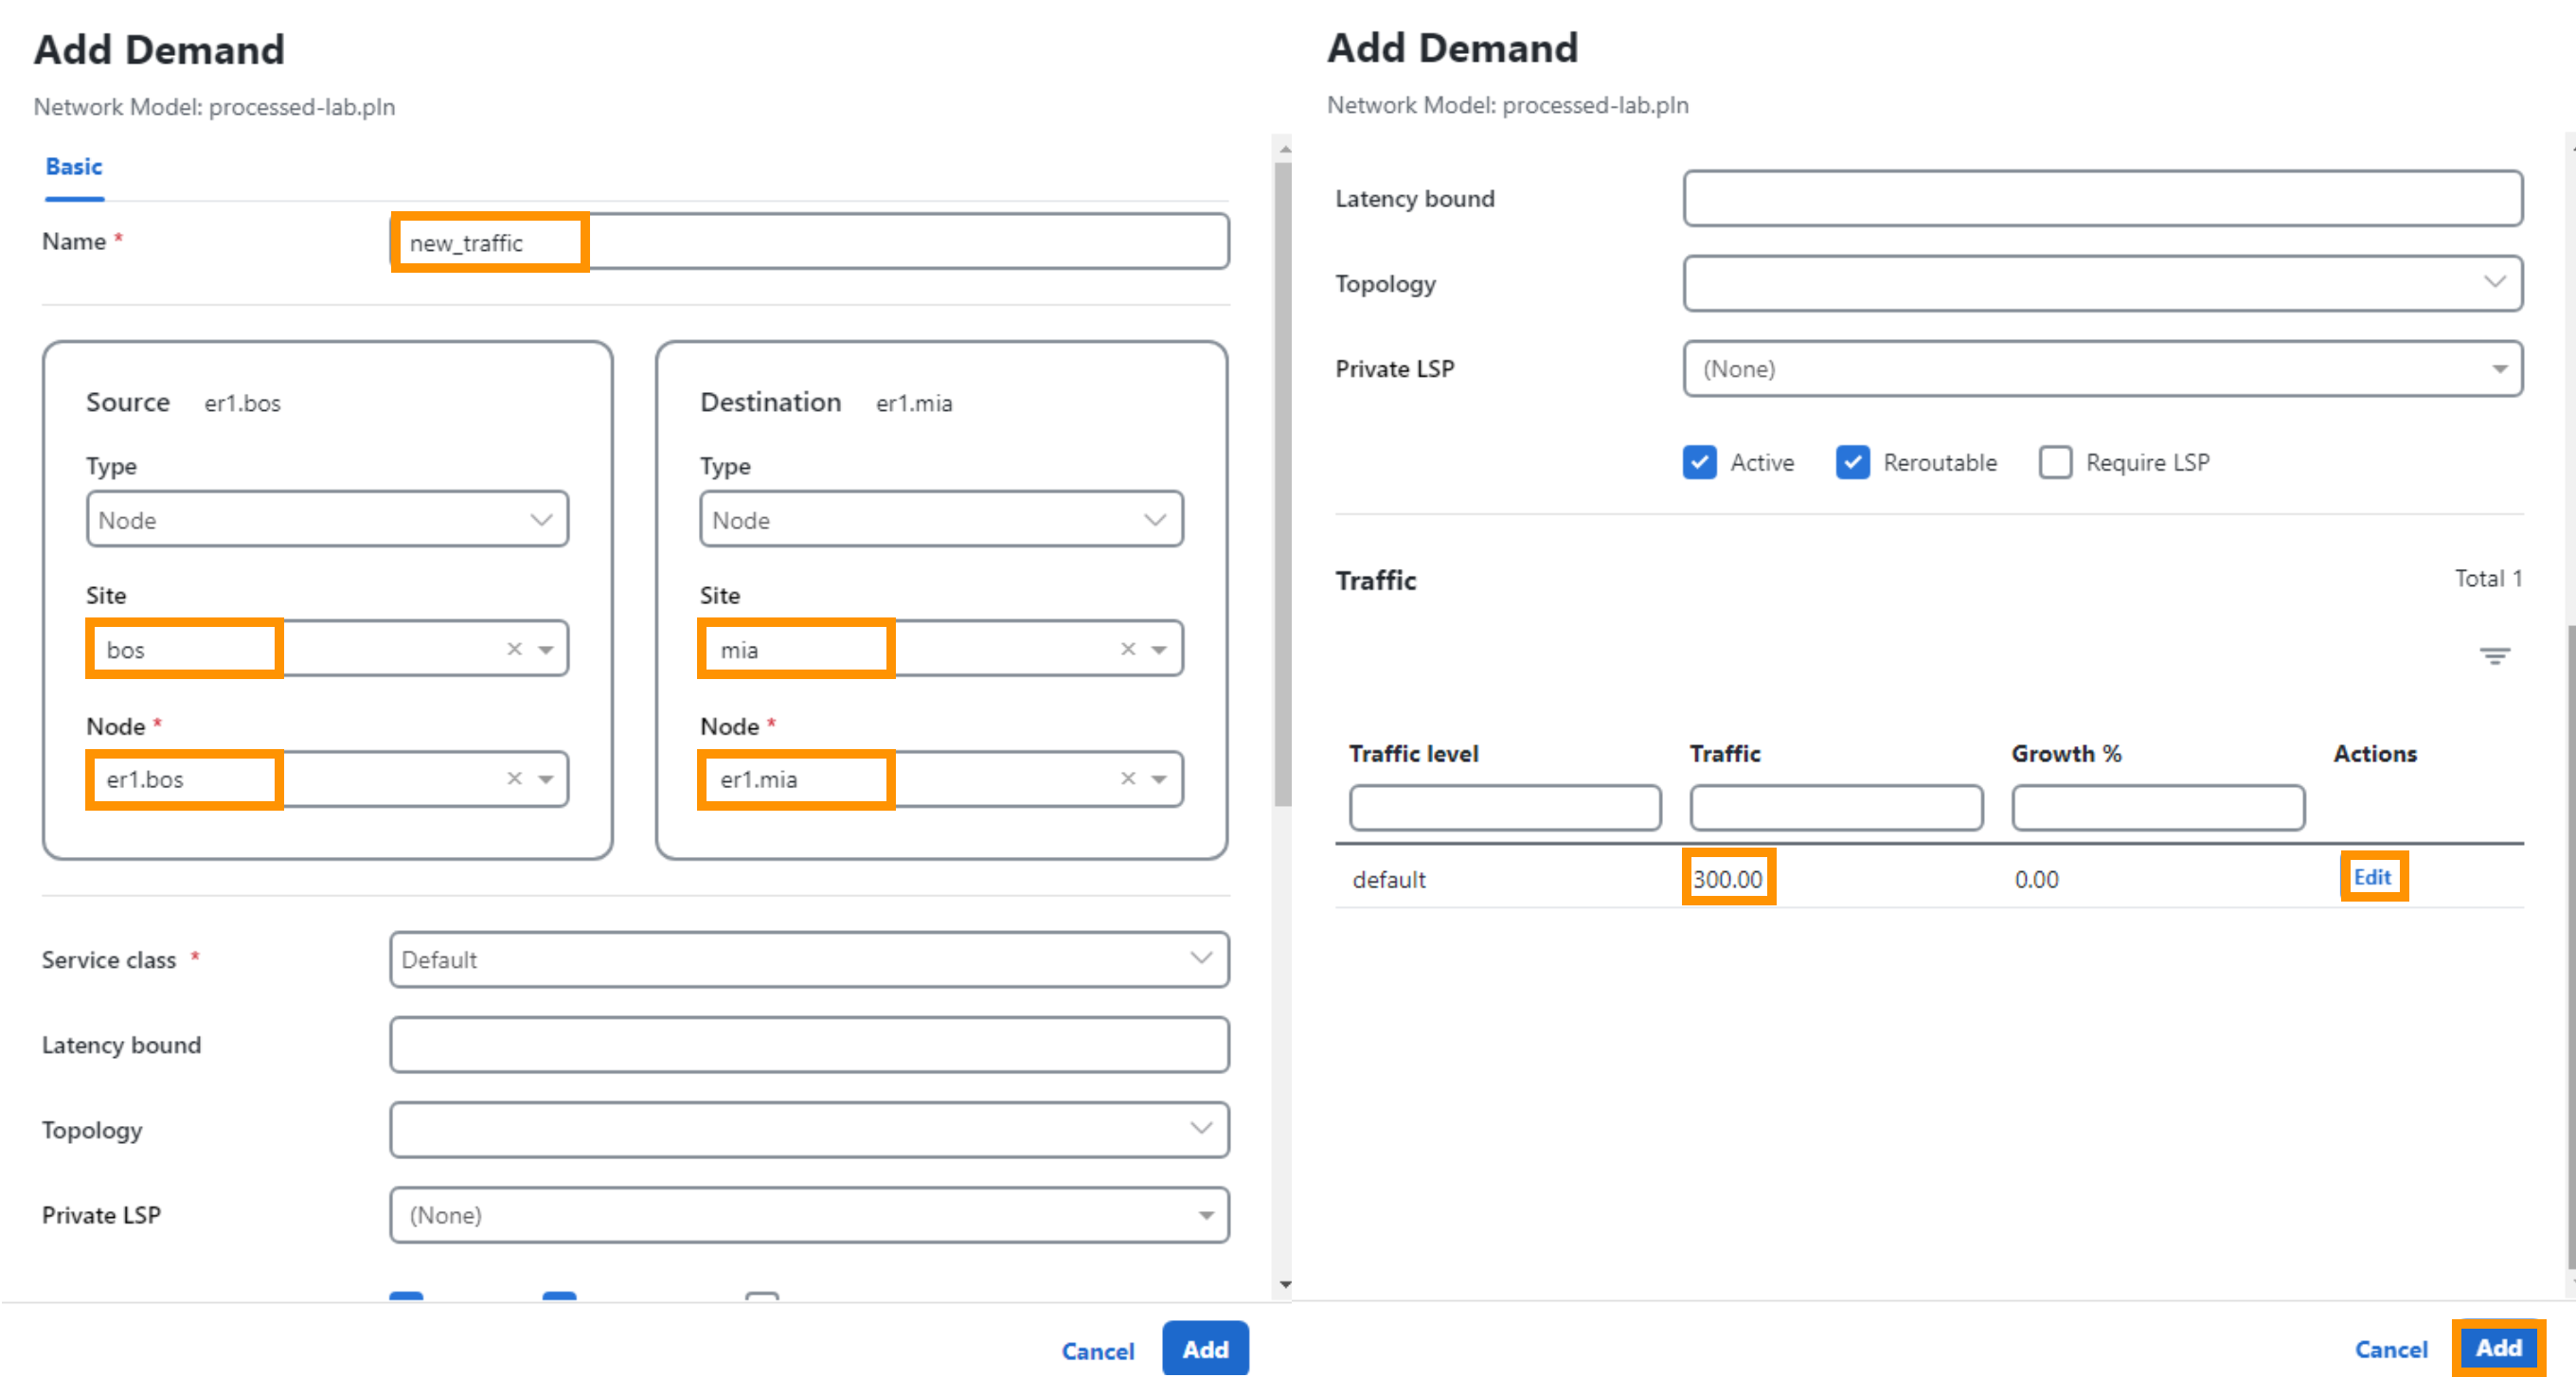
- Give the Demand a name: new_traffic
- Give the demand a source: er1.bos
- Give the demand a destination: er1.mia
- Give the demand an amount of Traffic (mbps): 300
- Select Add
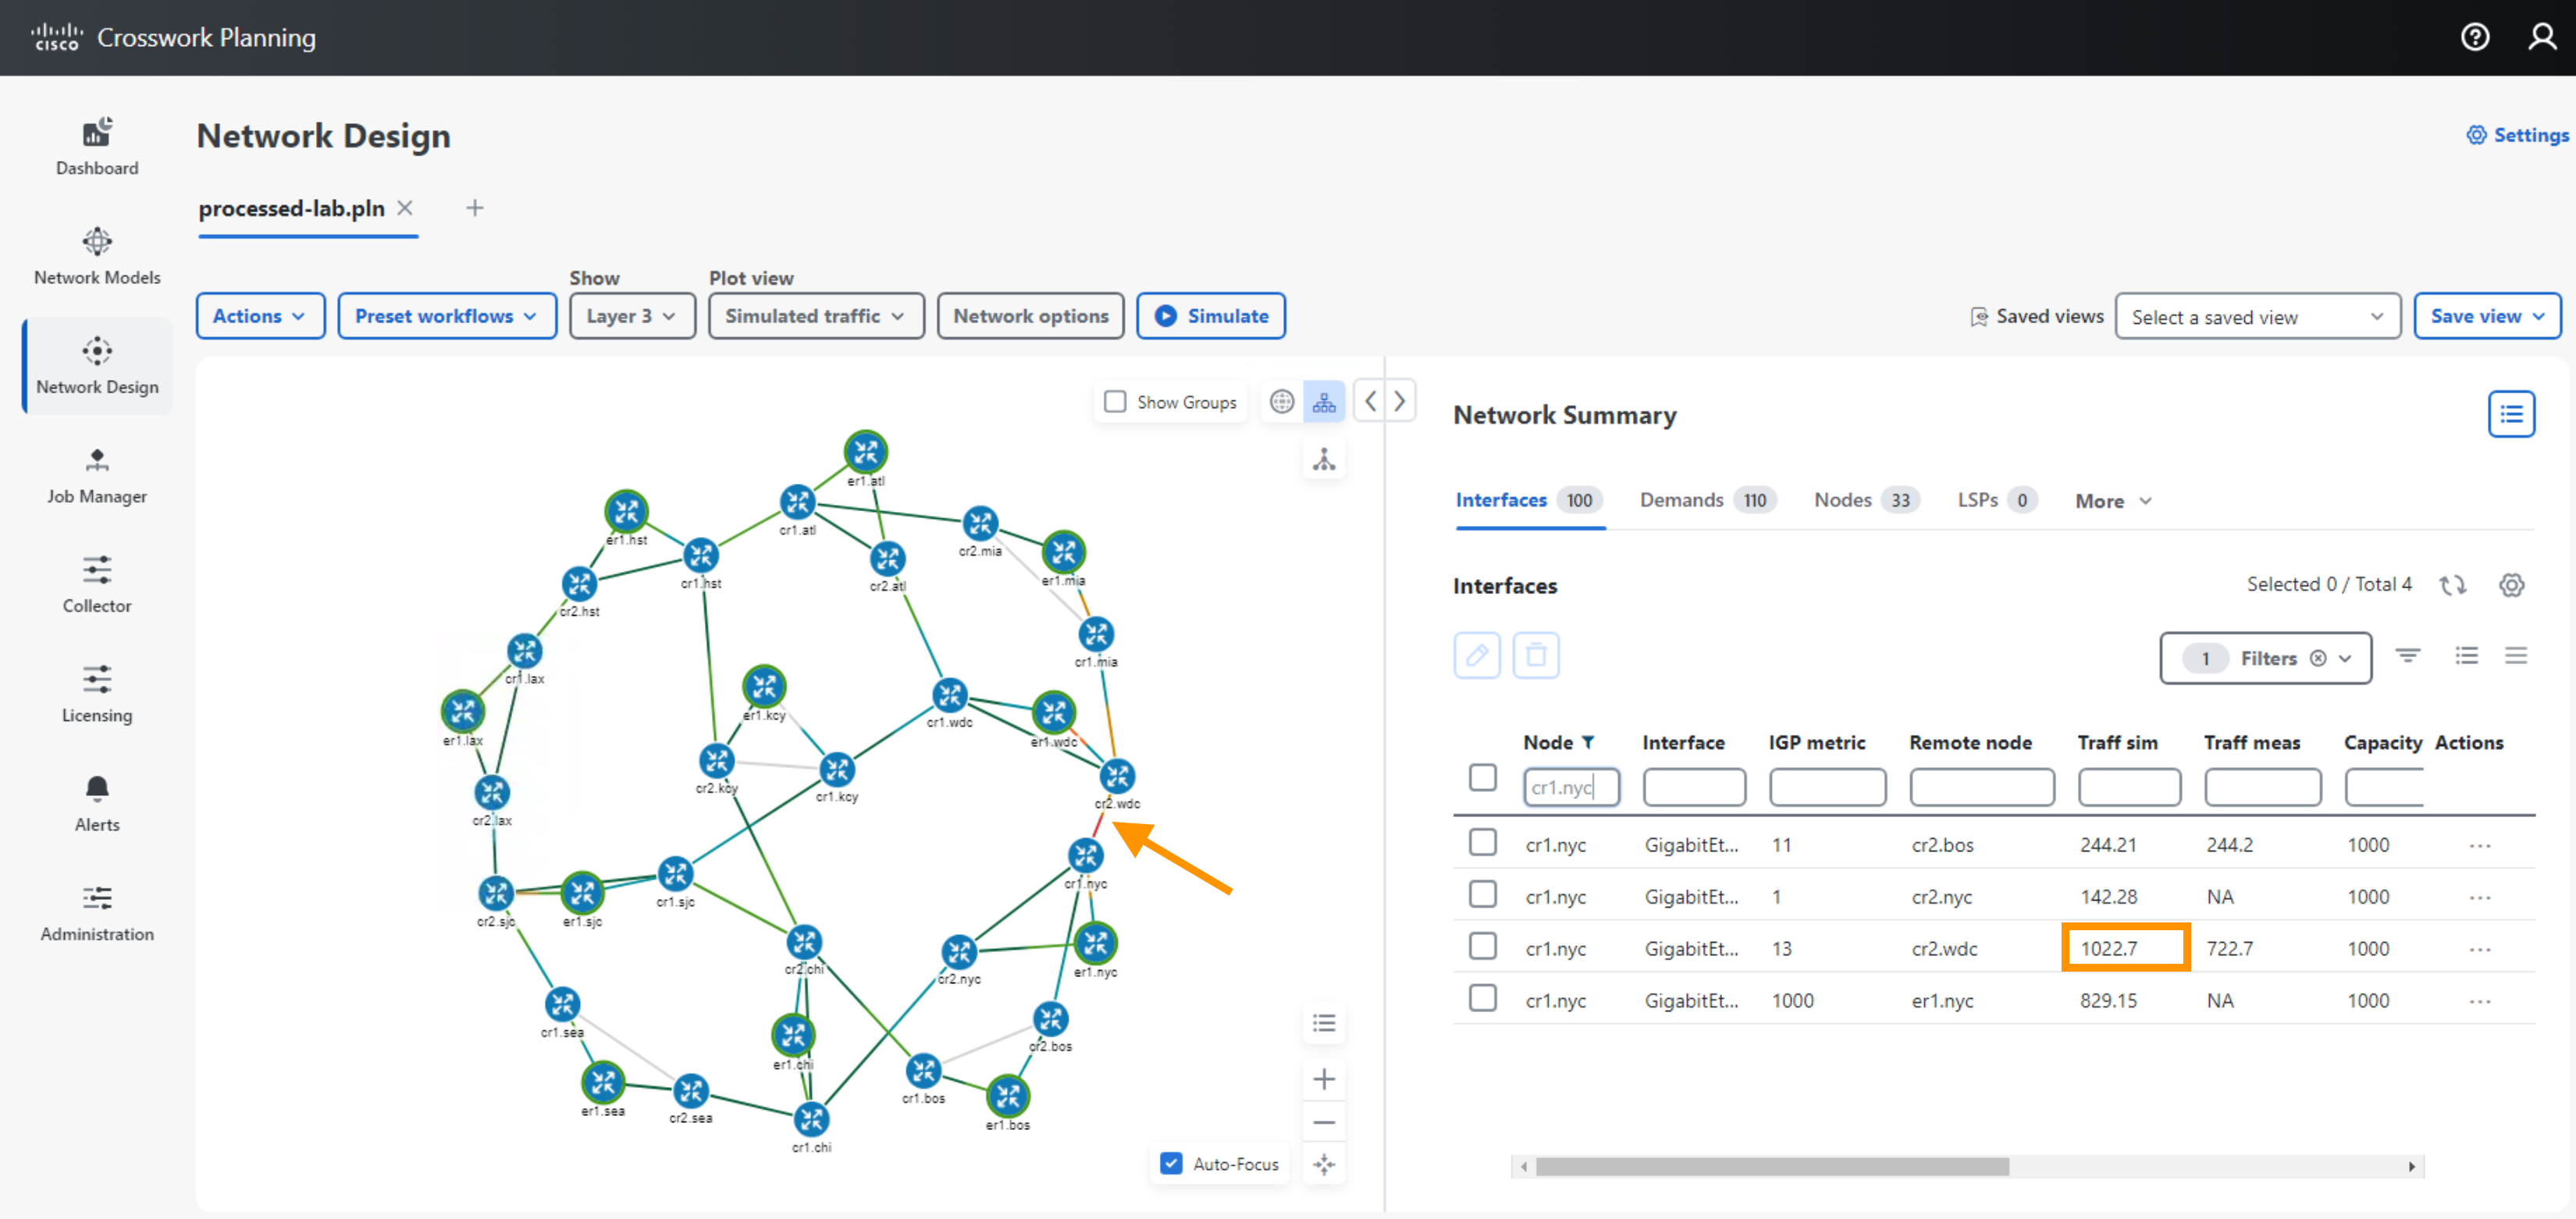
- Observe congestion on Interface: cr1.nyc GigabitEthernet0/0/3/0
- Add a MPLS RSVP Tunnel
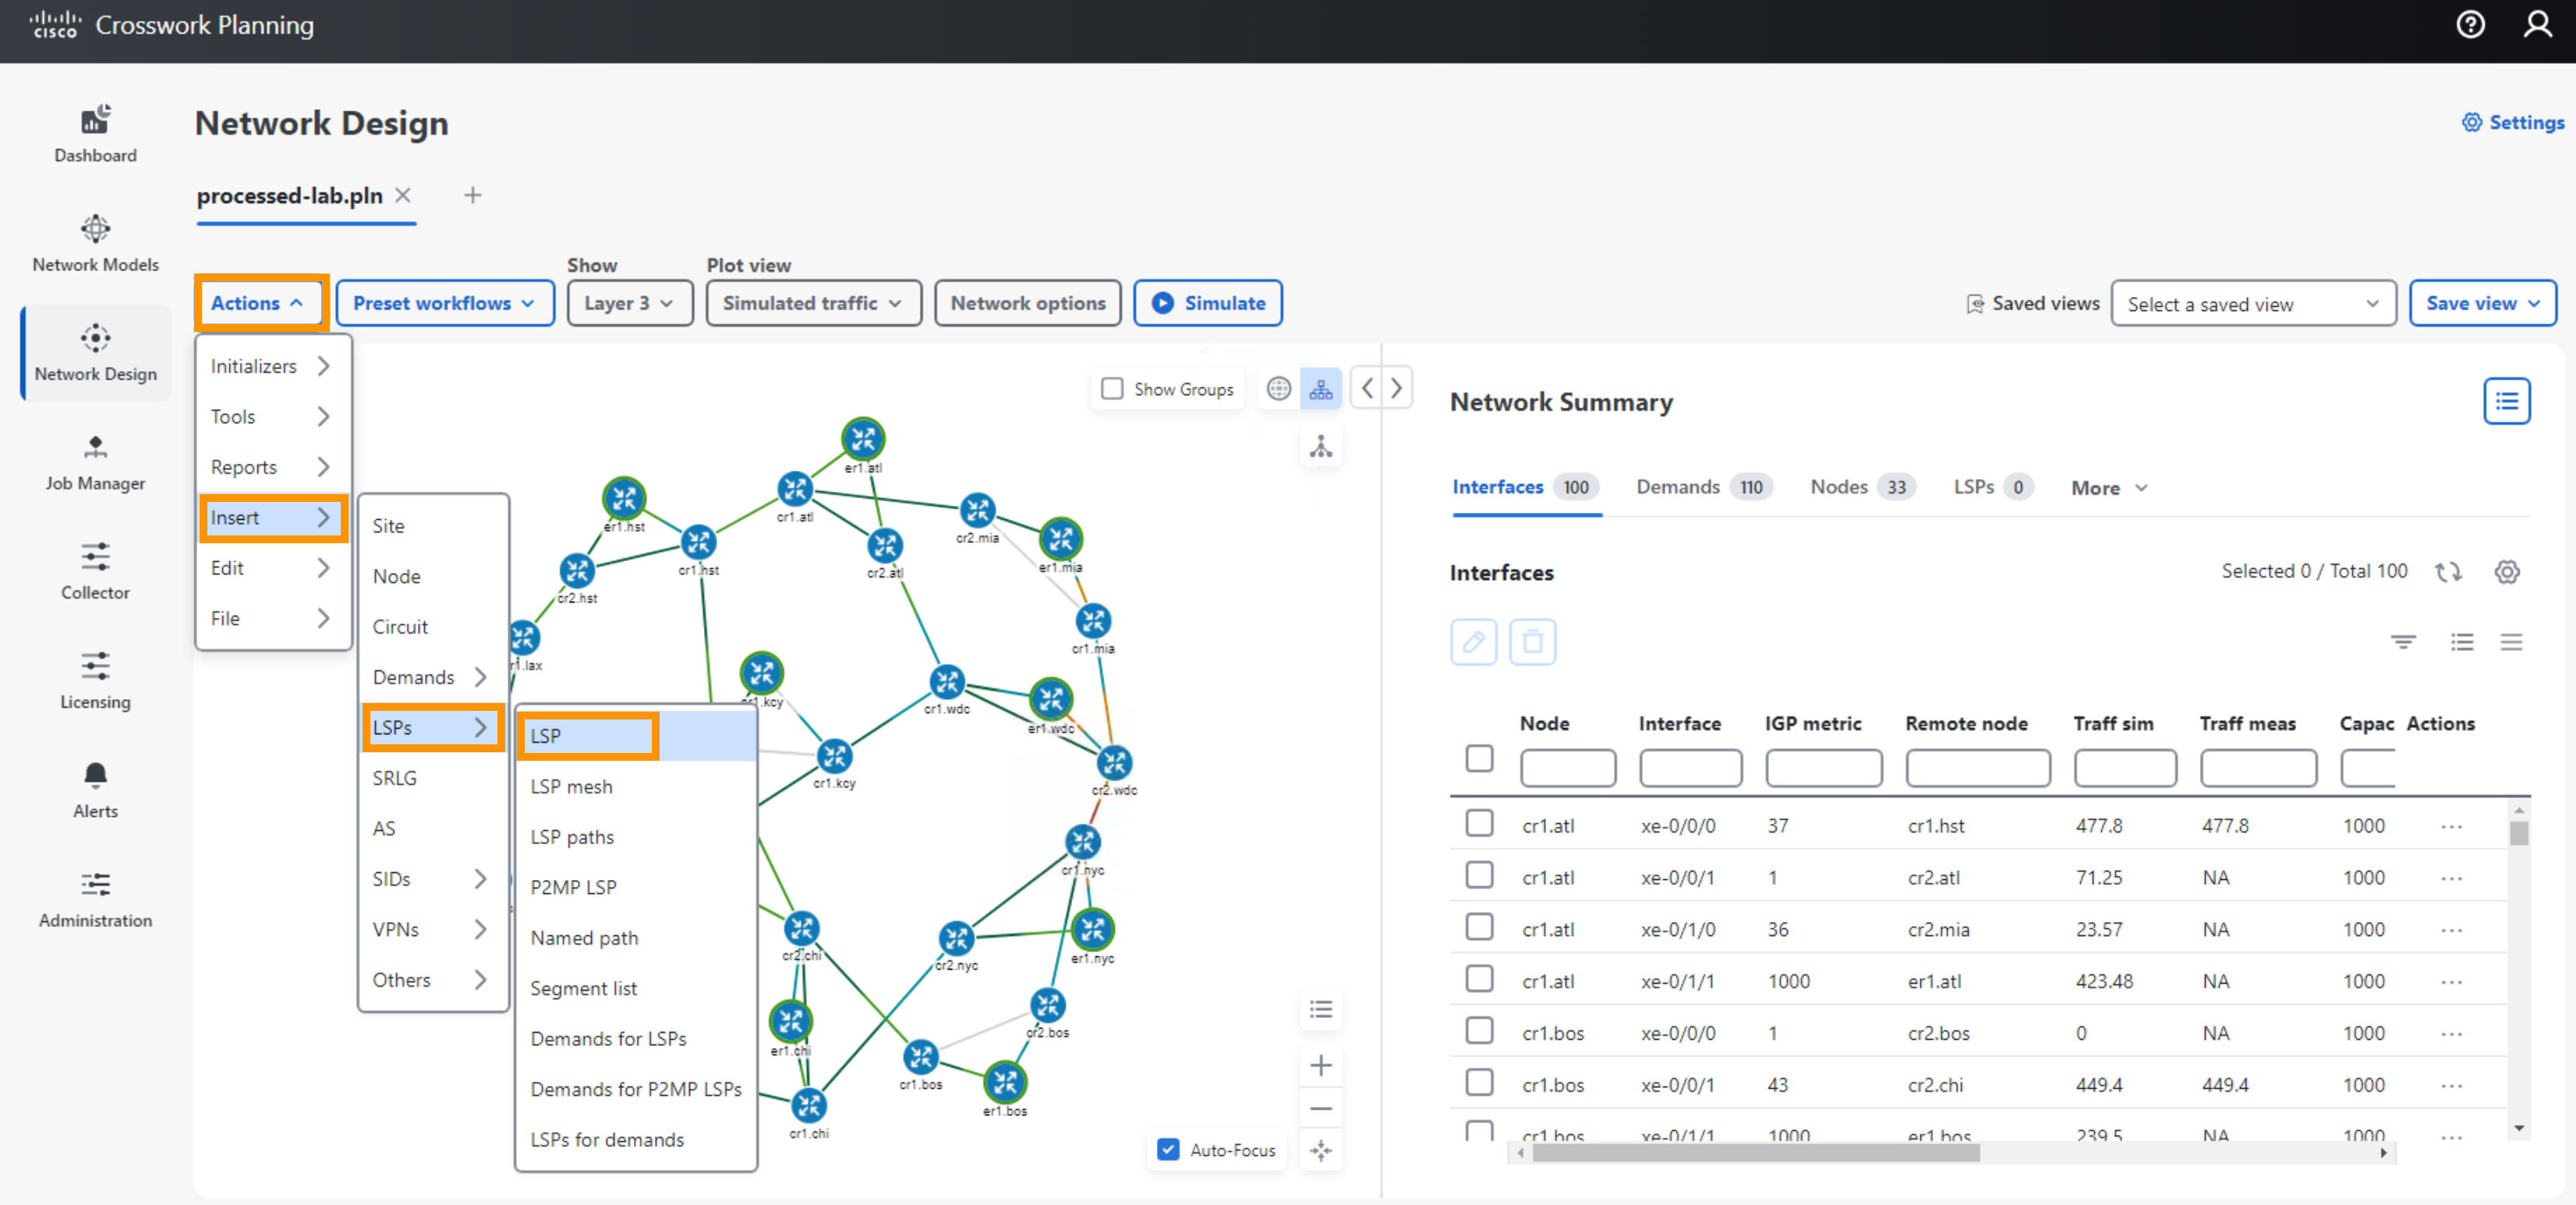
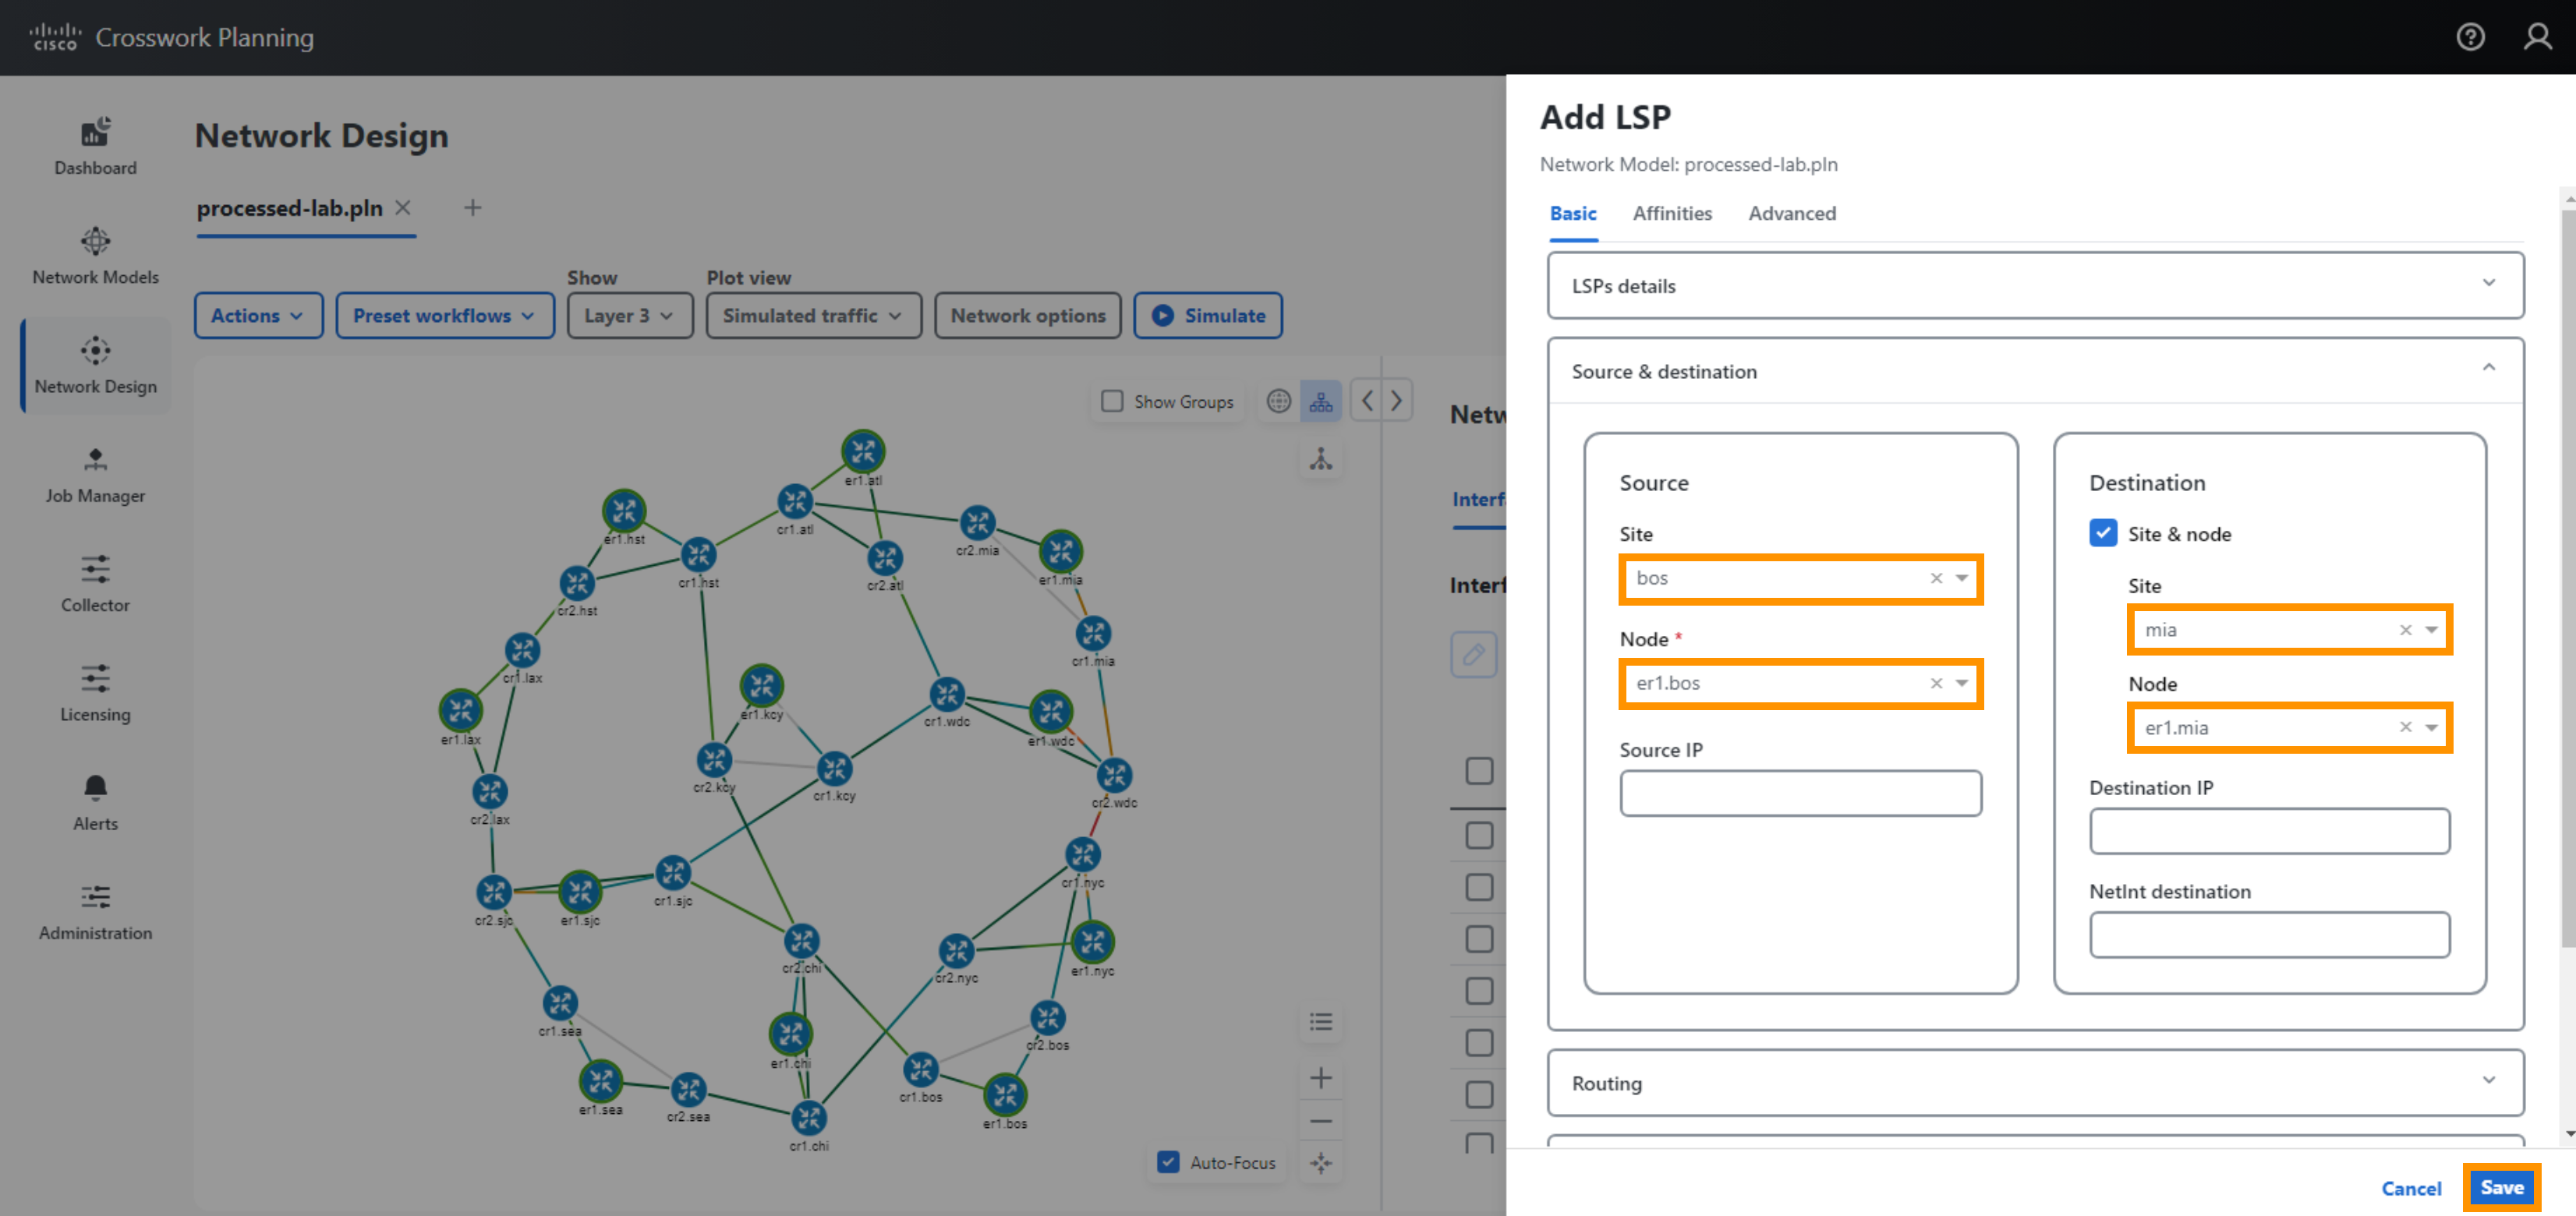
- Insert a new Tunnel by selecting Actions > Insert > LSPs > LSP
- Select tunnel type: RSVP
- Give the tunnel a name: rsvp_to_er1.mia
- Give the tunnel a source: er1.bos
- Give the demand a destination: er1.mia
- Select Save
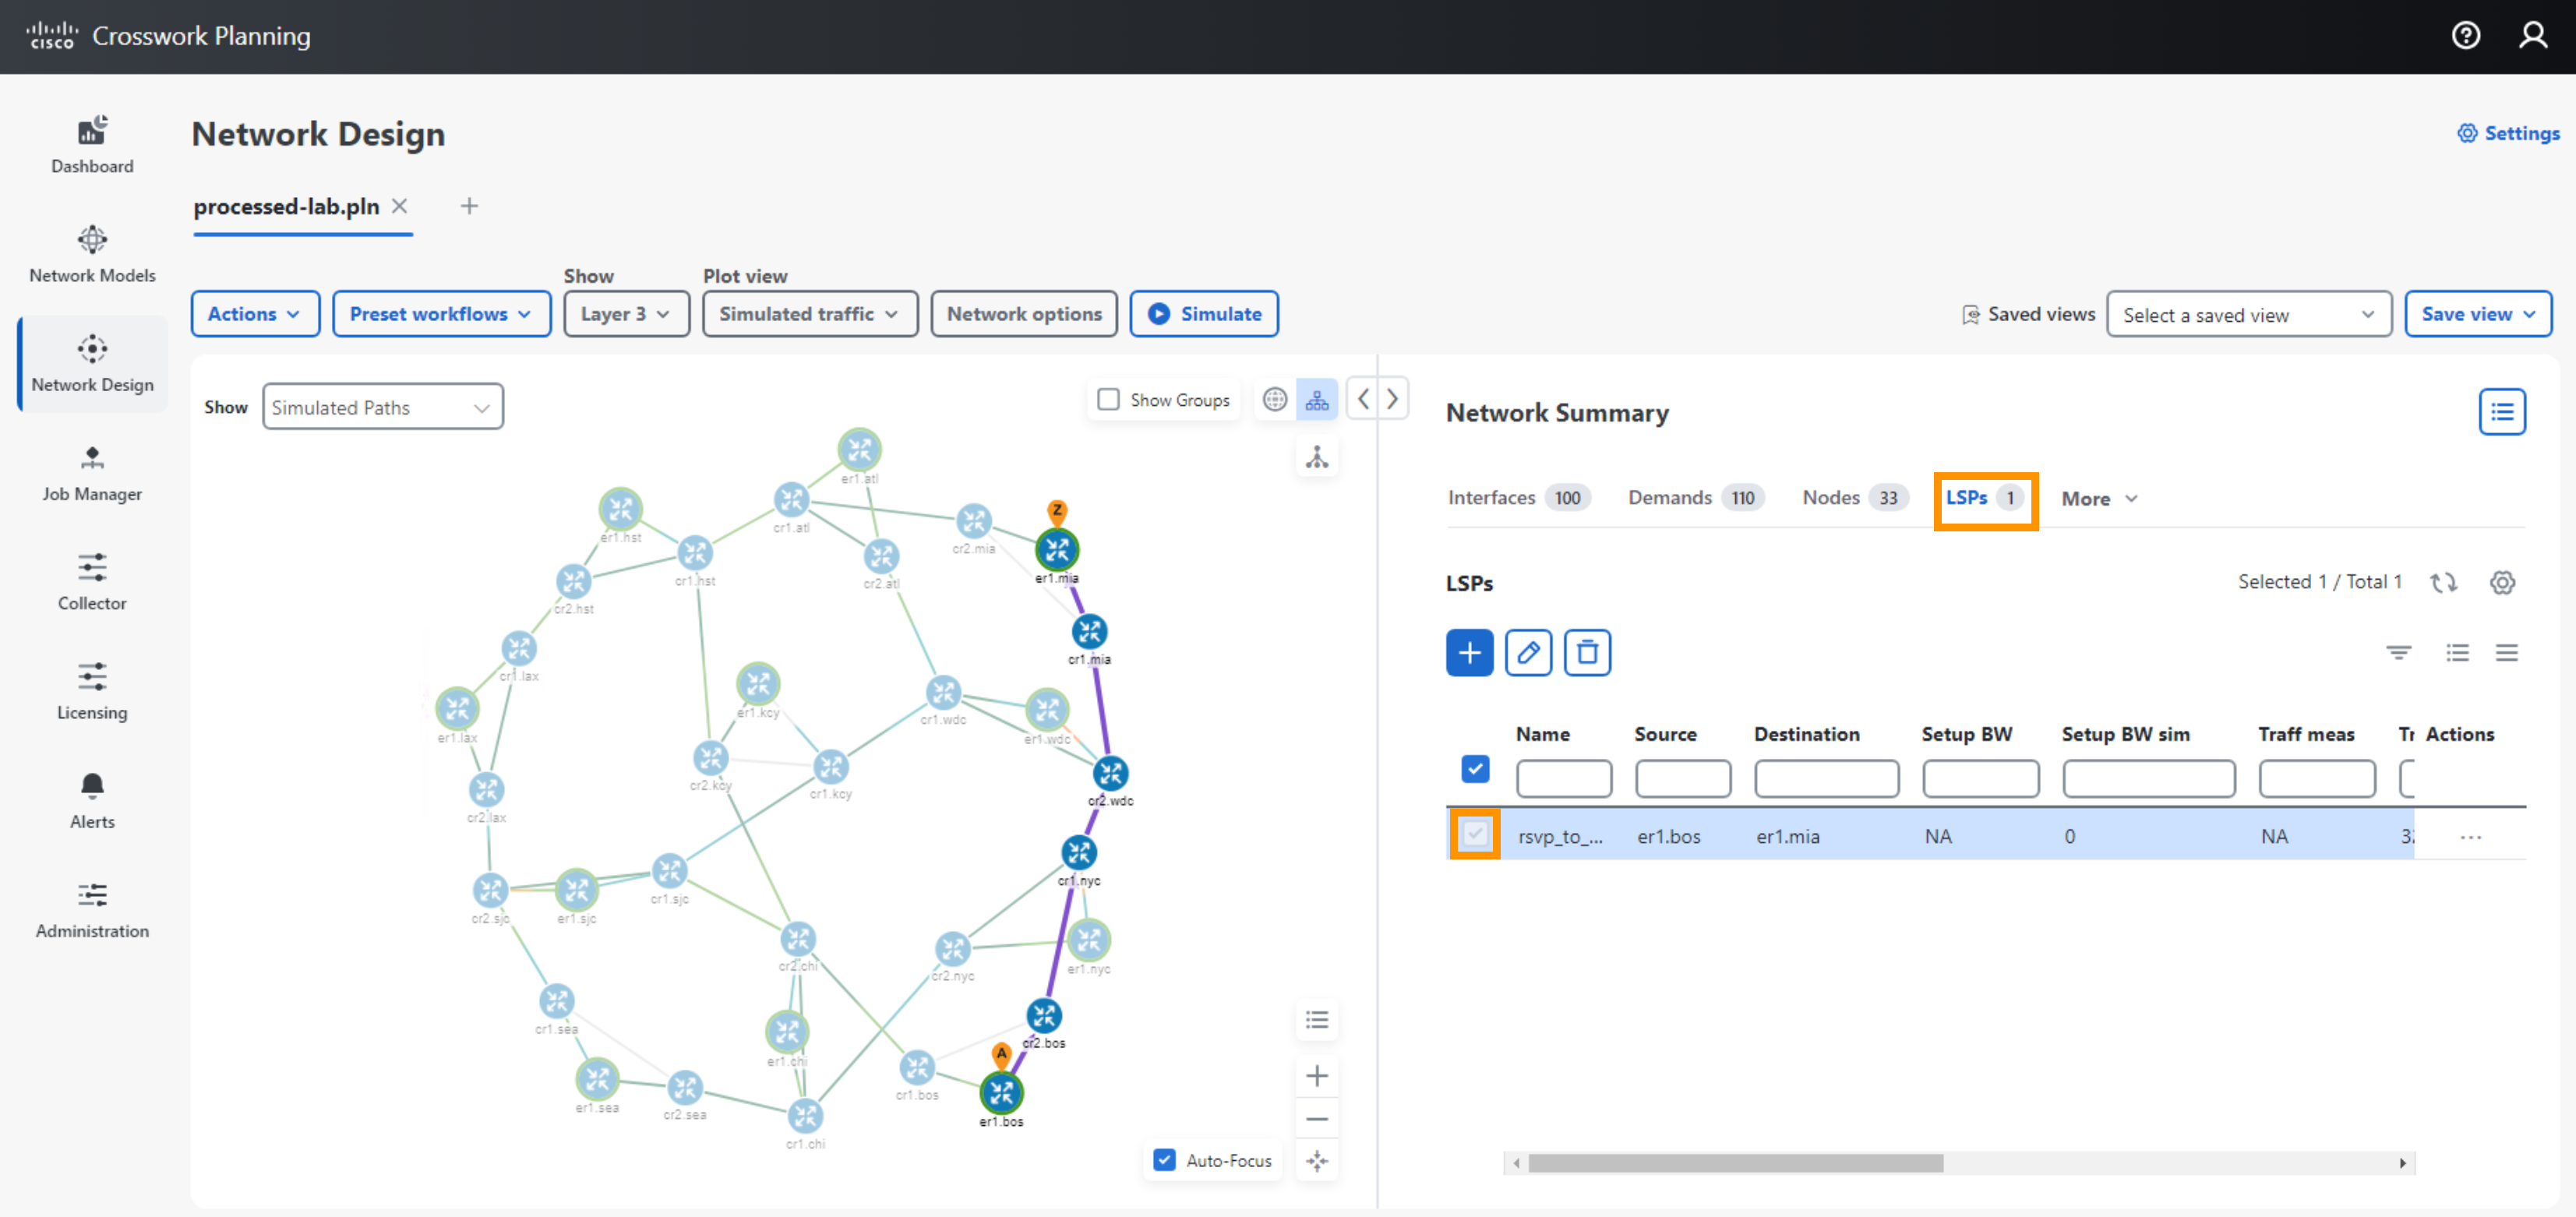
- Select the LSP in the LSPs property table to observe its path.
- Optimize the Network
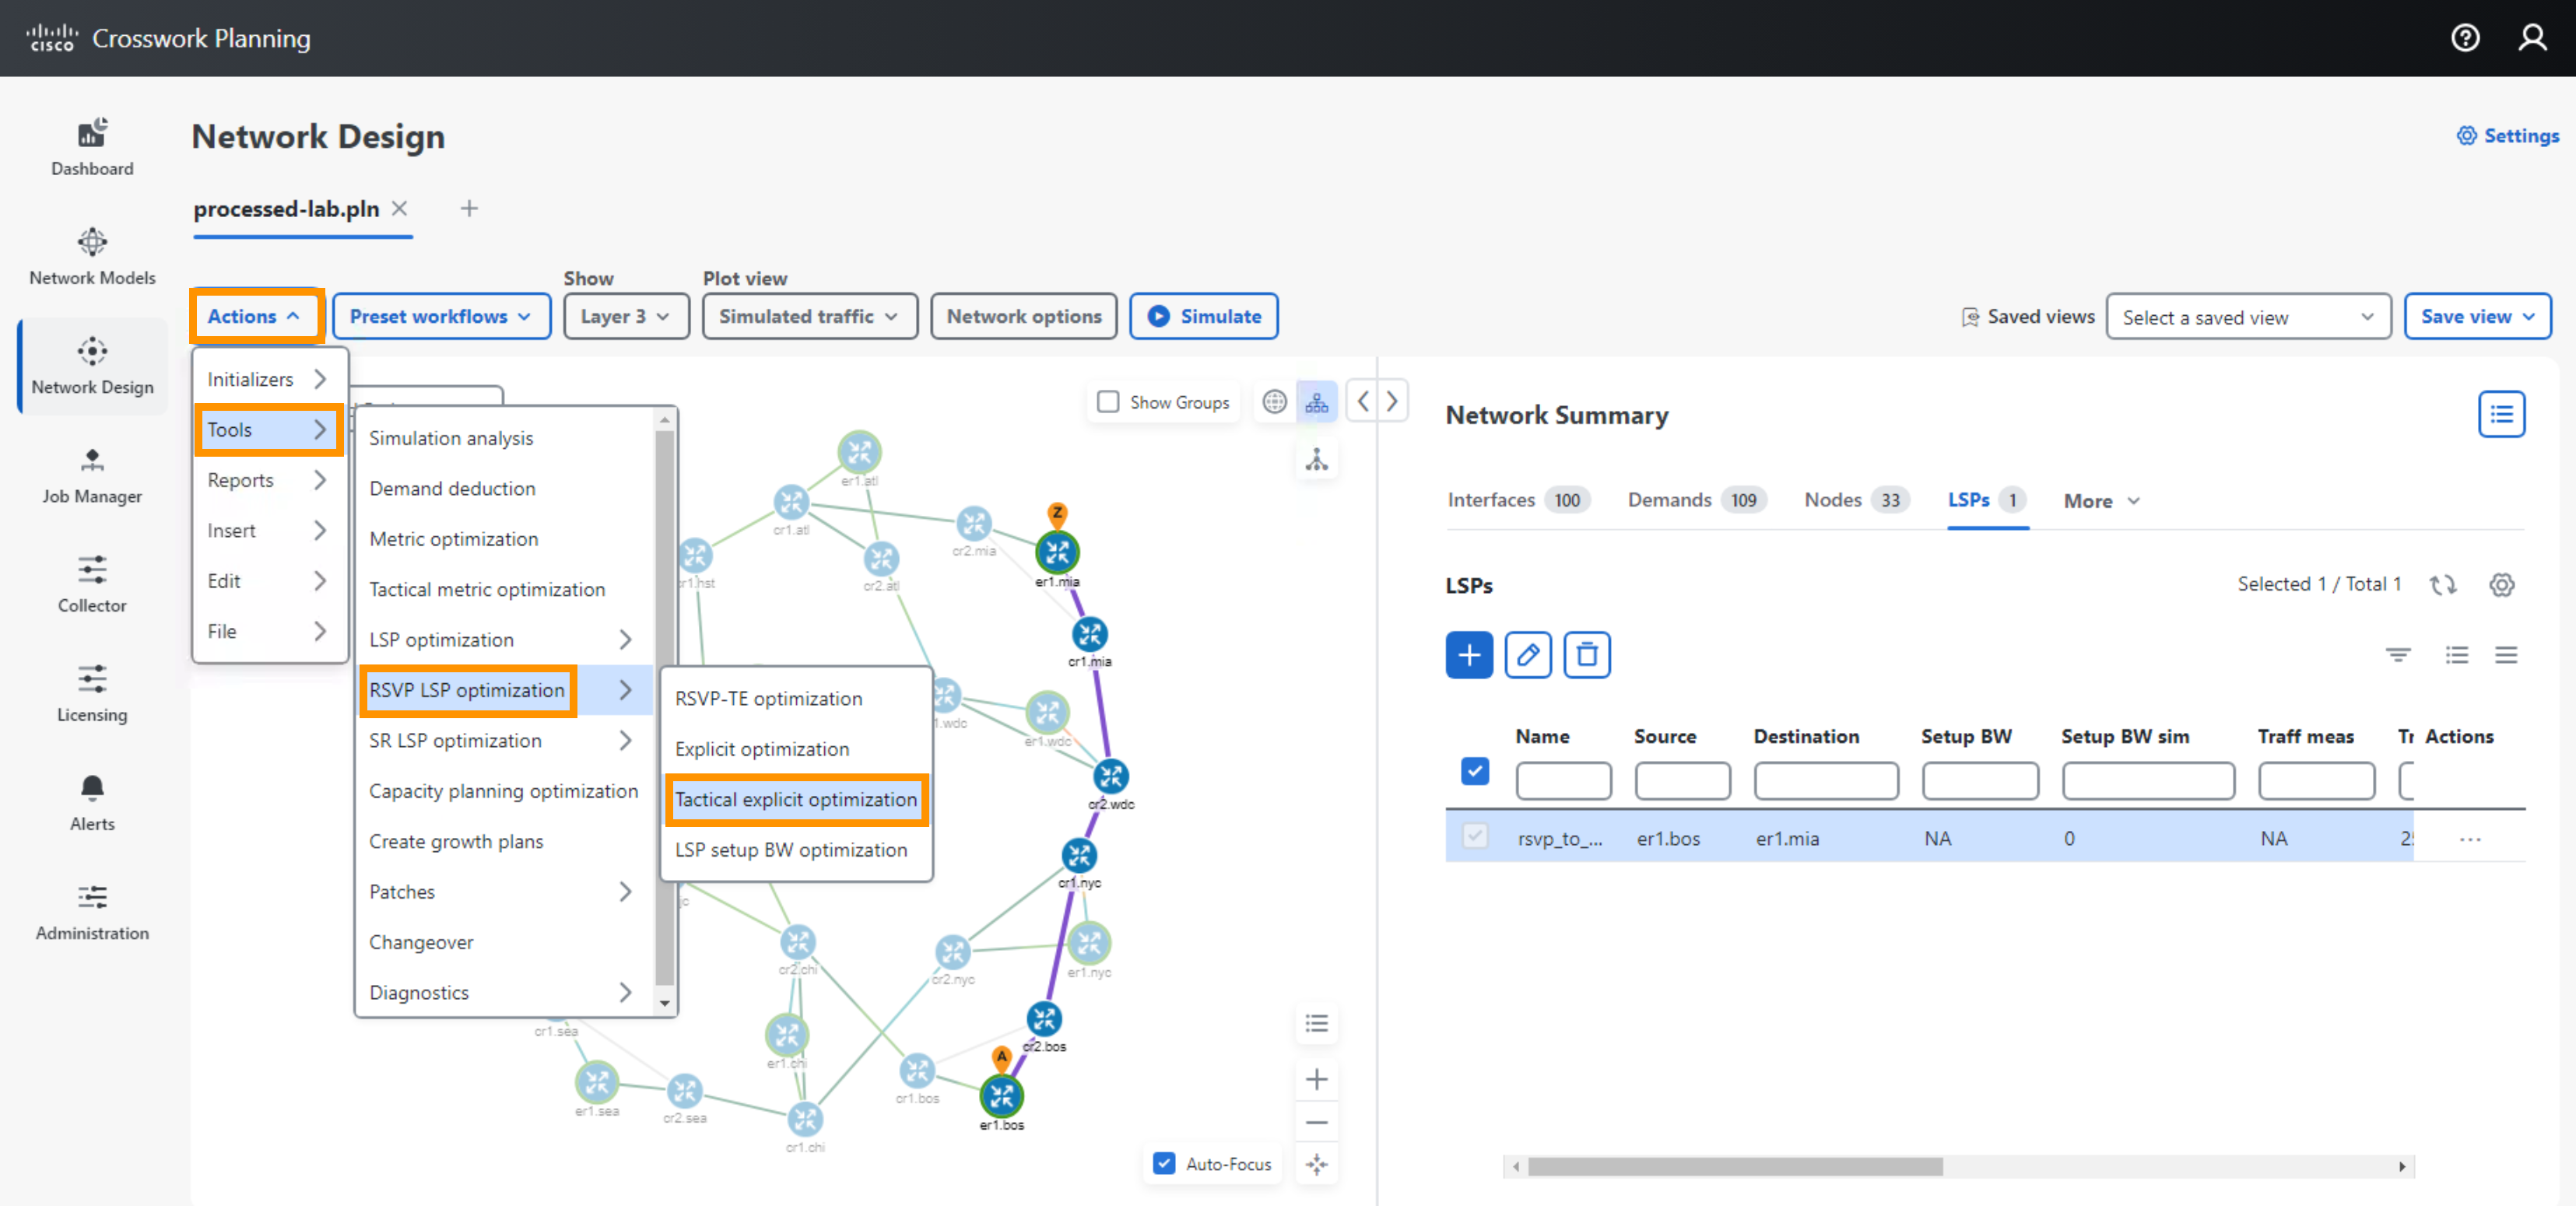
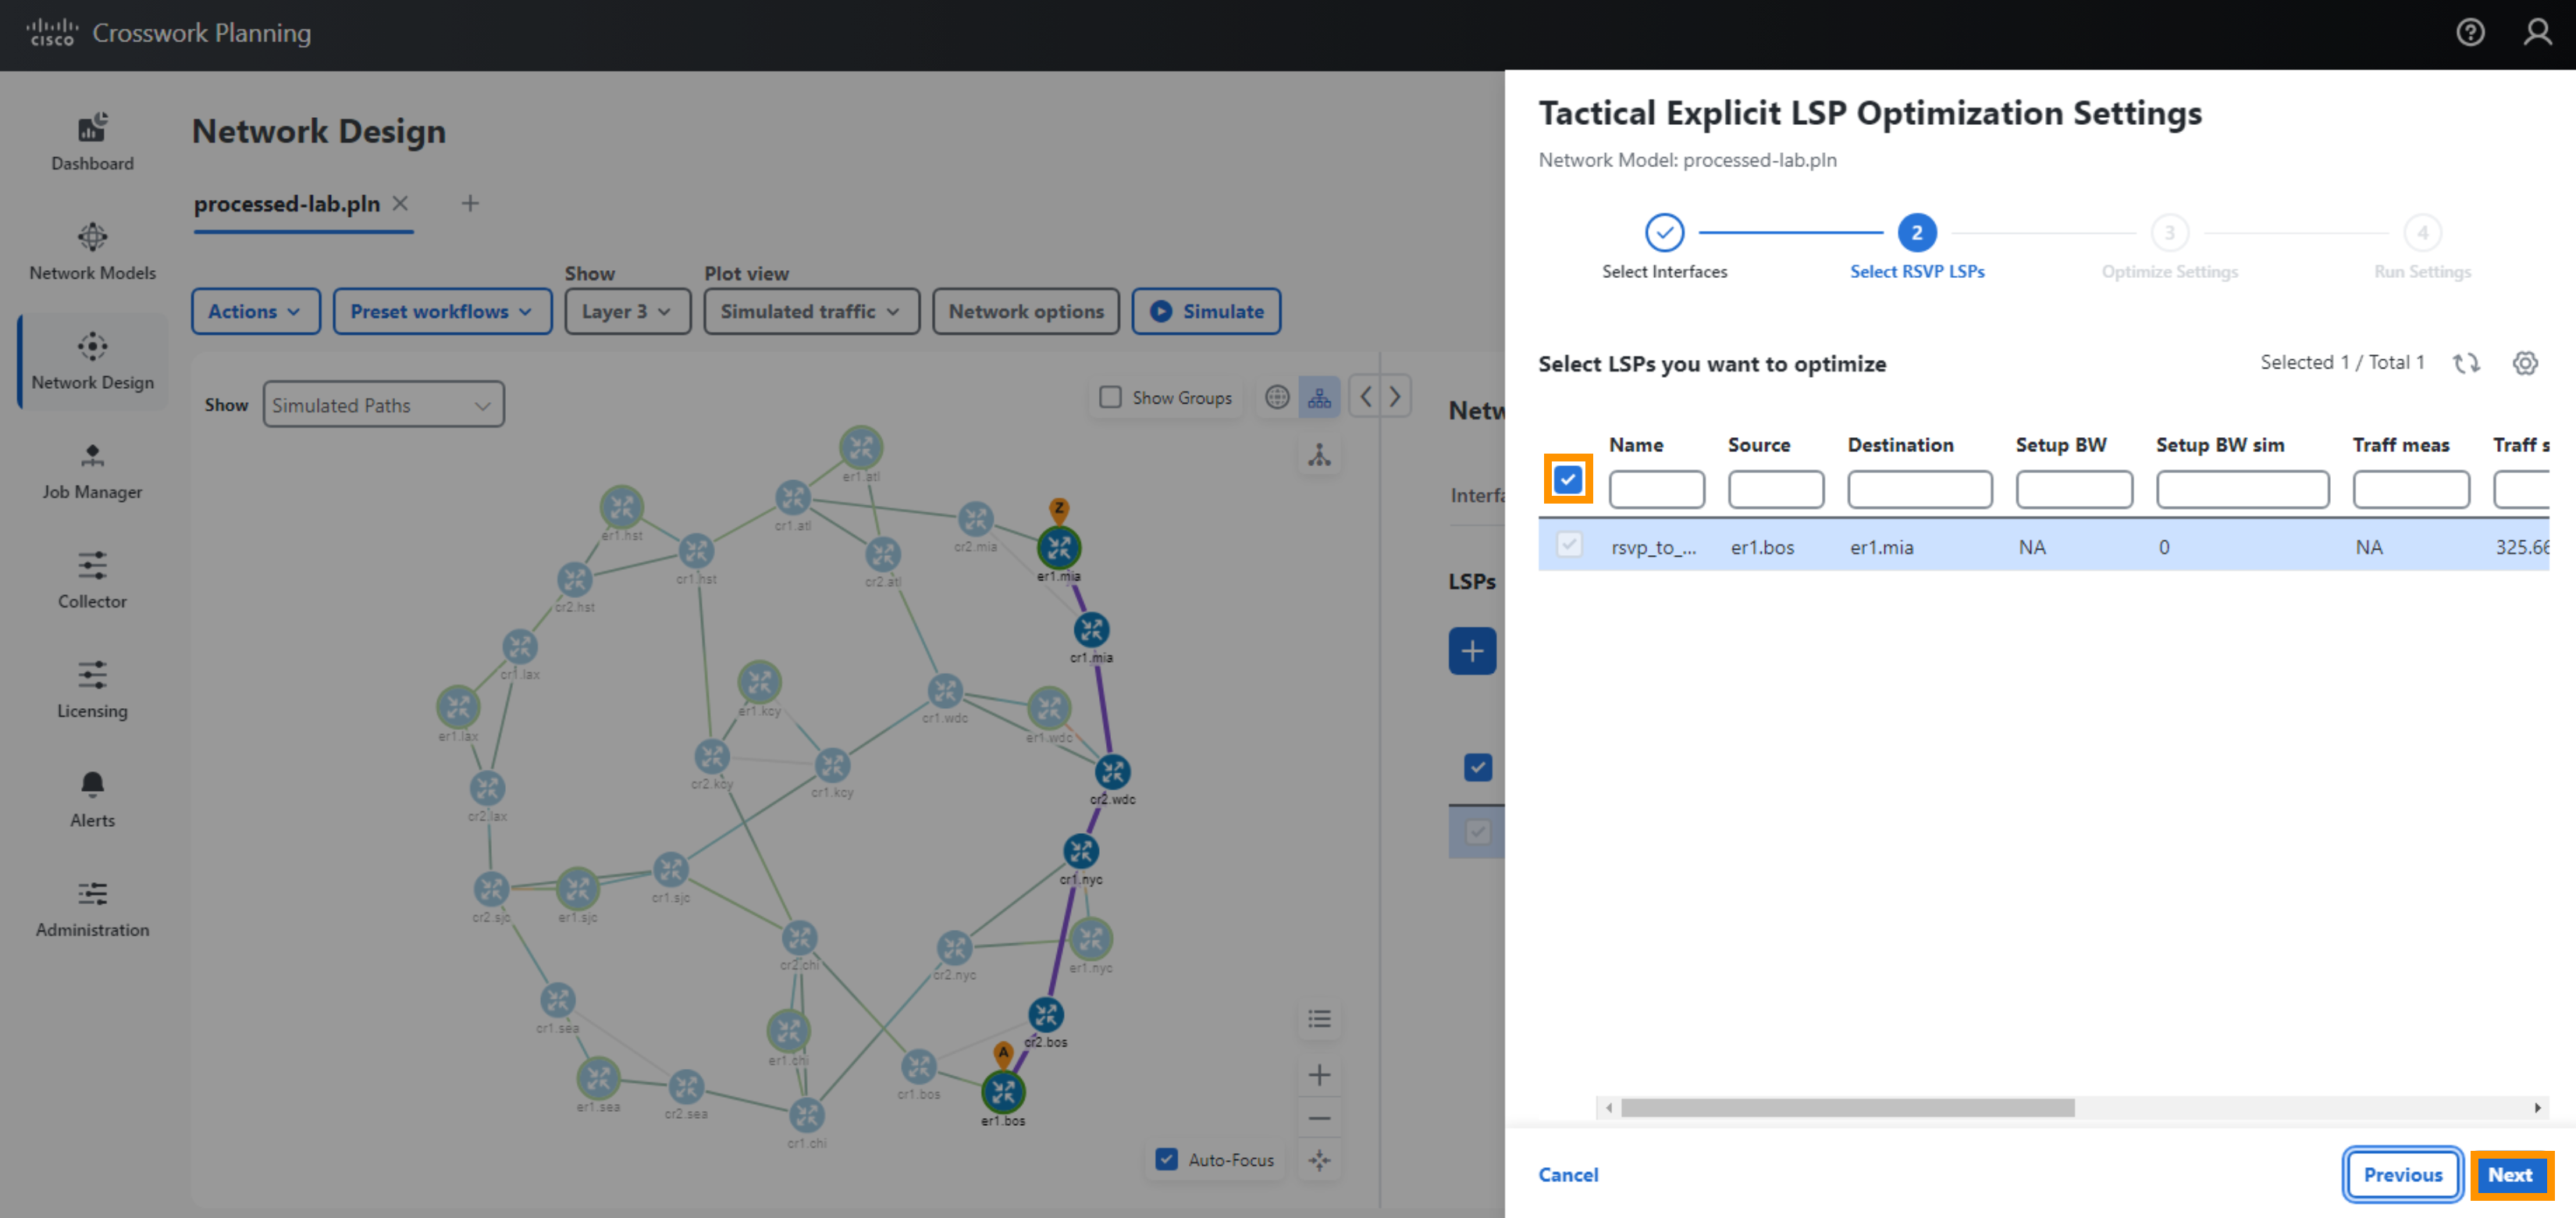
- Select Actions > Tools > RSVP LSP Optimization > Tactical explicit optimization
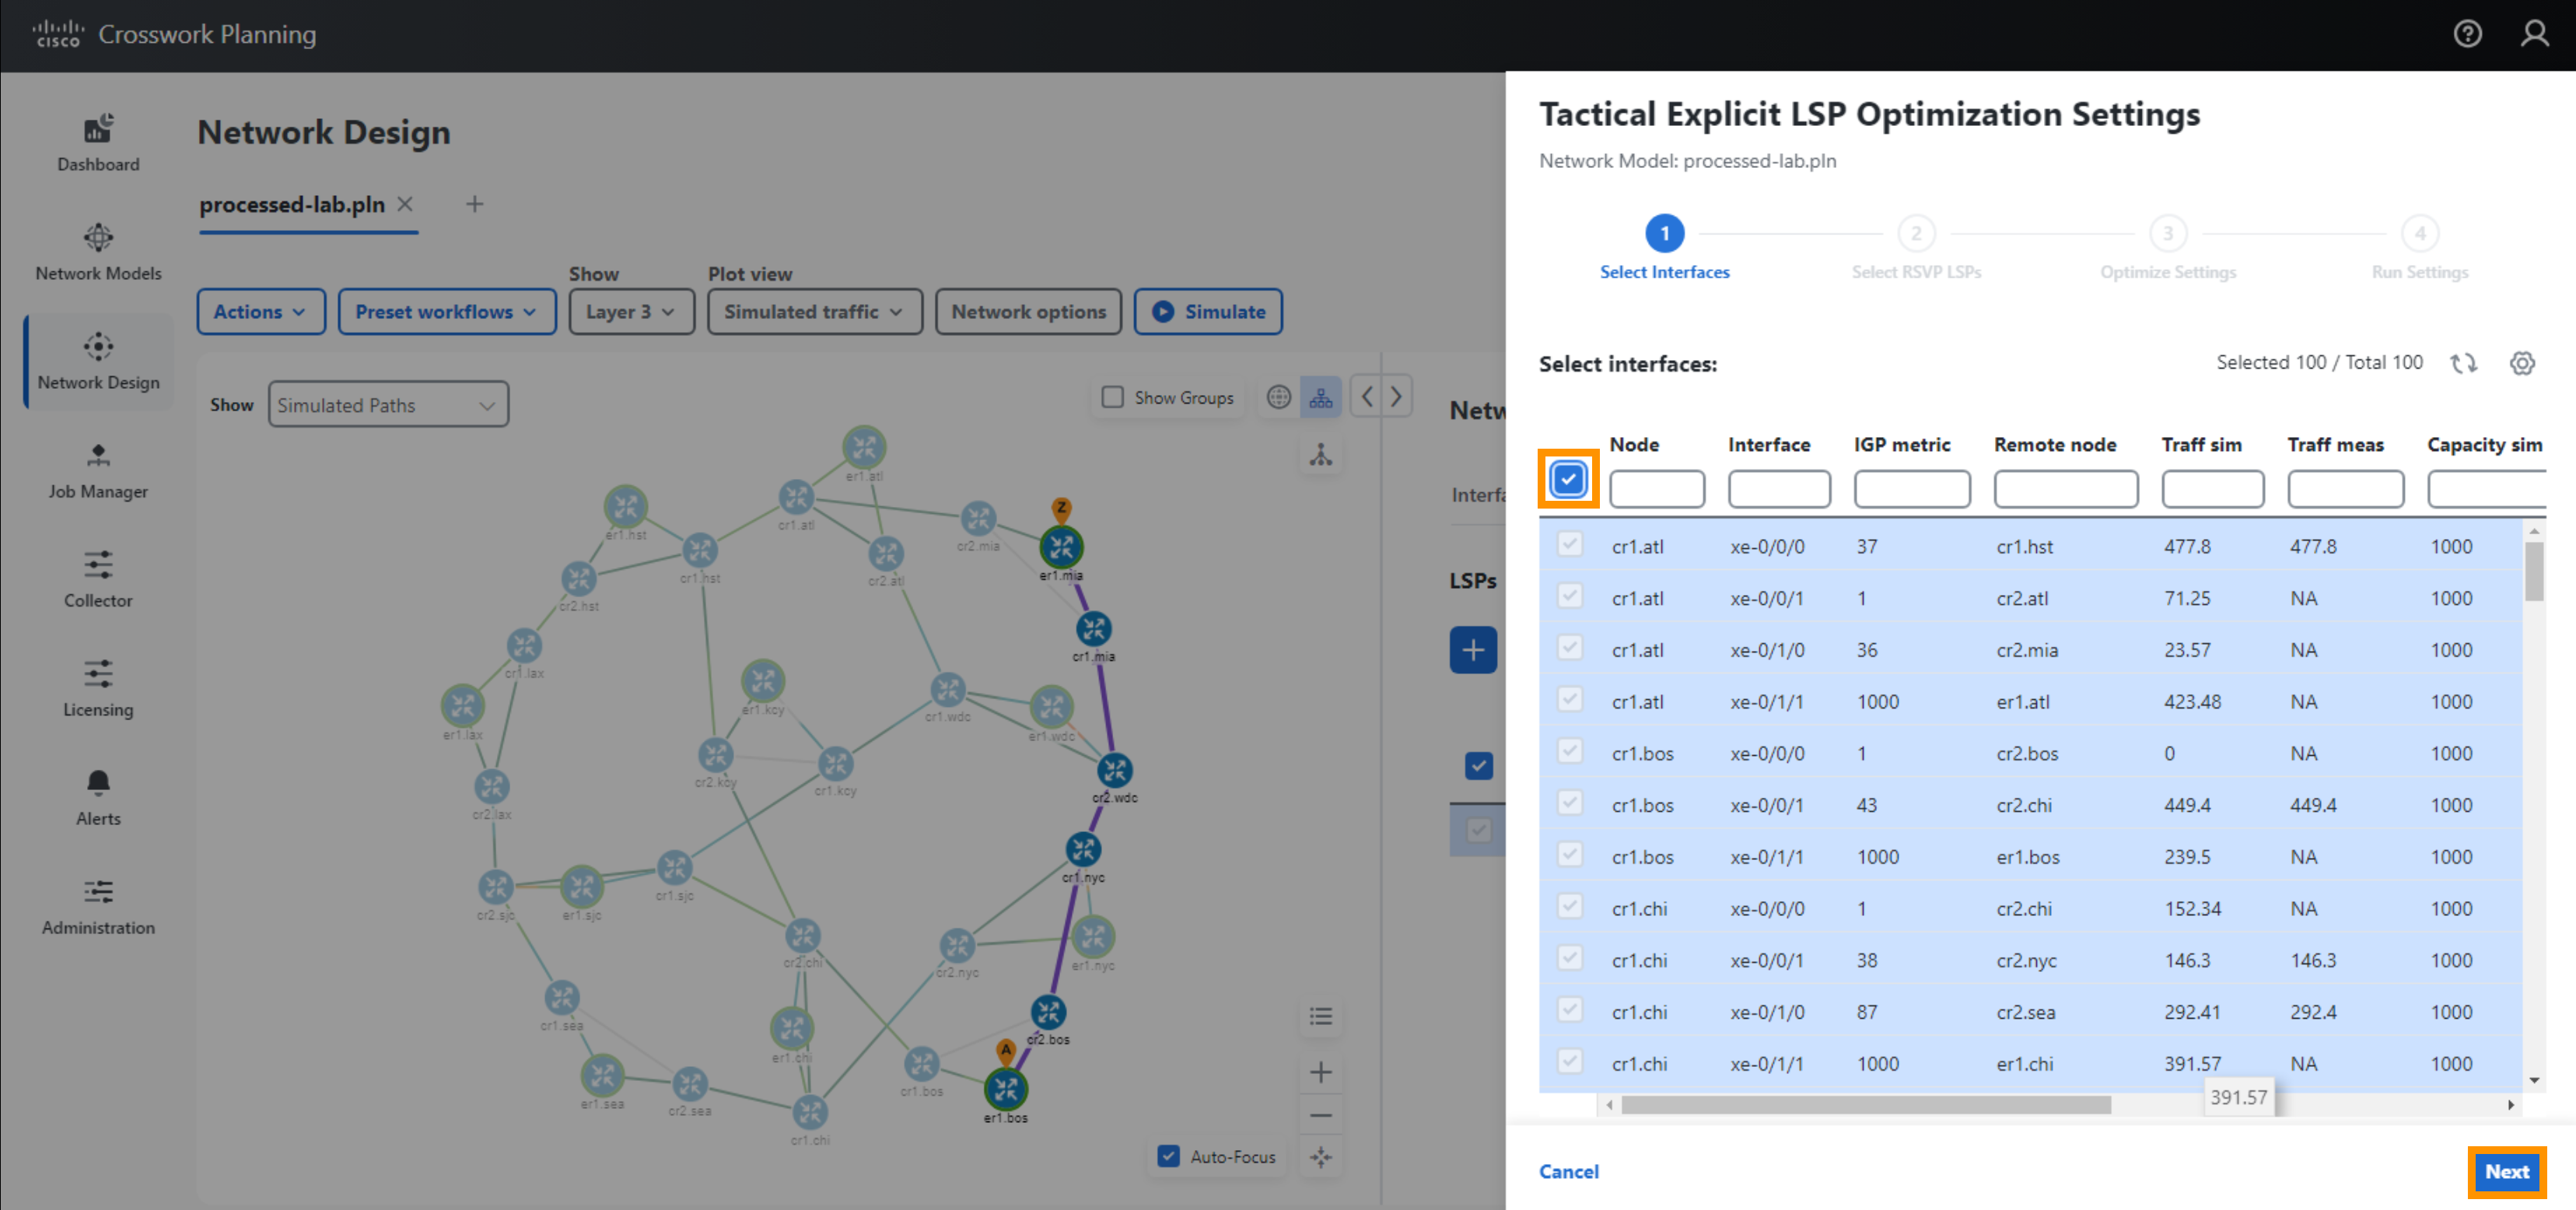
- Select All interfaces, select Next
- Select the LSPs you want to optimize (the LSP should be selected)
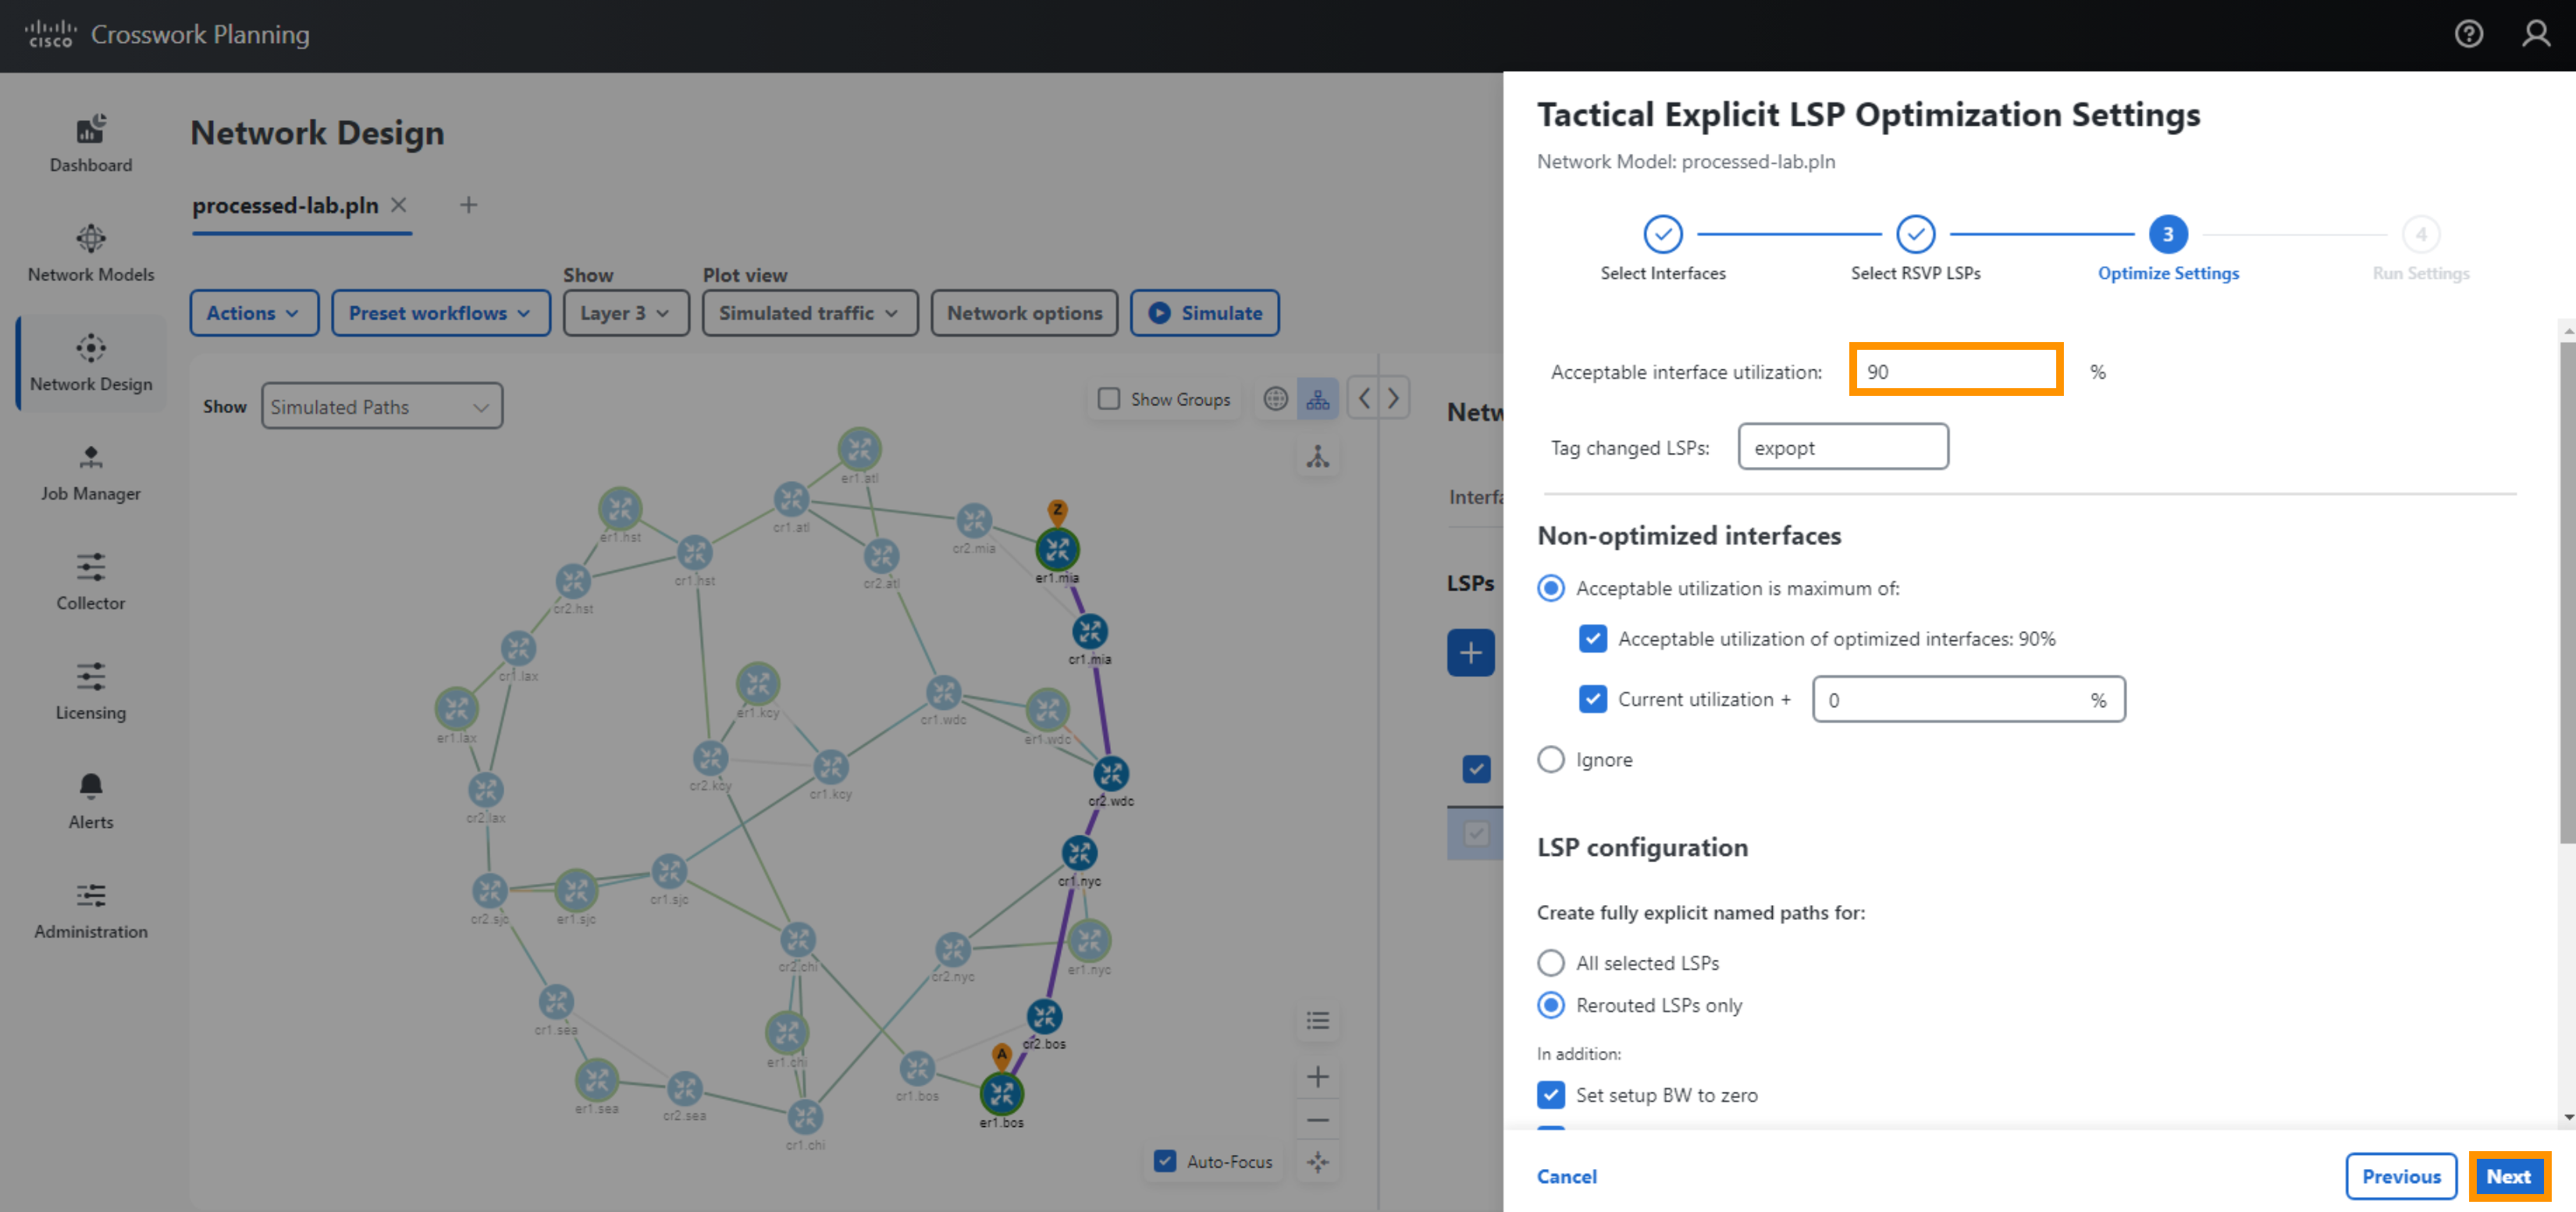
- Set Acceptable Interface Utilization %: 90 (leave the rest of the parameters as default), Select Next
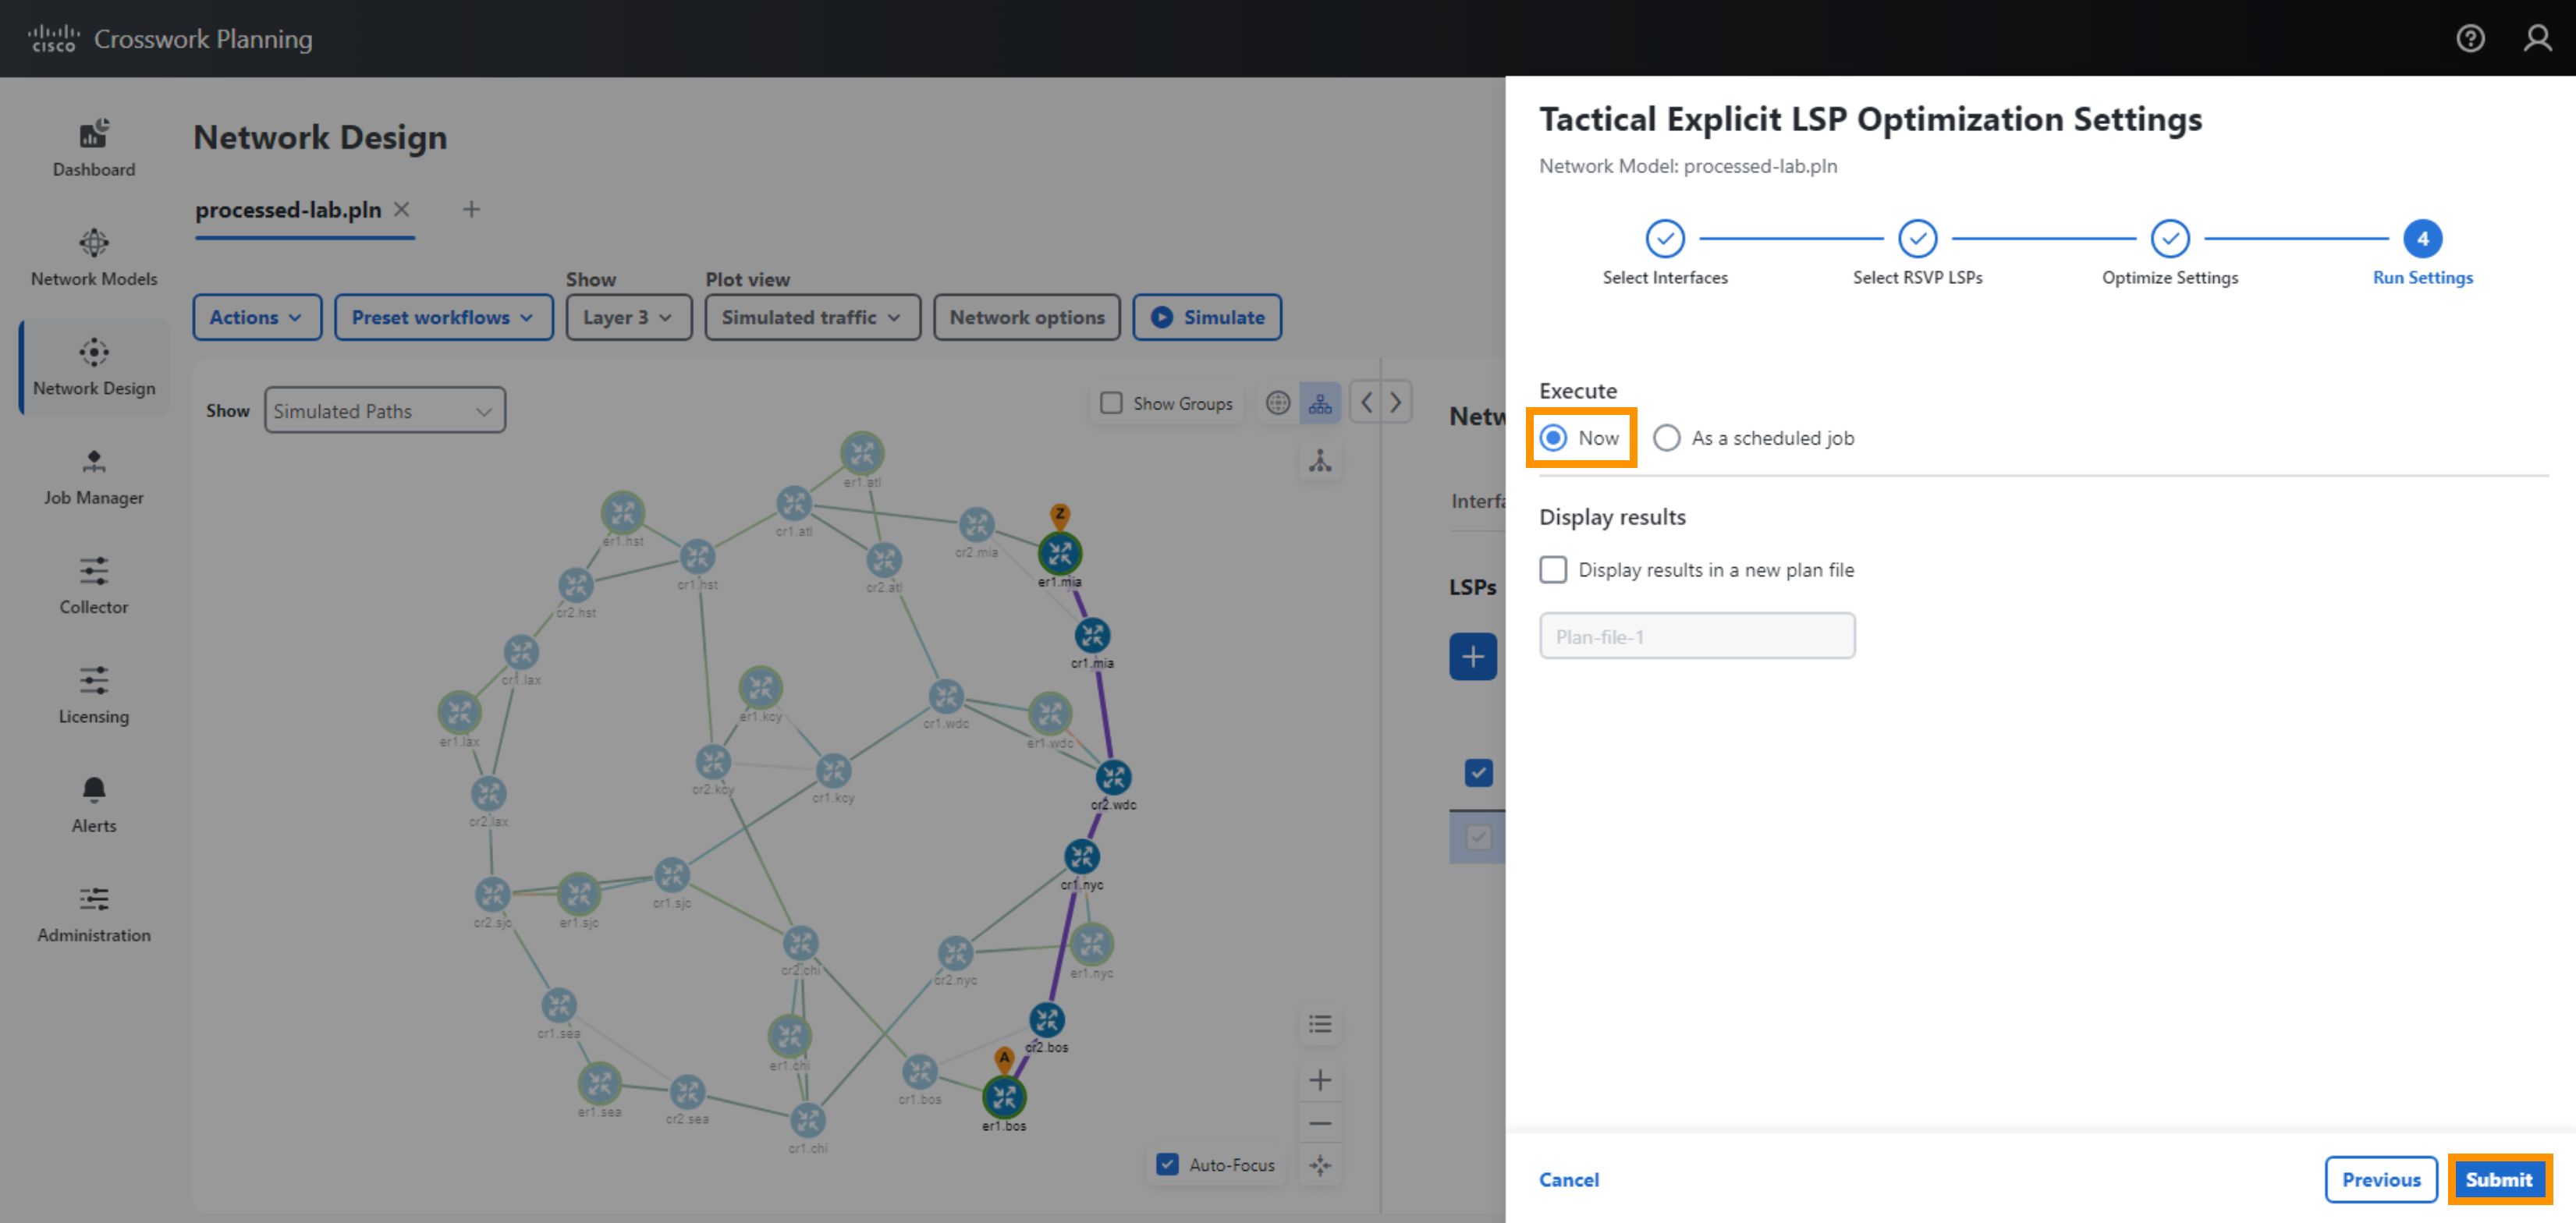
- Select Execute Now. Close the Report for Tactical Explicit Optimization.
- A new Network Model will be produced, In the new plan select the LSP in the LSPs property table to observe the new path
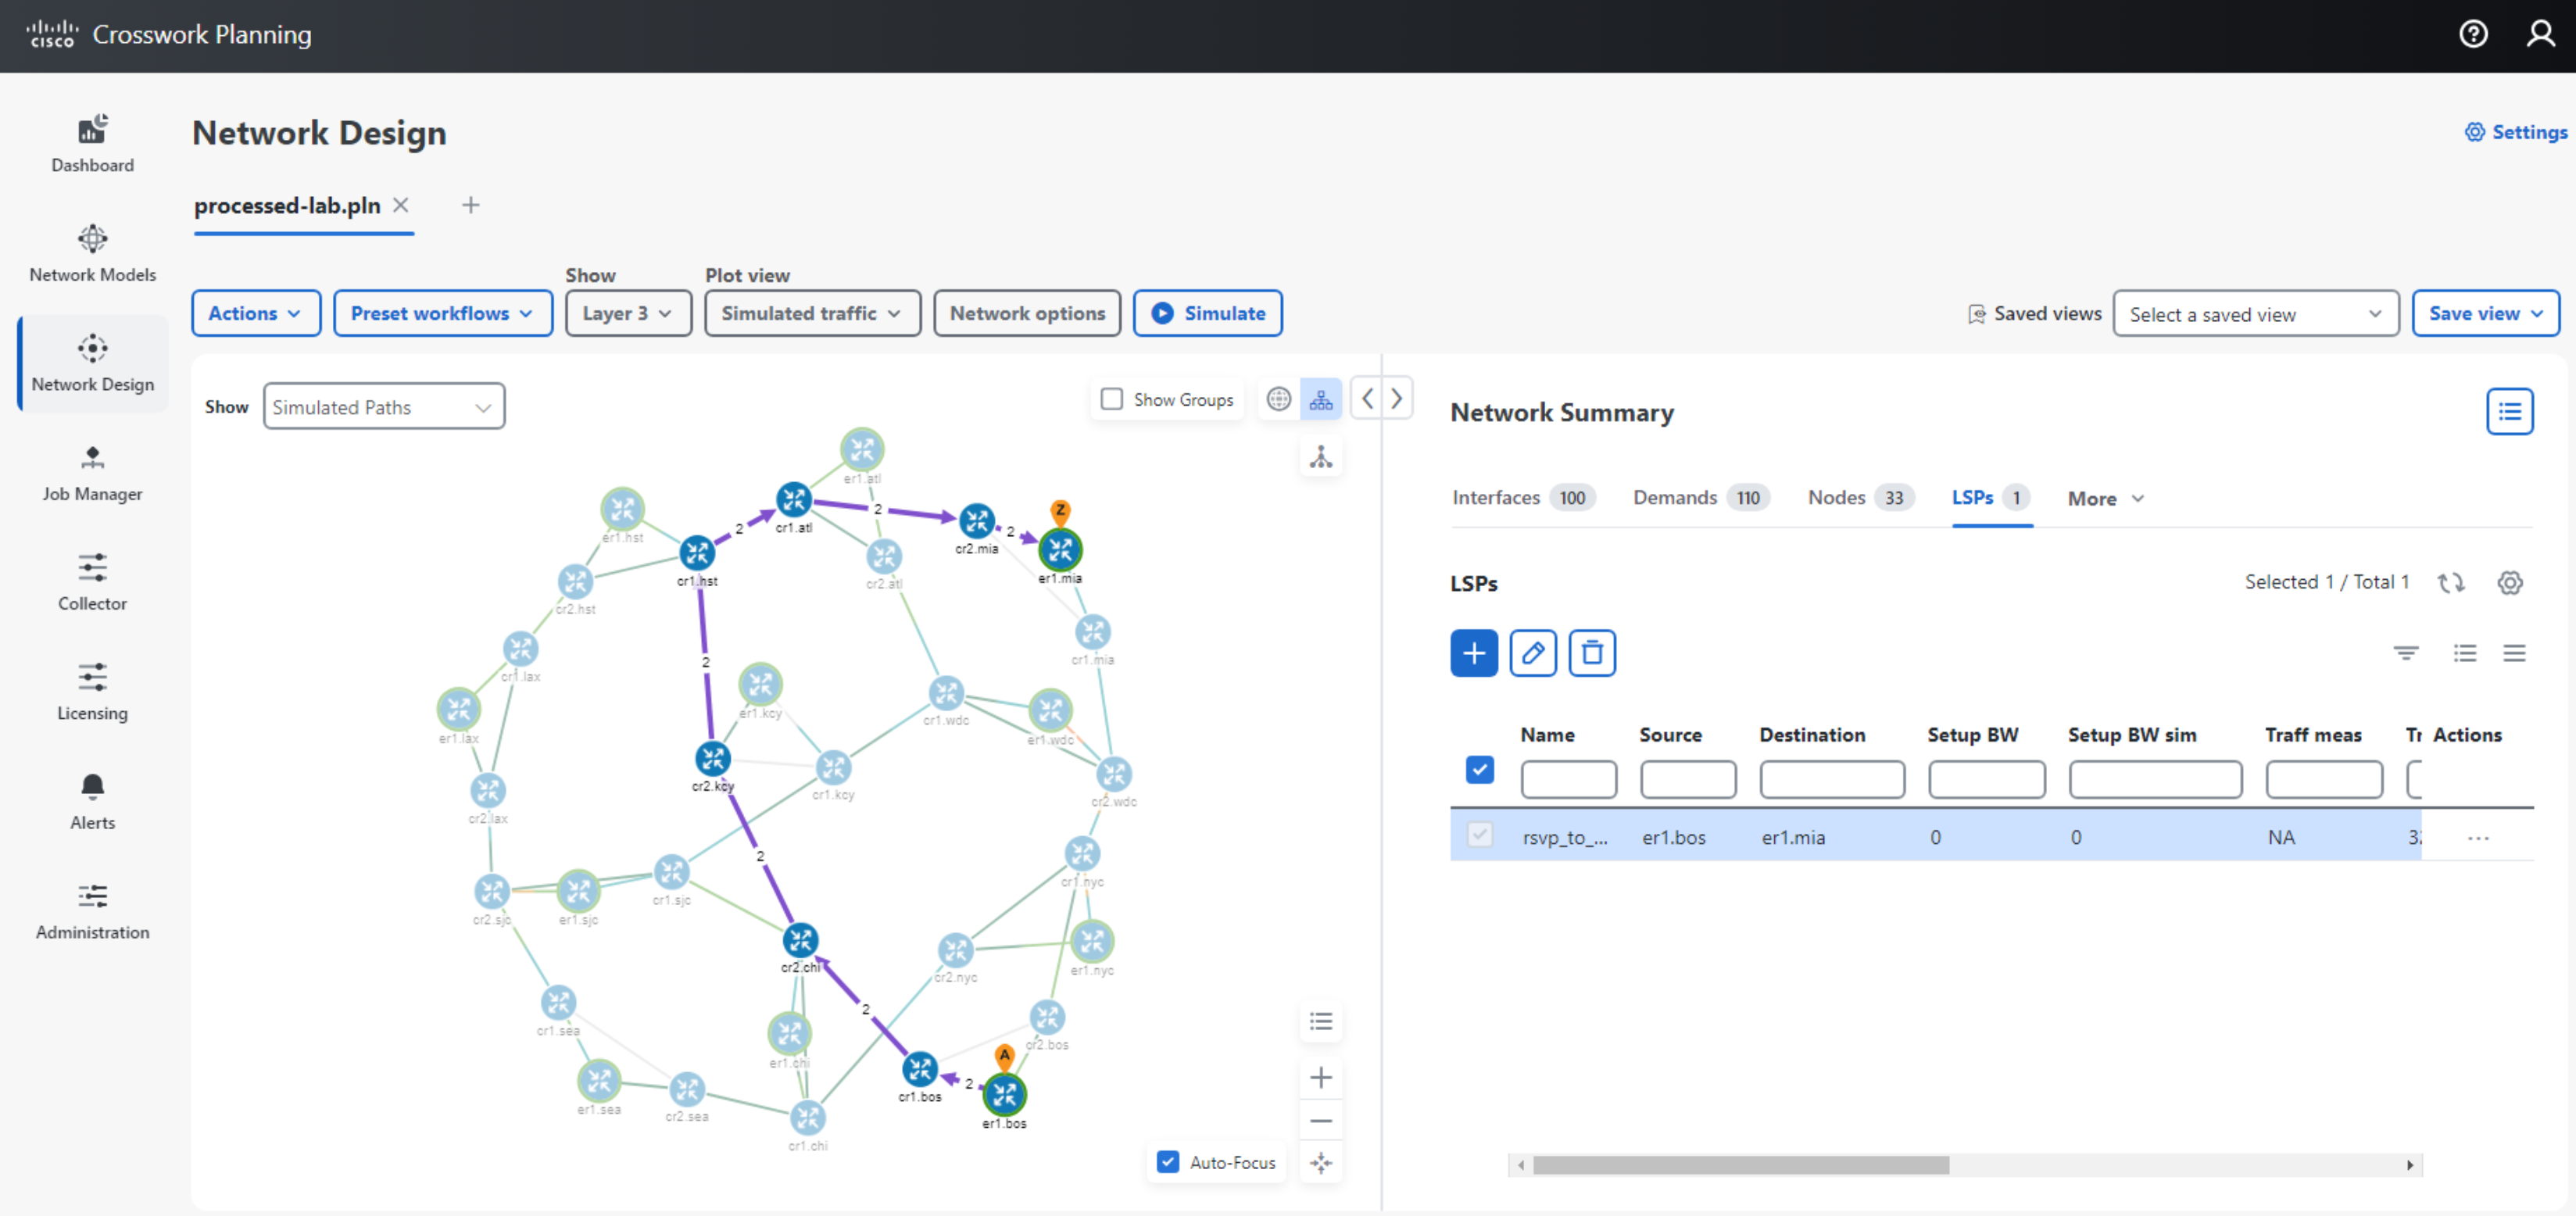
- Delete the added demand and LSP to prepare for the next exercise.
Capacity Planning with Resiliency Analysis
[INFO] Make sure you have reversed any changes made in the previous step. Crosswork Planning Design does not have an “undo” function so you need to undo any changes manually. You can always re-download and open up a copy of the model using the button below the heading “What Can You Do With a Network Simulation”.
You have simulated the impact to the network of a circuit failure. In Design you can also simulate what happens if a node, srlg, lag or a site were to fail. If you were to go through each element one by one, you would get a “worst case” view of where you are most at risk of congestion and you would also get a view of the failures that case the worst case, the “failure impact”. Crosswork Planning Design has the Simulation Analysis tool to automate this process and provide that analysis.
Step 10 Capacity Planning with Resiliency Analysis
- Run Simulation Analysis
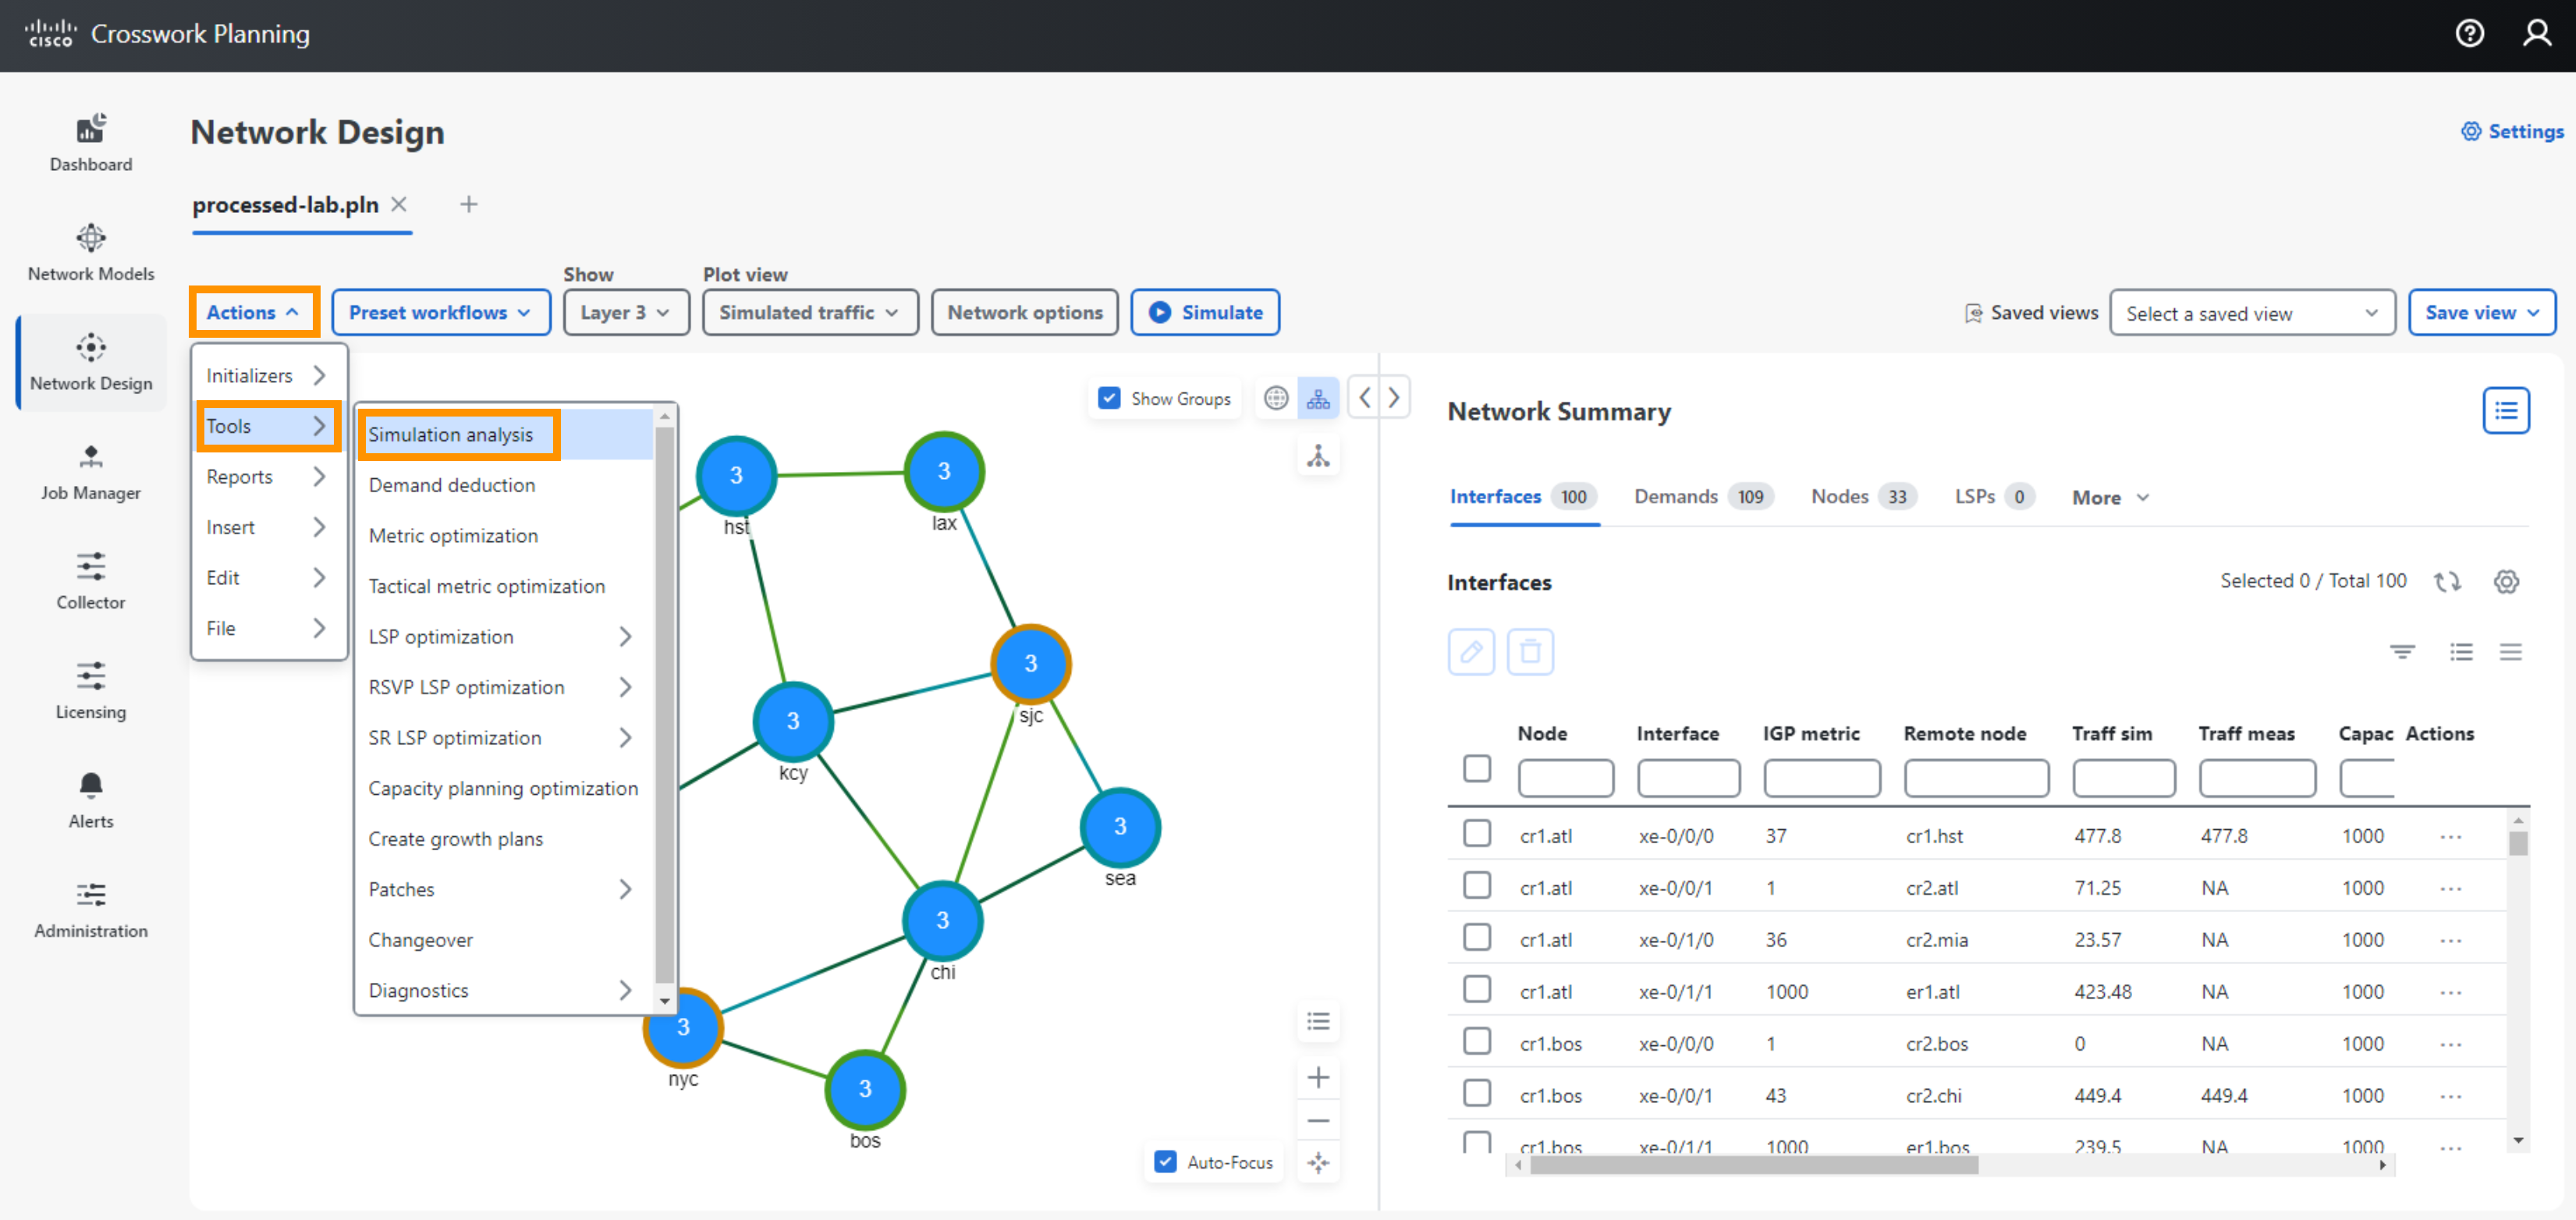
- Select Actions > Tools > Simulation Analysis
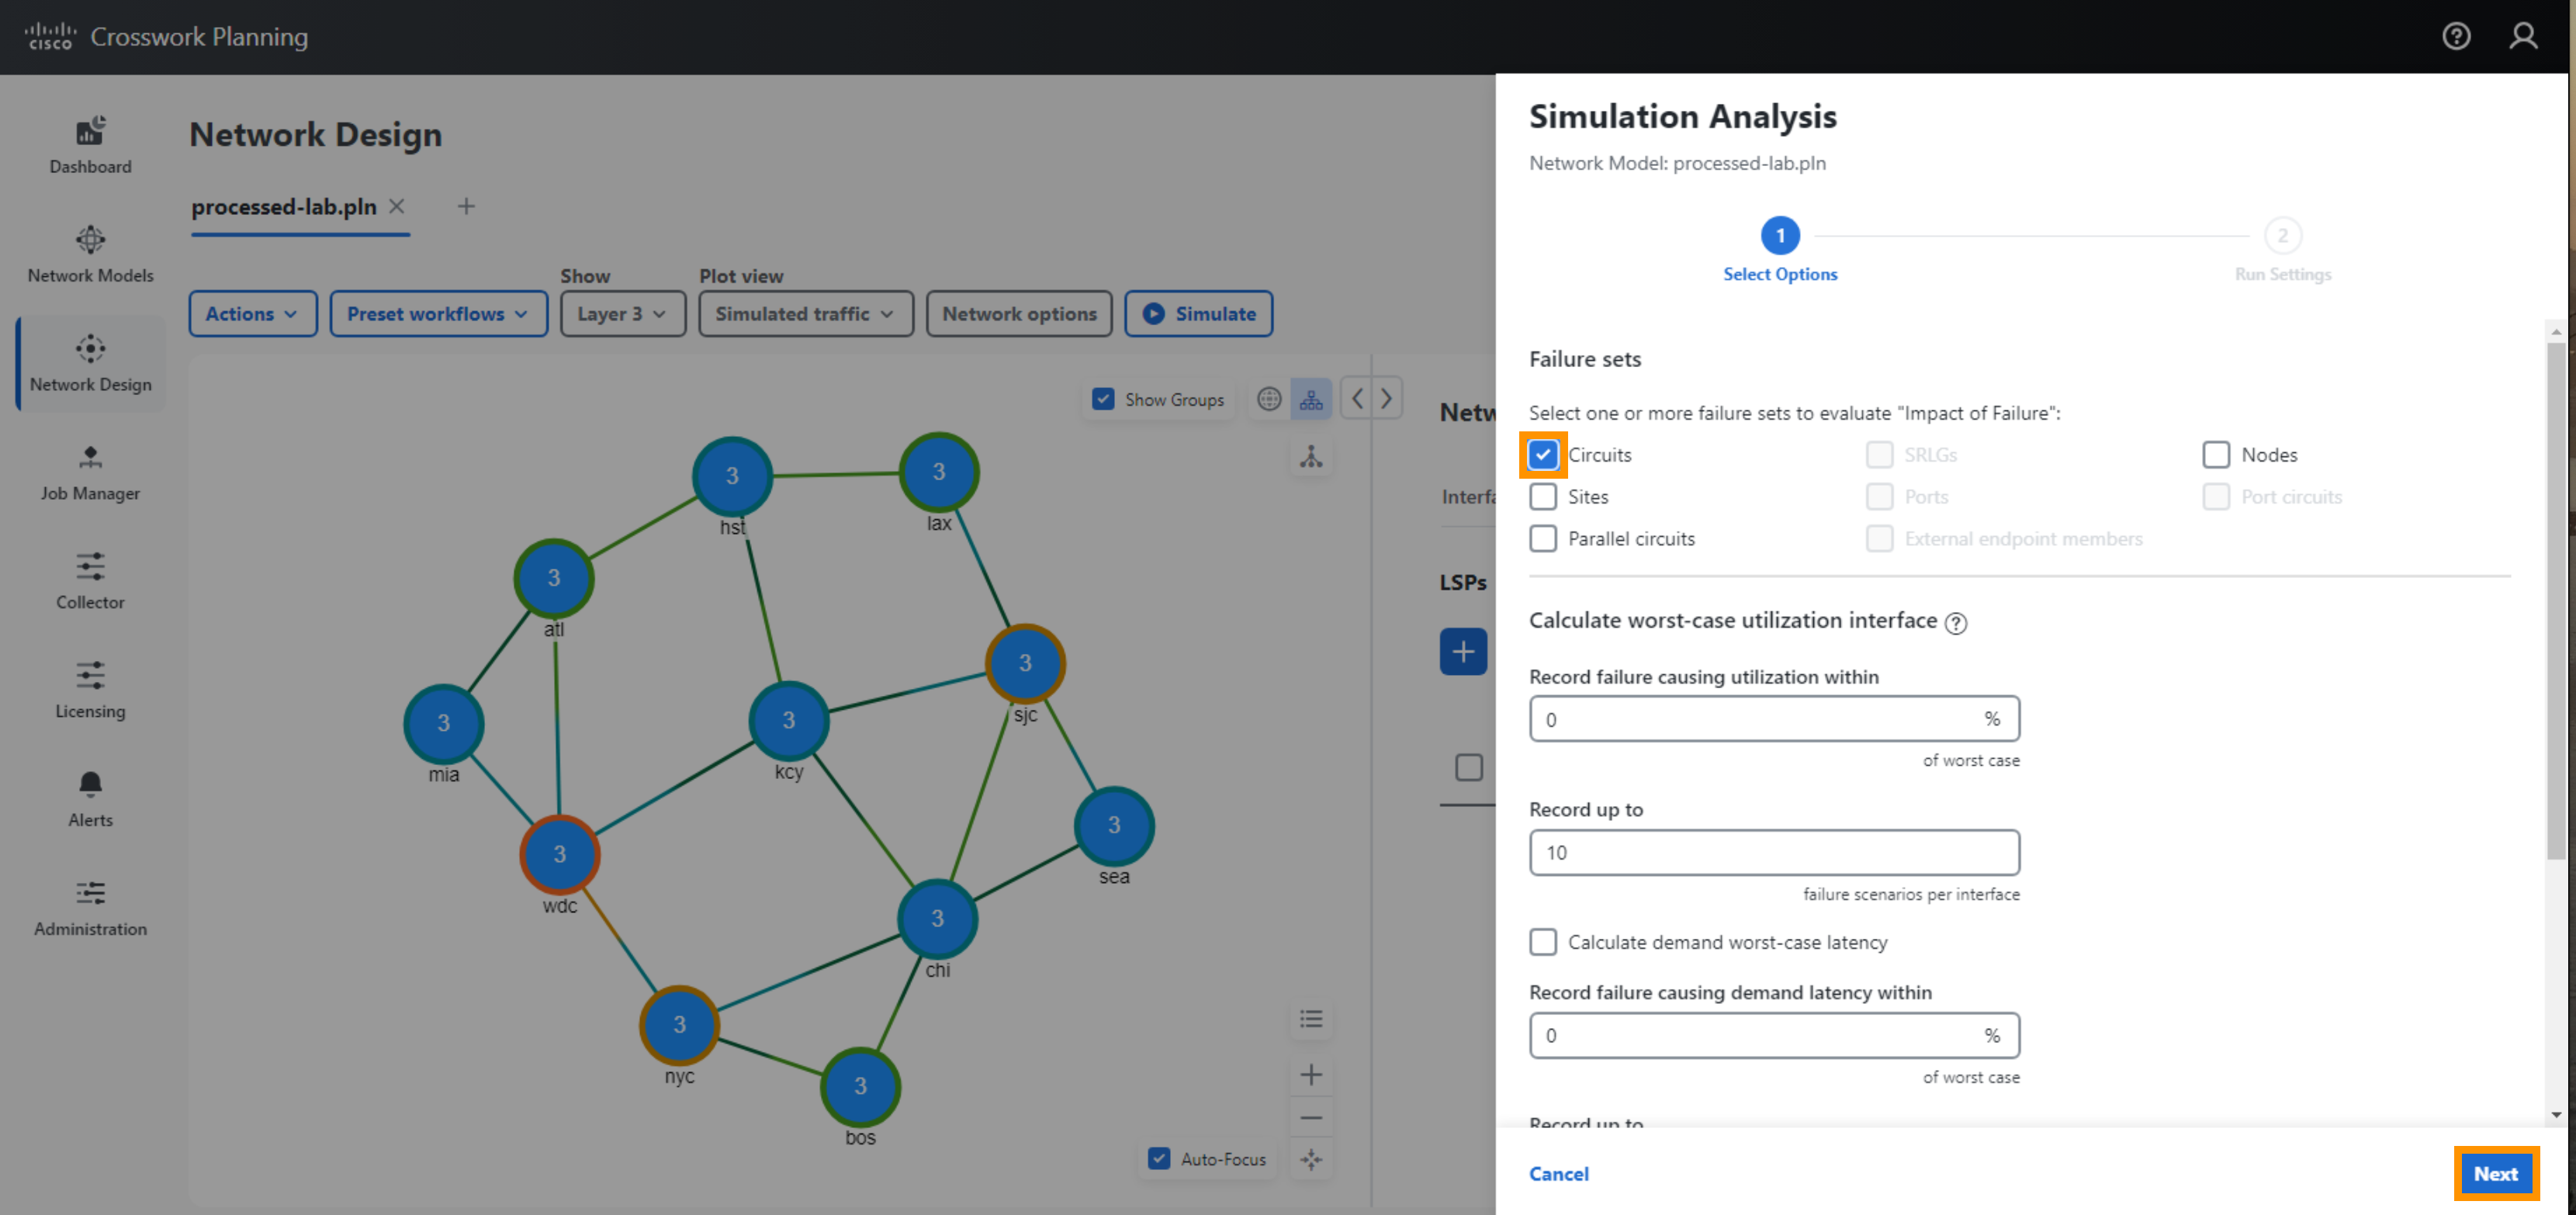
- Select Circuits to have the tool simulate one-by-one each circuit failure, select Next
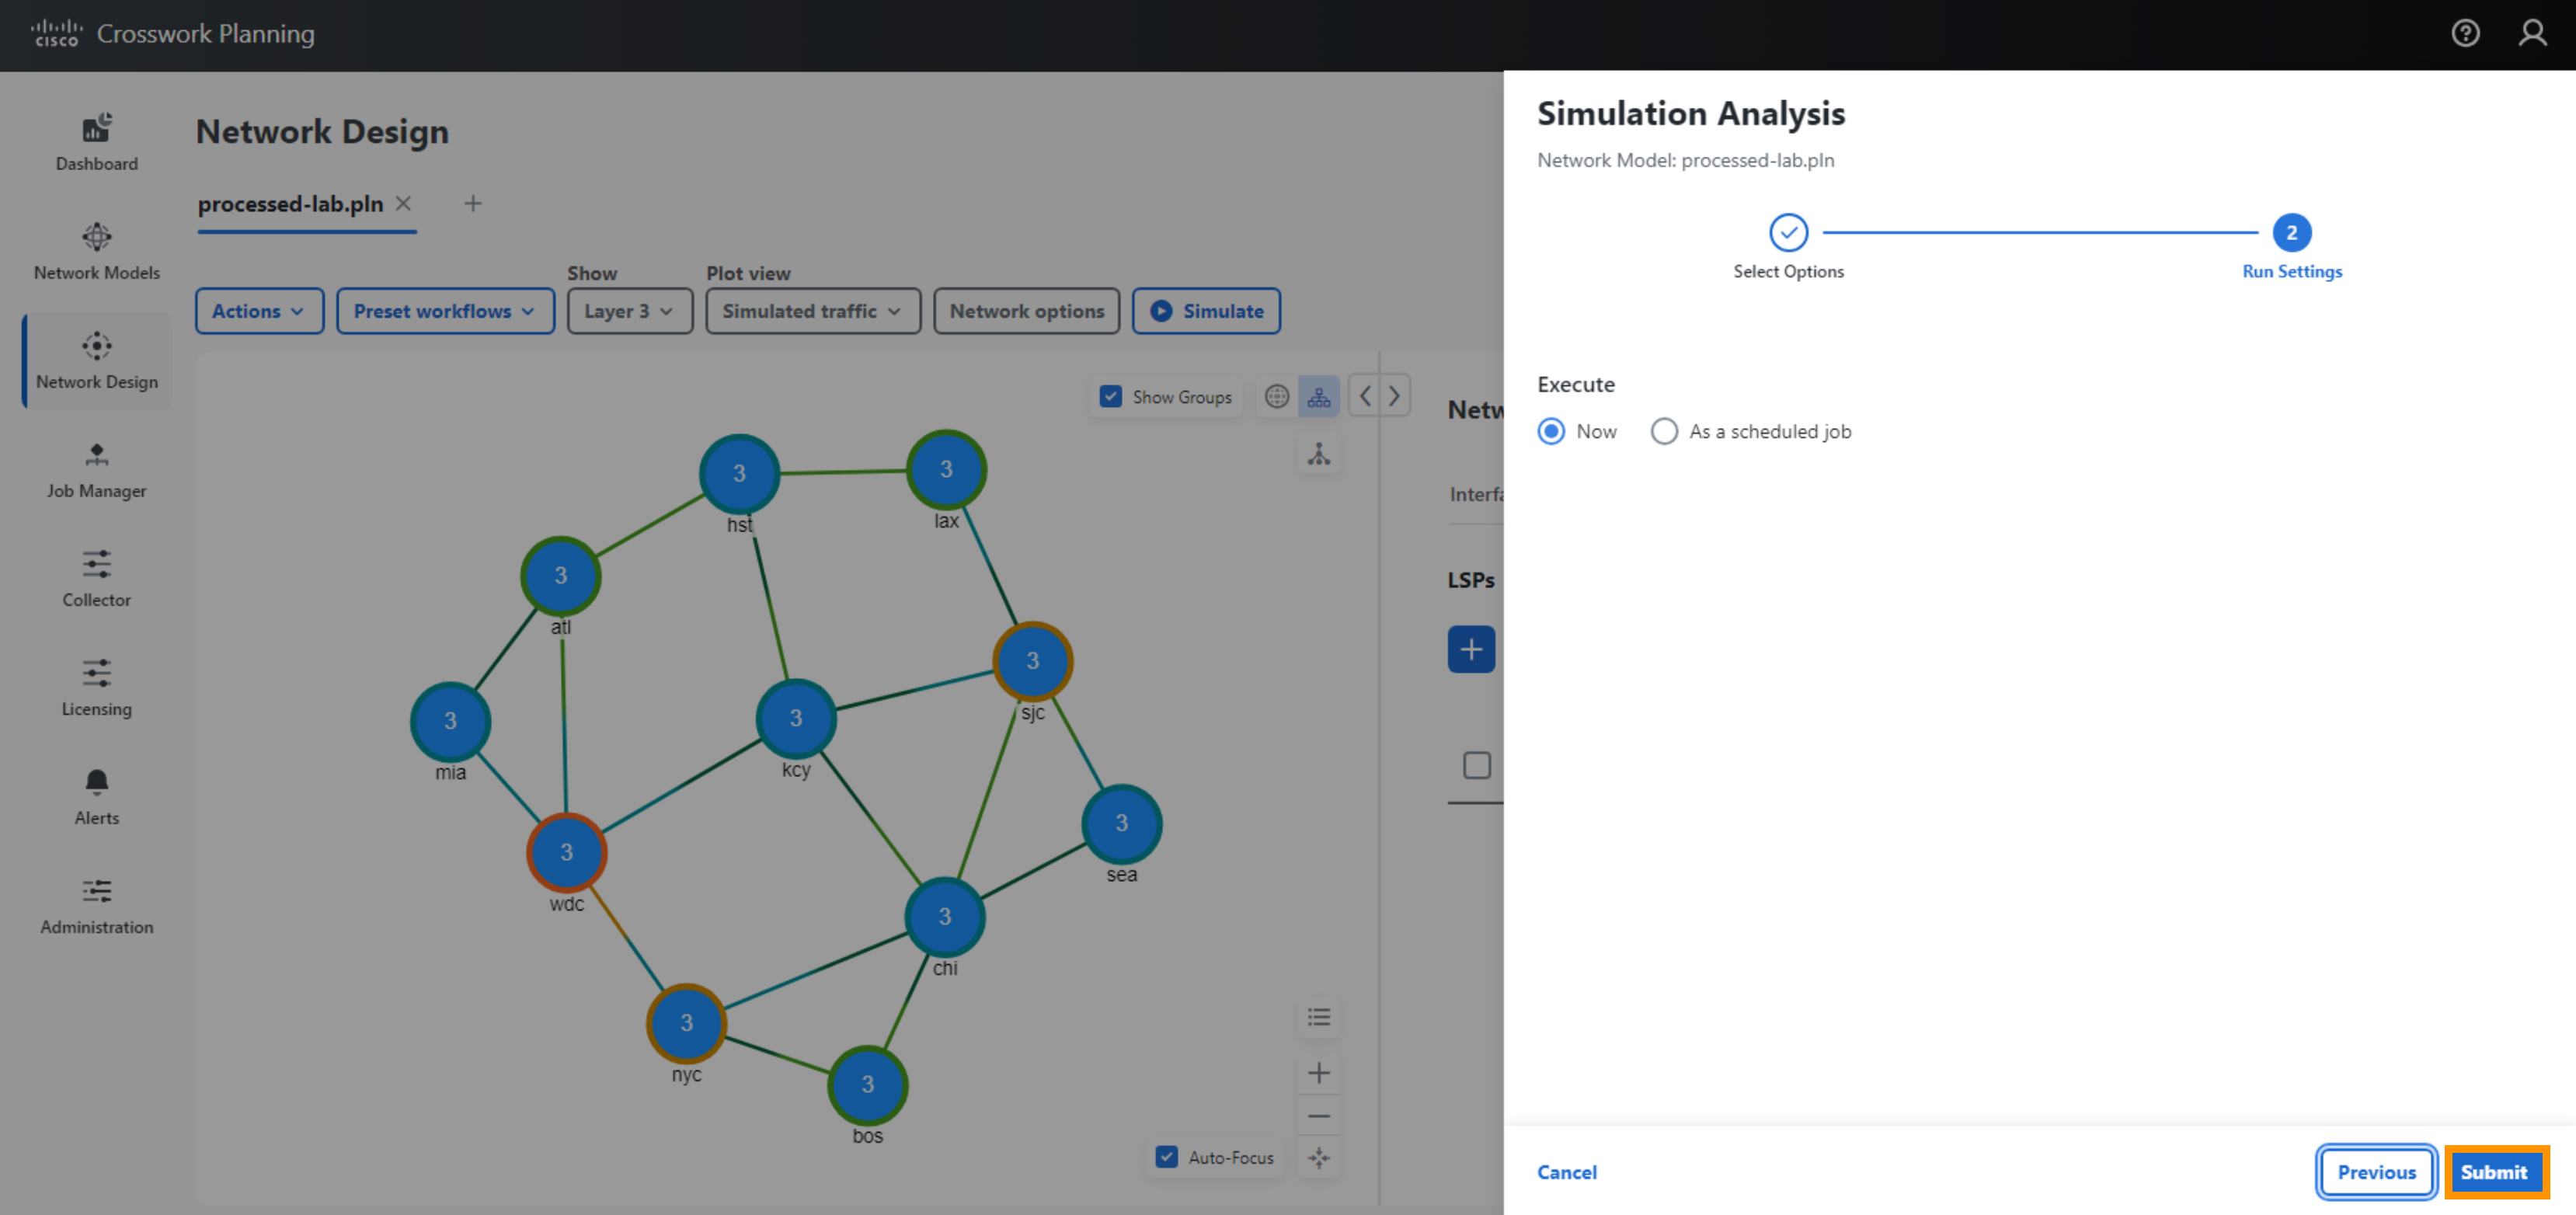
- On Run Settings, select Execute Now and select Submit
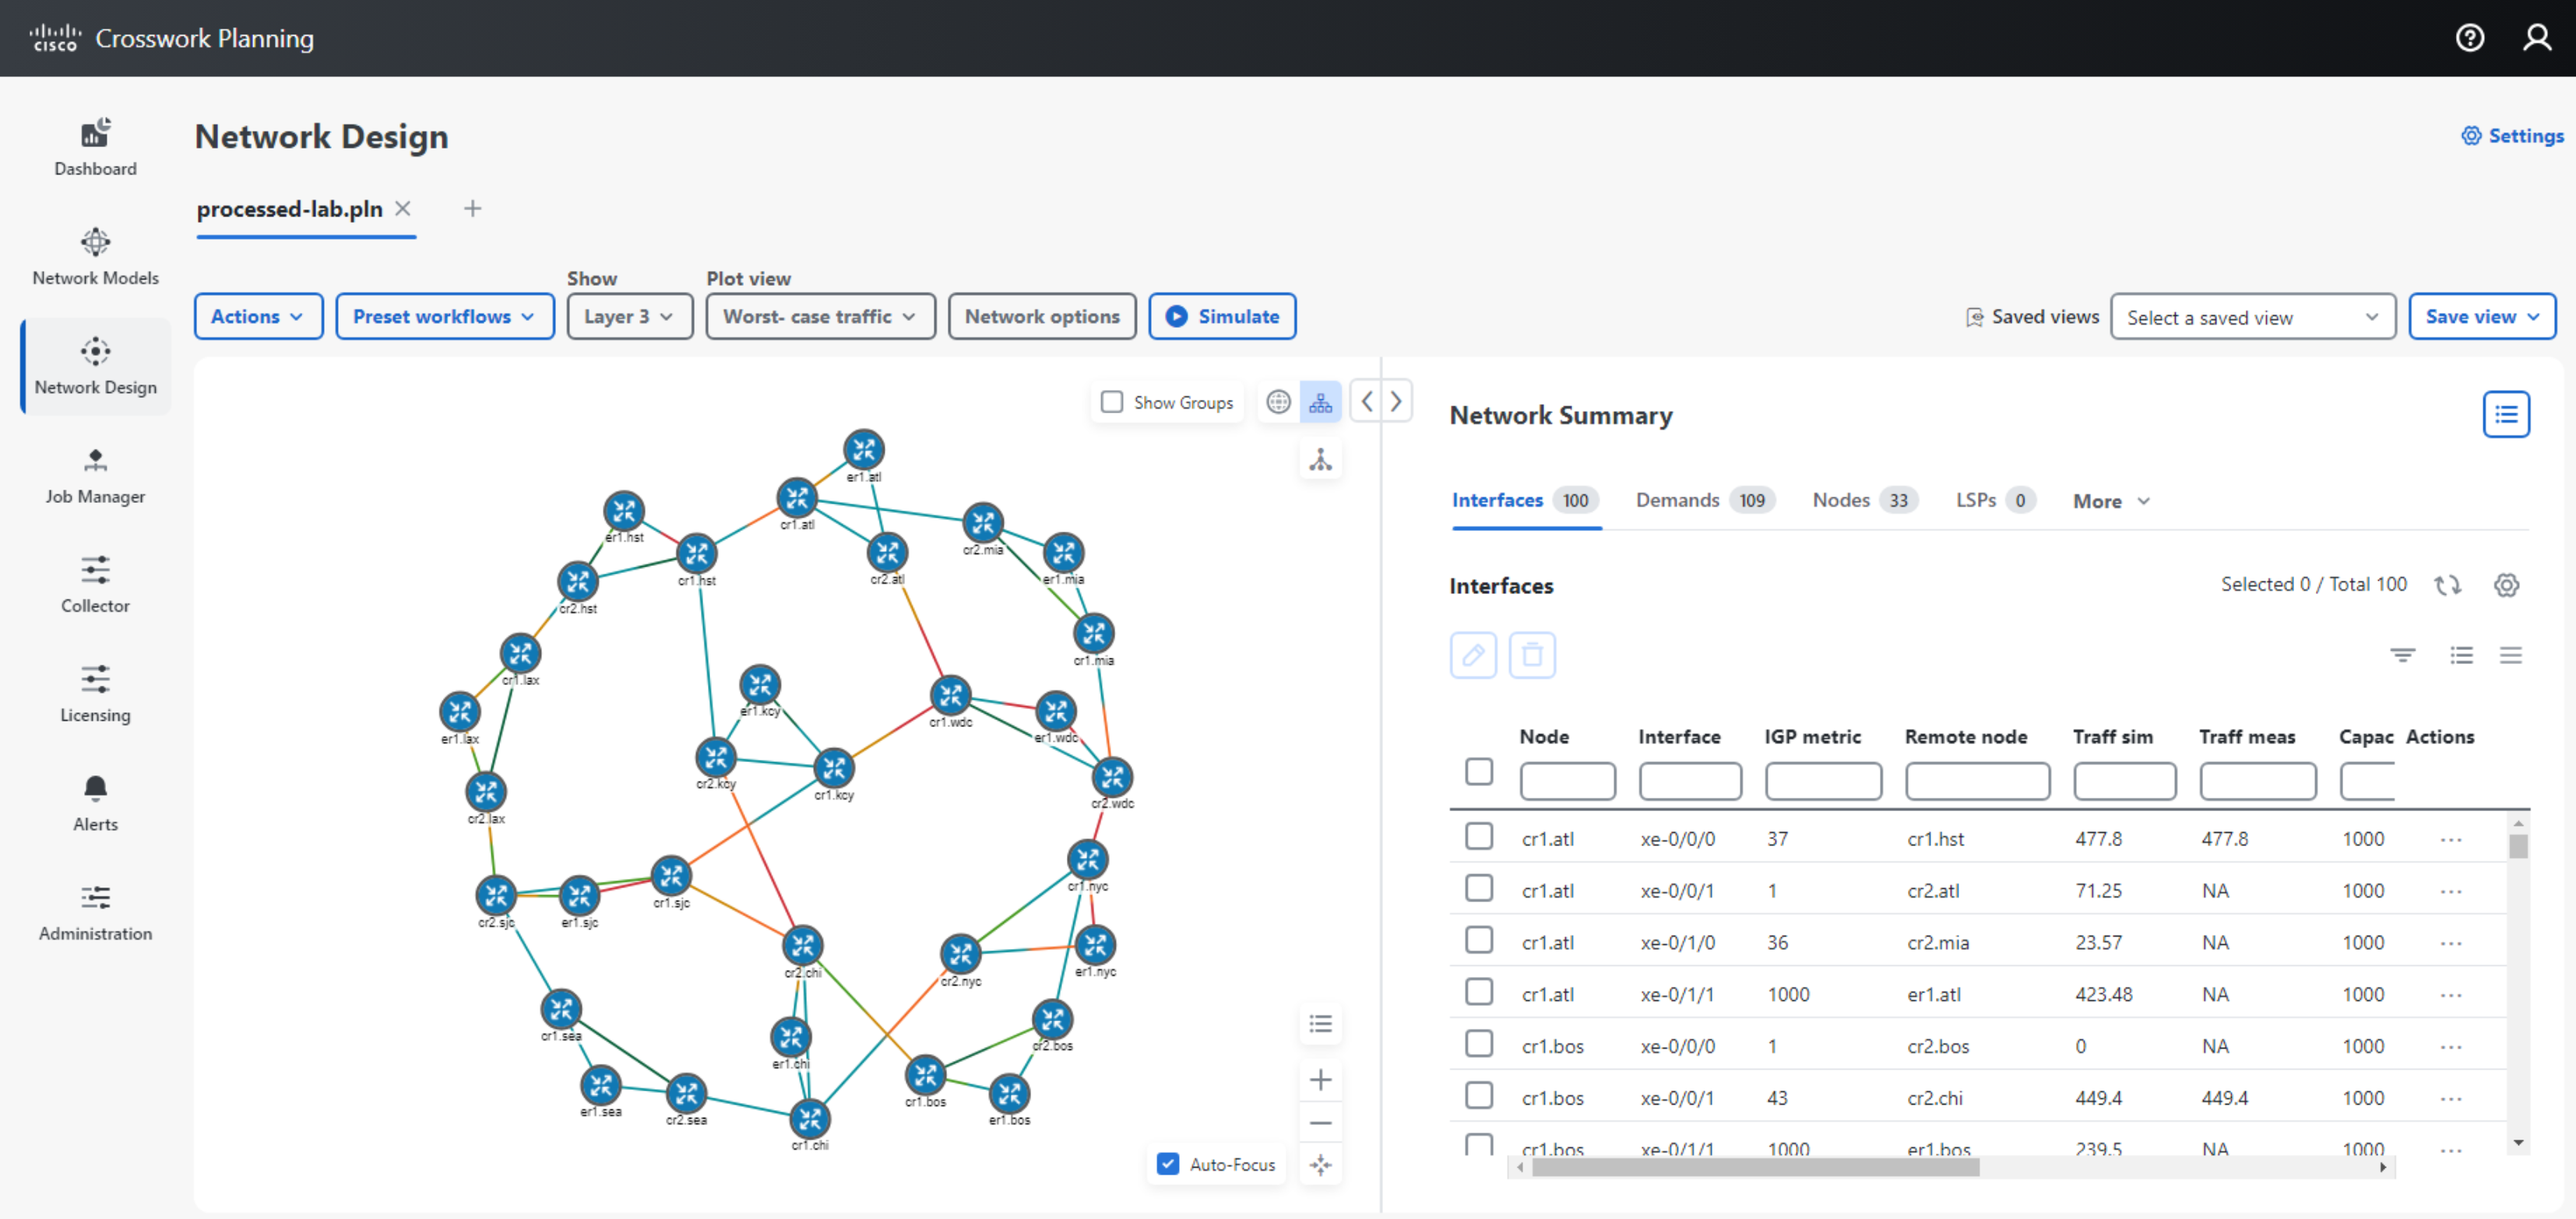
After Simulation Analysis has completed running, a report will be generated. Close the Report.
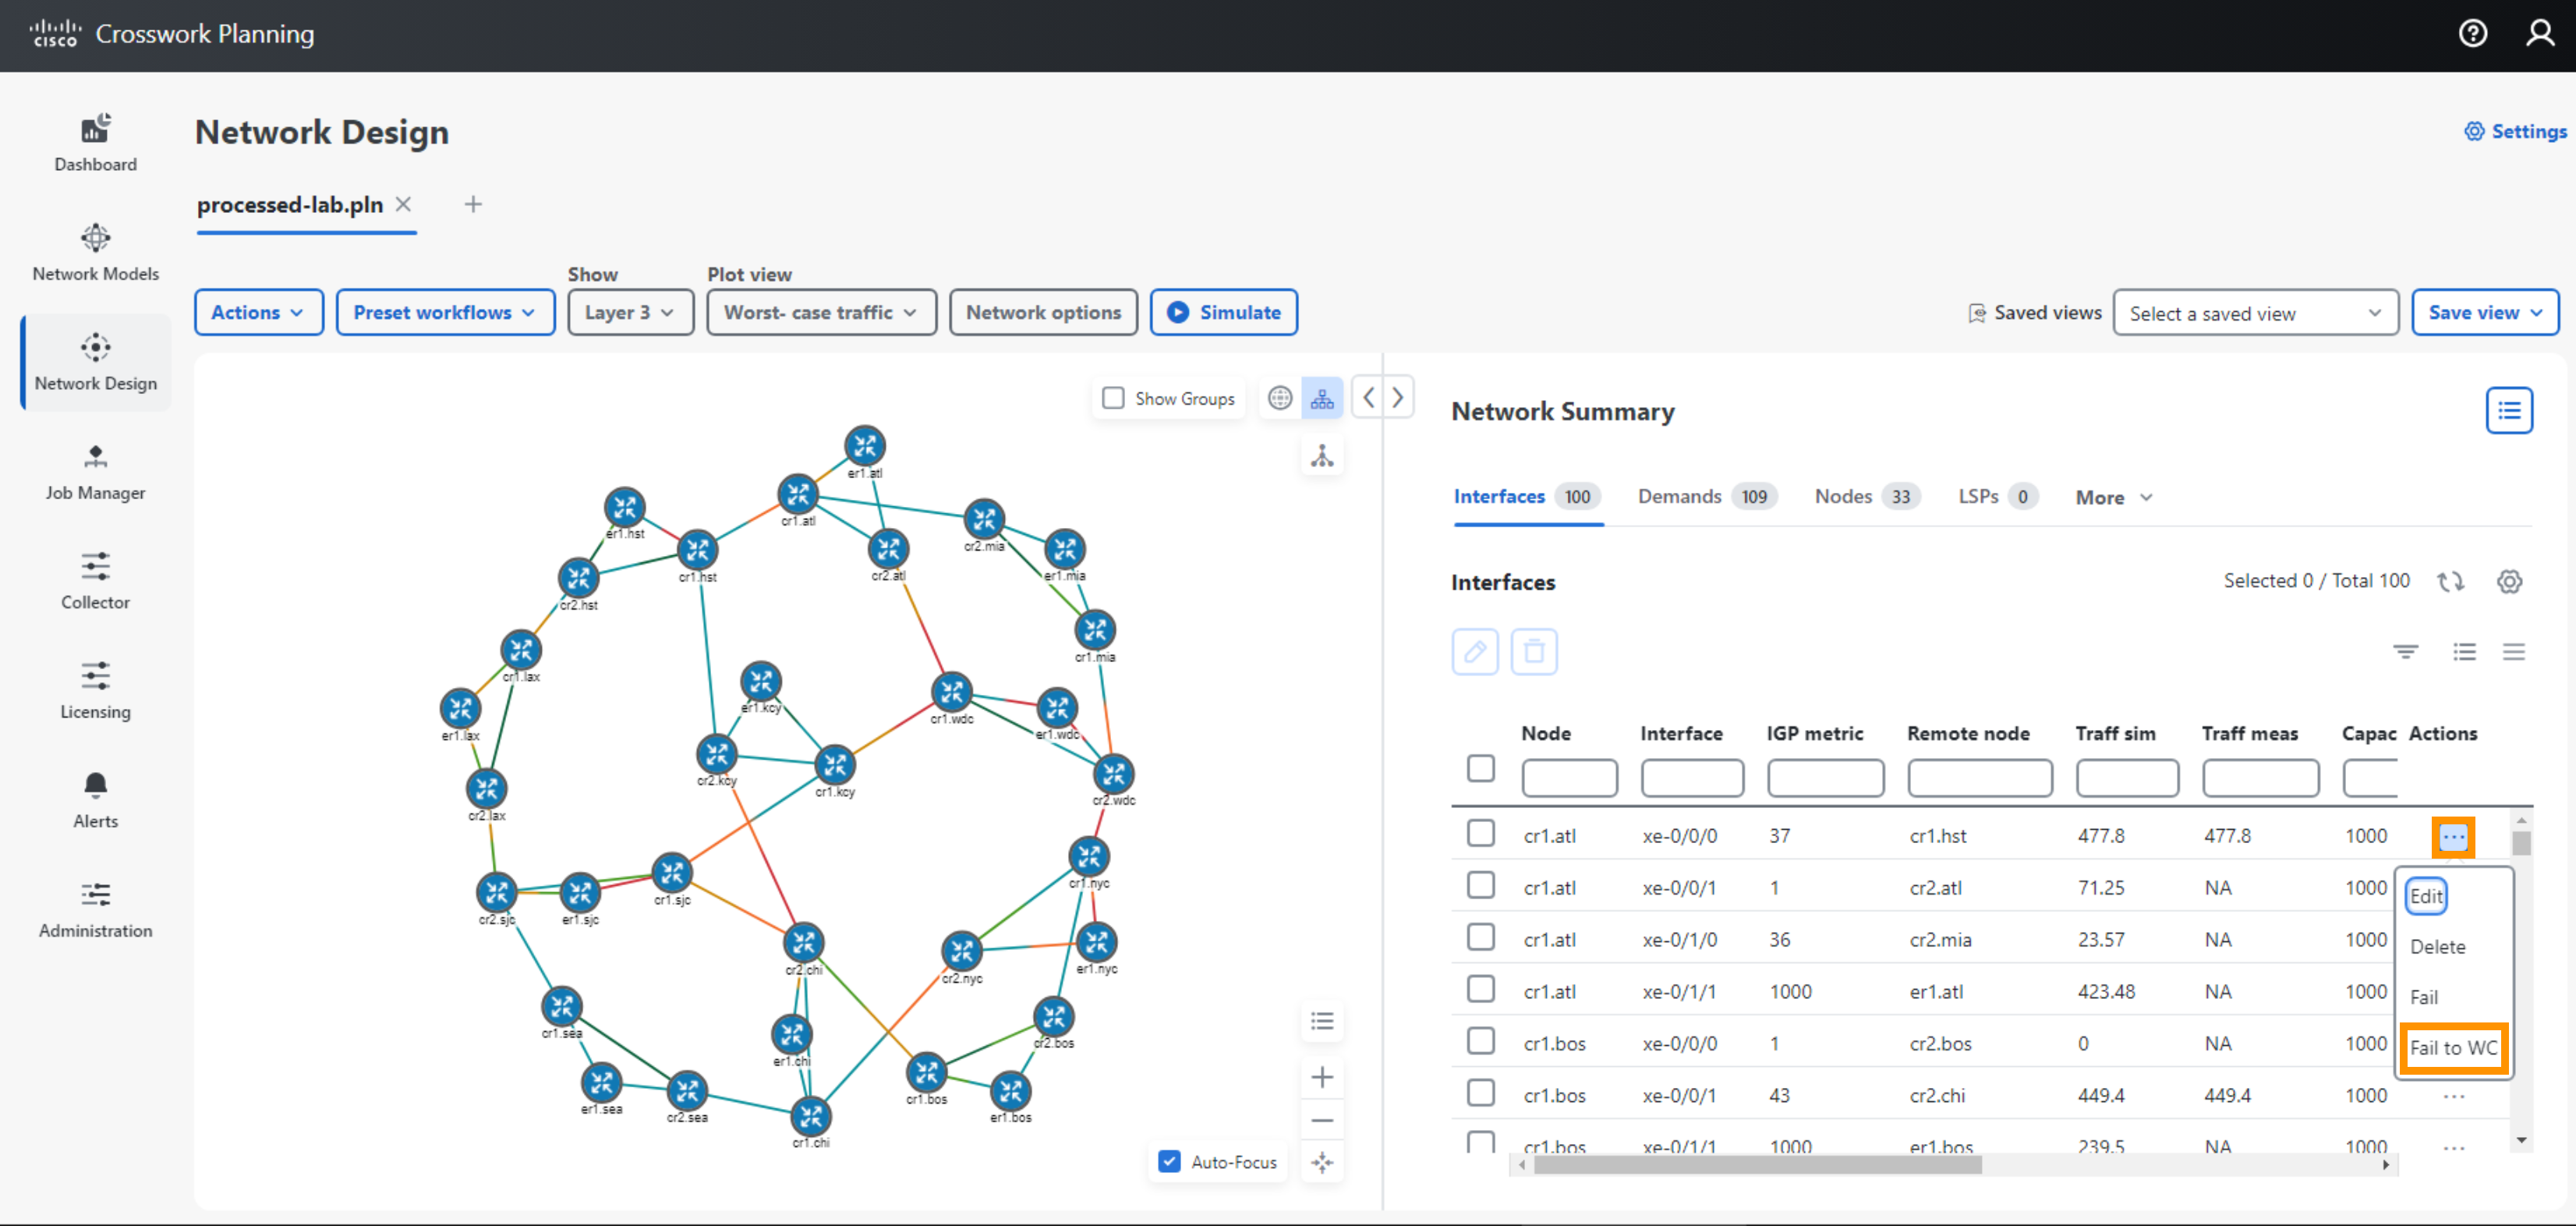
- Examine the Worst Case Traffic
- From the top left traffic view, select “Worst Case Traffic”
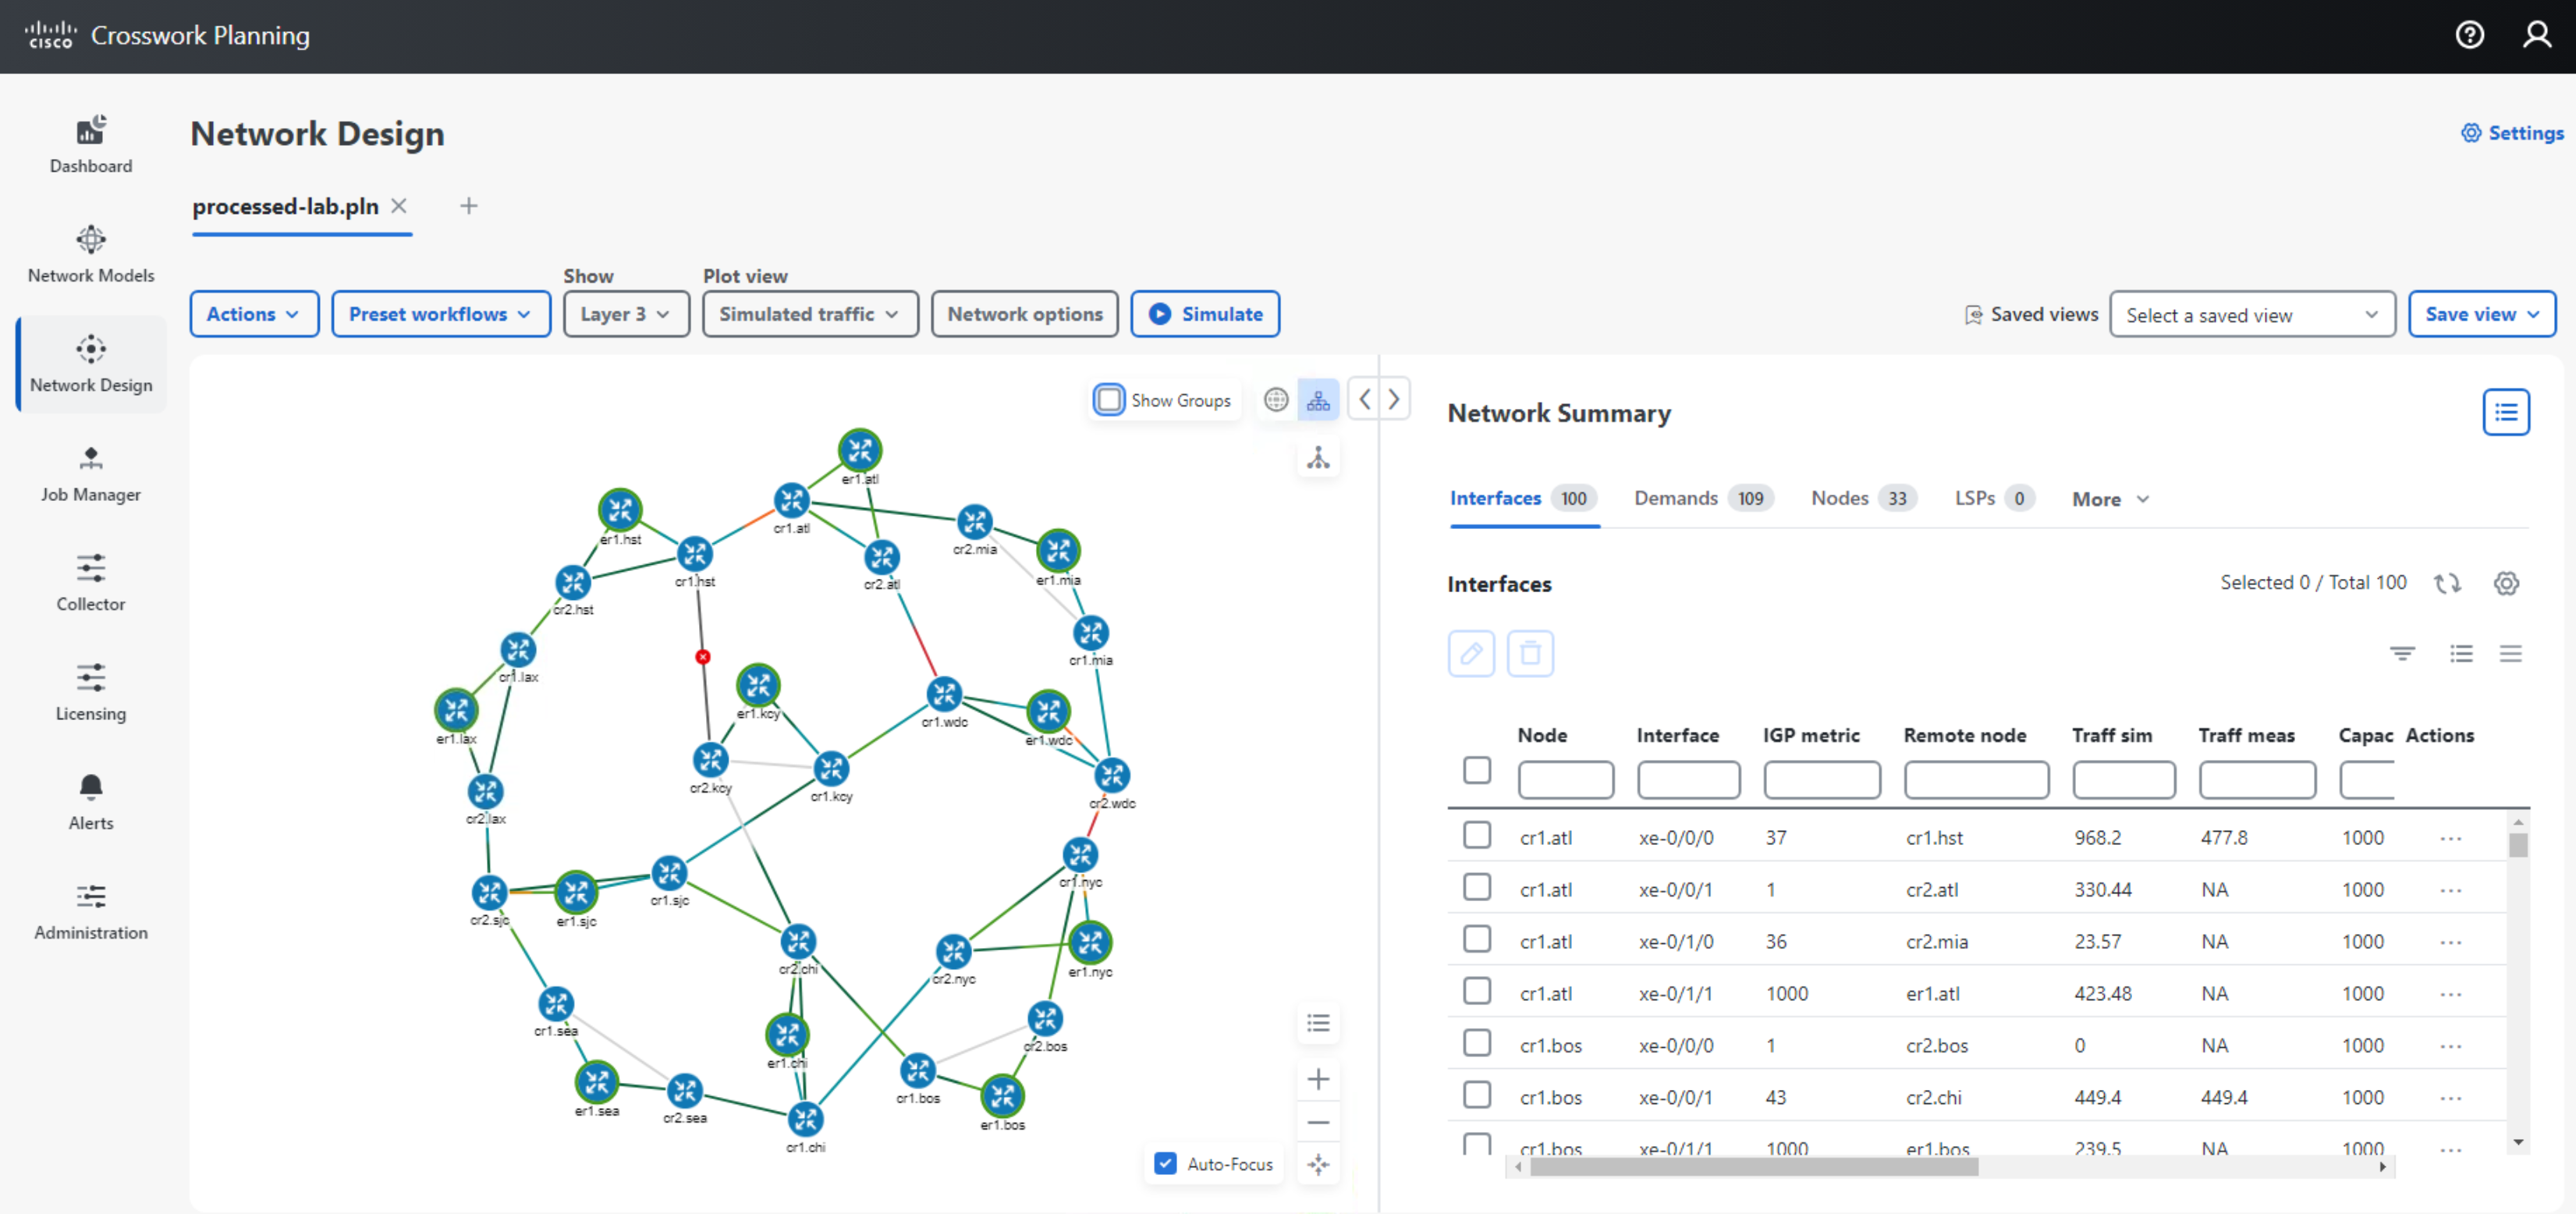
- To see a failure that cased the worst case, on the Interfaces table, select the an interface, under the Actions column select the ellipsis icon […] and select “Fail to WC”, you will be taken to the Simulated Traffic view of that failure. If there are more than one failure scenariow which leads the to worst case traffic, you will be prompted to select the failure scenario.
- Recover the failure by selecting the failed interface and selecting the ellipsis icon, “Recover”.
- Examine the Failure Impact
- From the top left traffic view, select “Failure Impact”
- This view shows the impact of any failure. A circuit colored purple means that if that circuit were to fail, some interface somewhere would be purple.
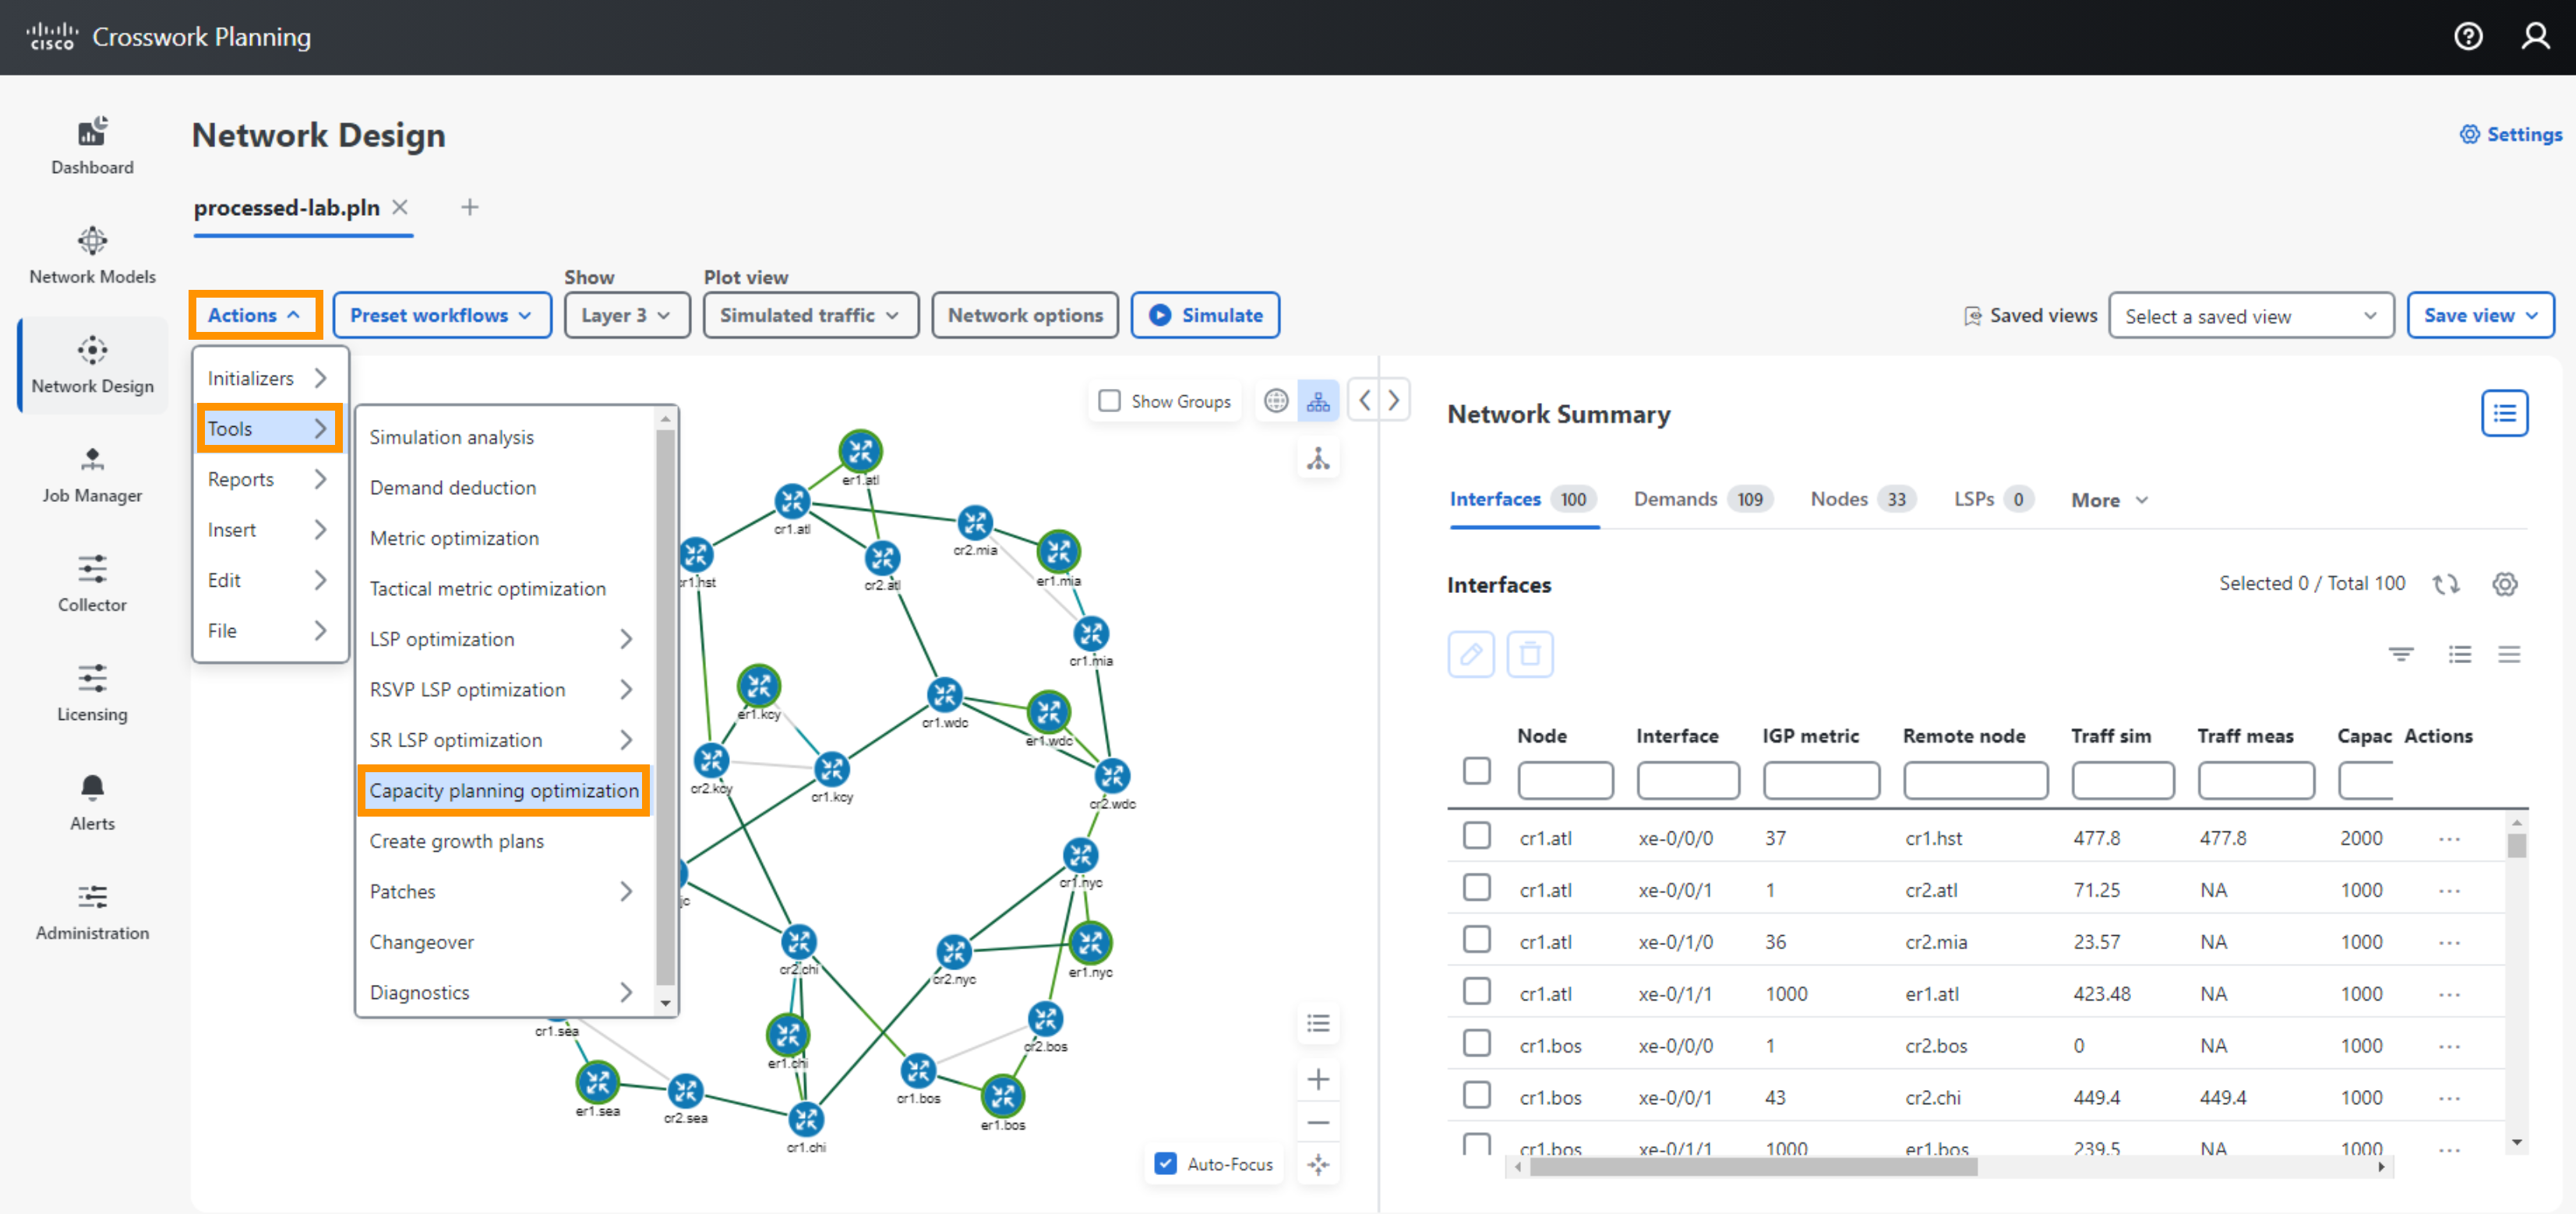
- Run the Capacity Planning Optimization Tool to determine how much capacity you need and where
- Select Actions > Tools > Capacity Planning Optimization
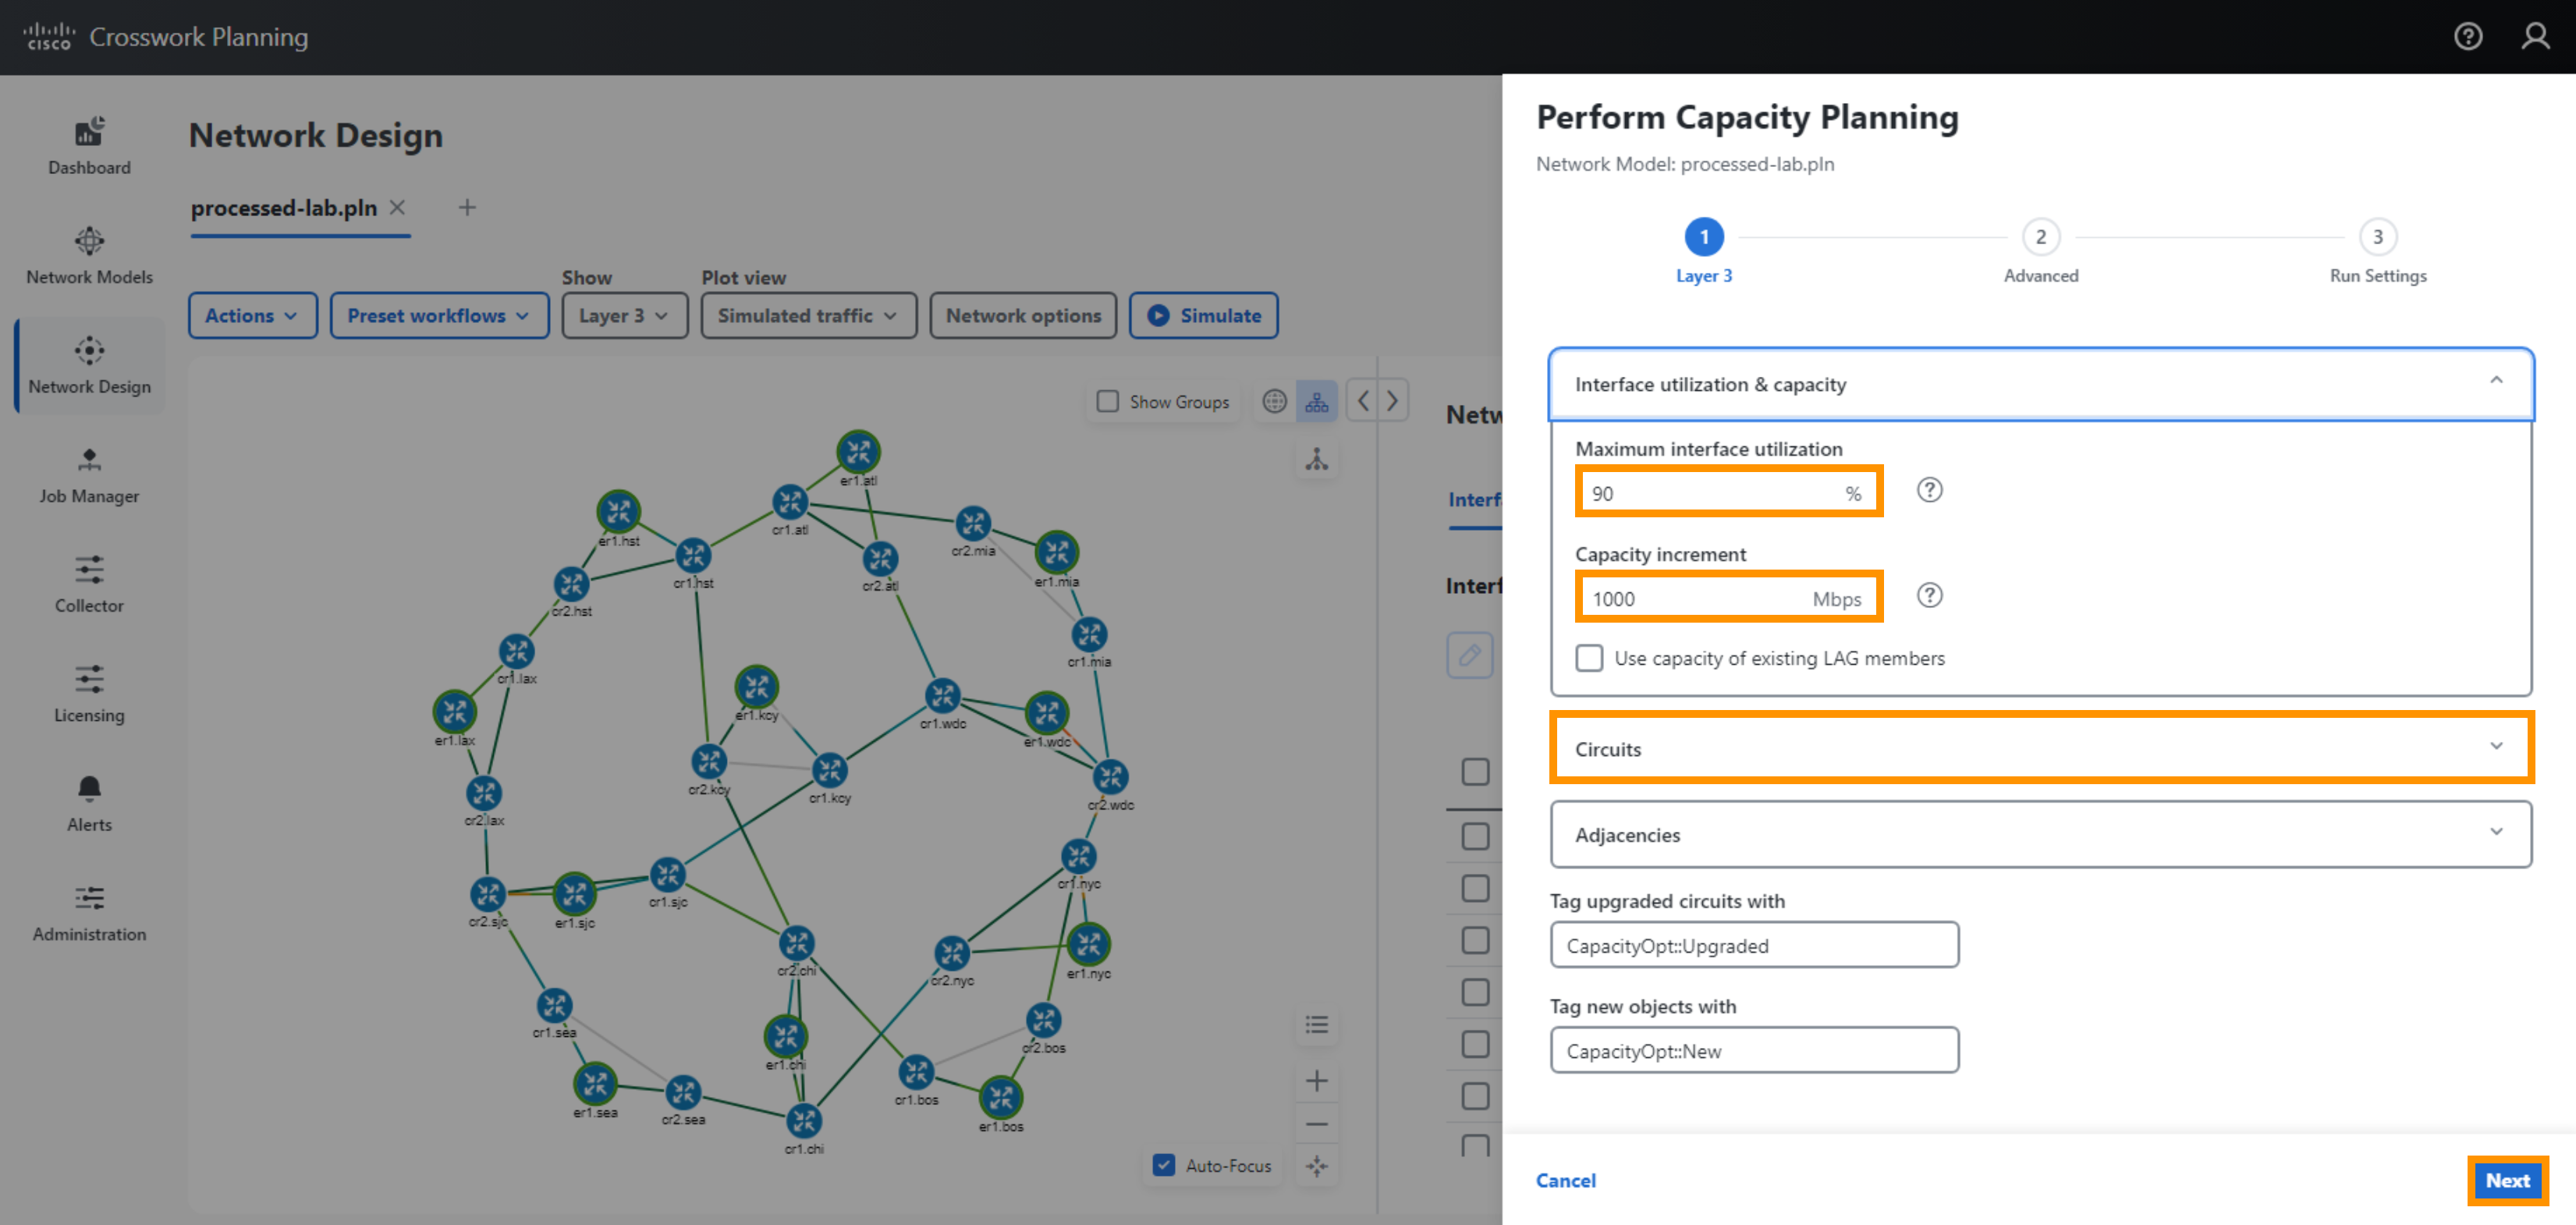
- Enter a Utilization threshold %: 90
- Enter BW Increment: 1000
- Select All Circuits to be eligible for upgrades, select Next
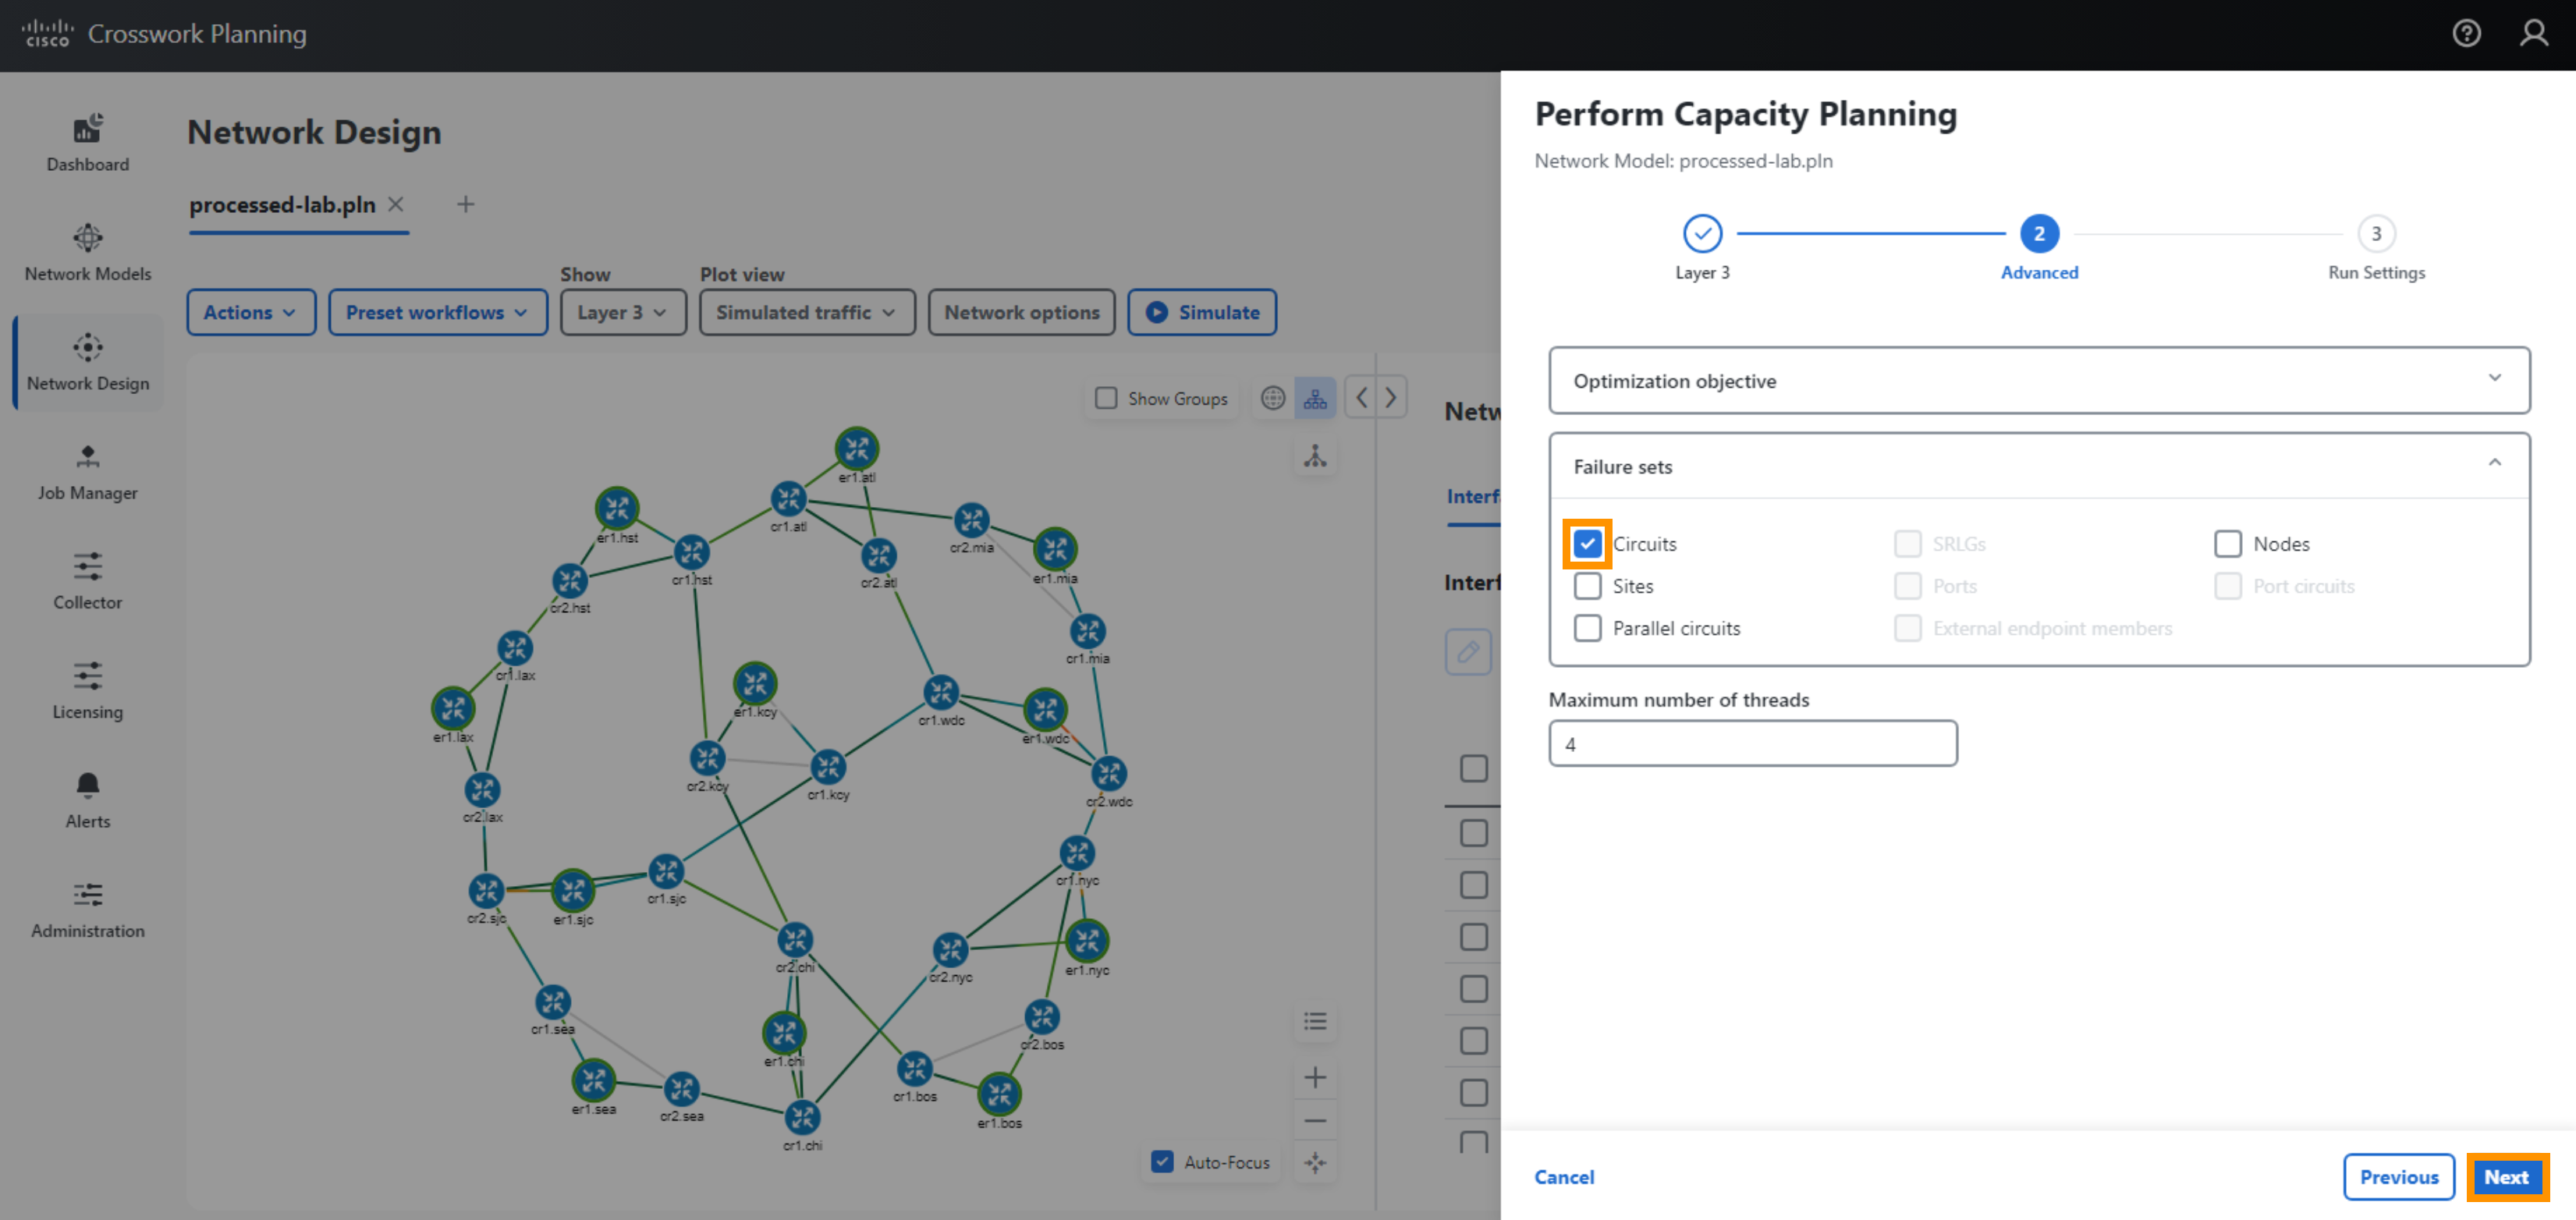
- Under Advanced, Failure sets, select Circuits, select Next
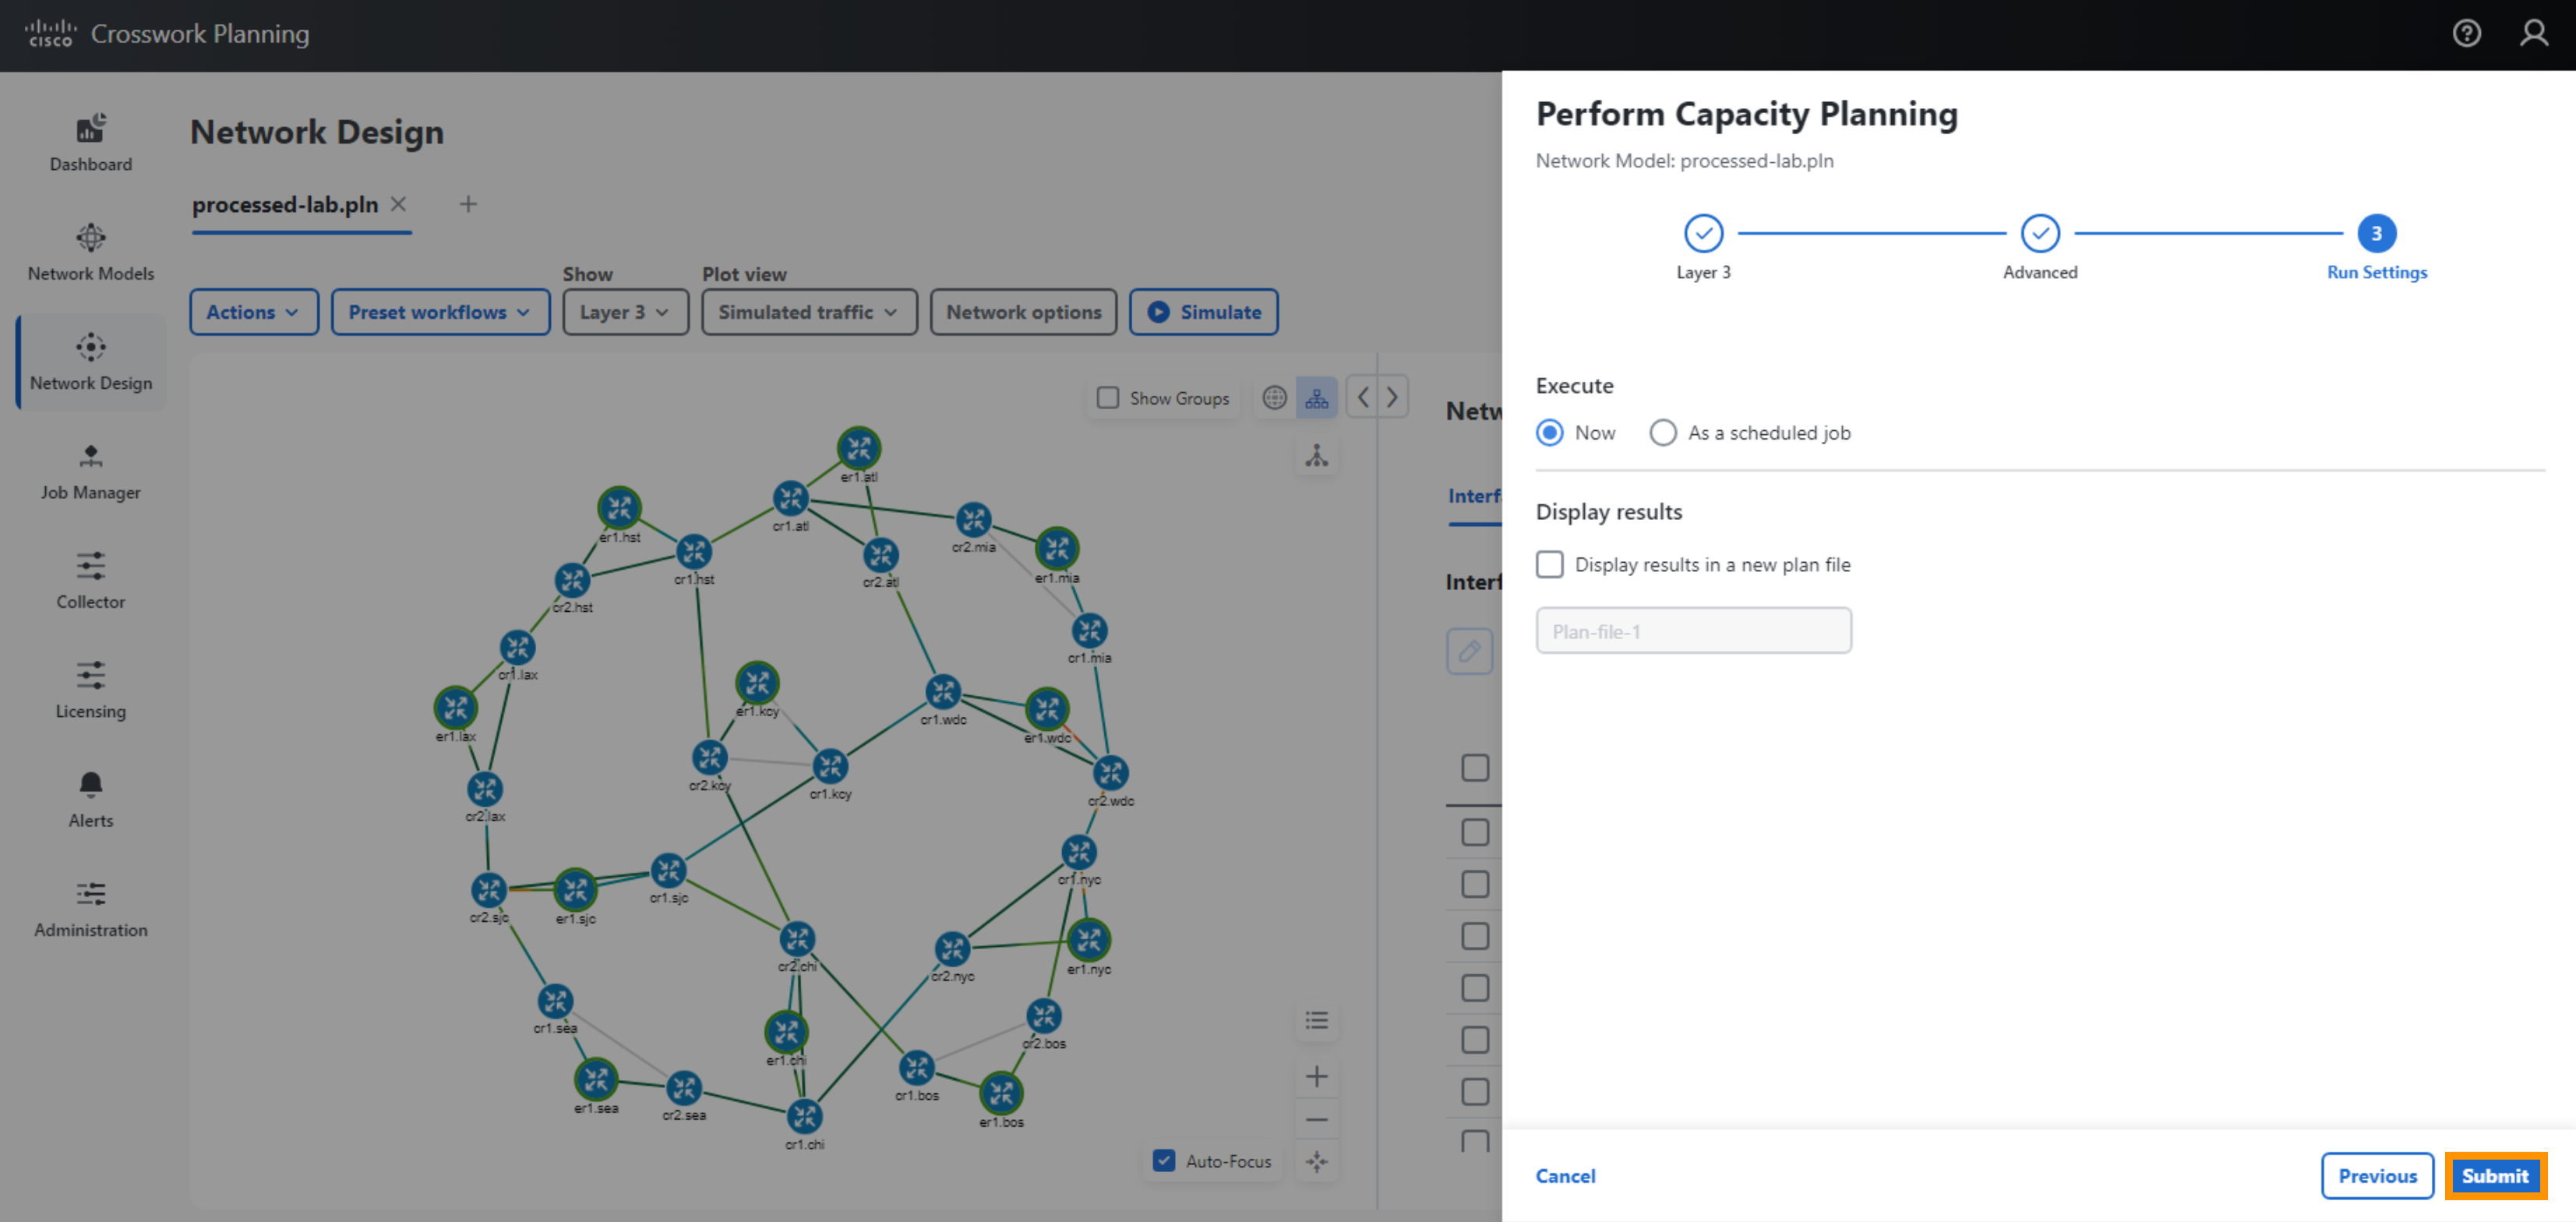
- Under Run Settings, select Execute Now
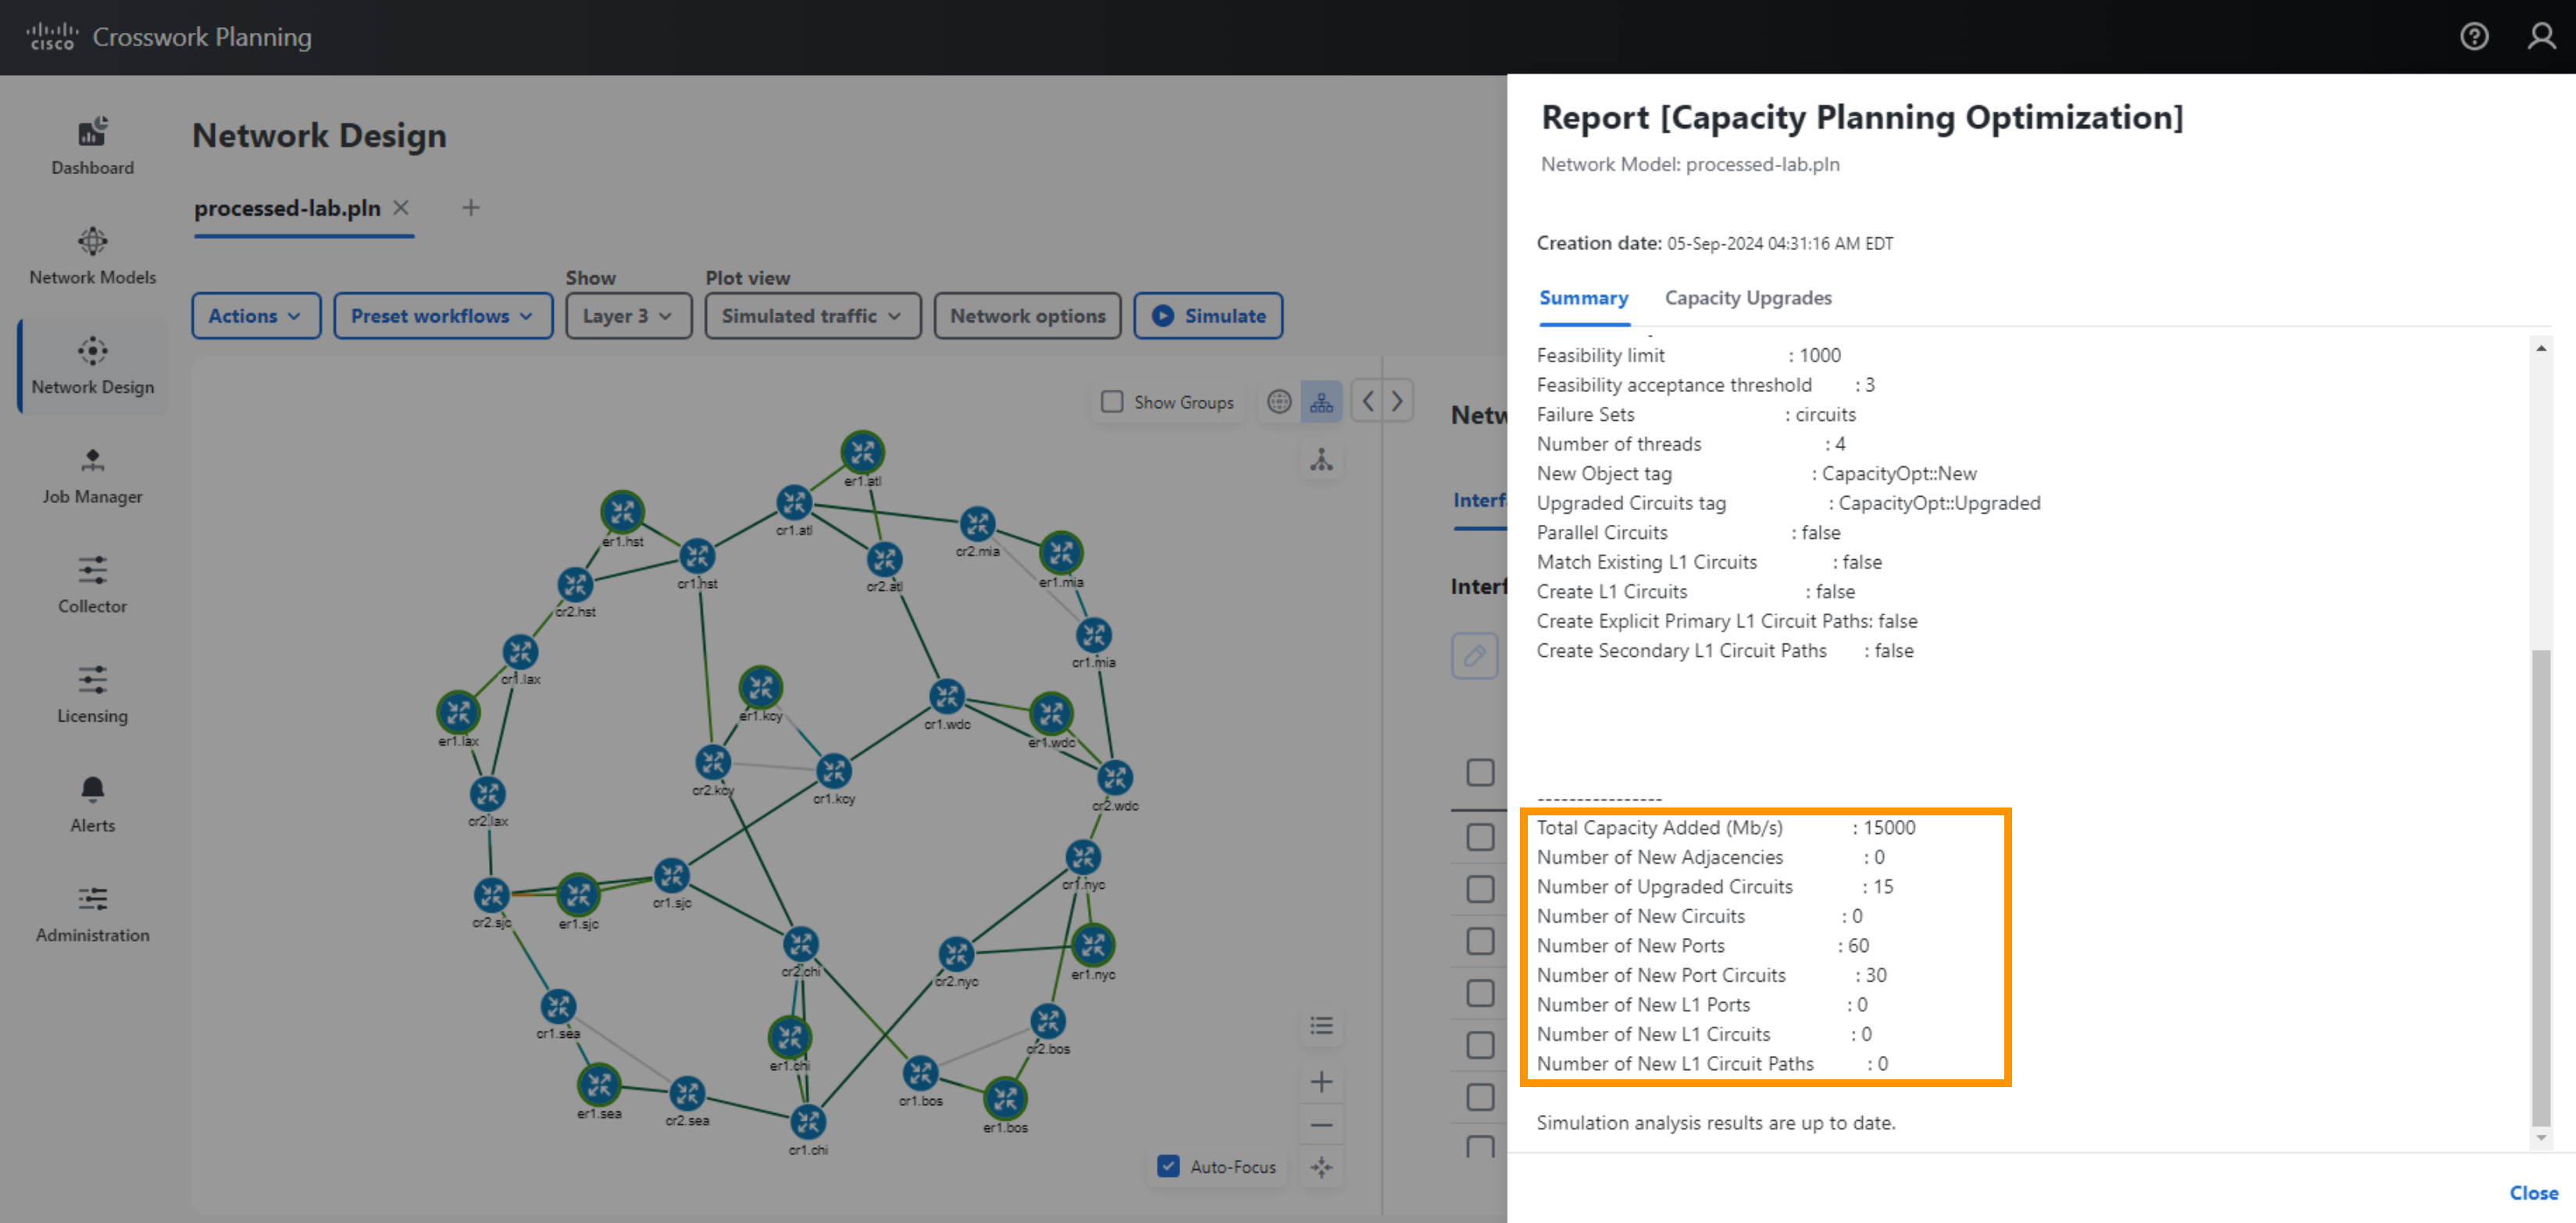
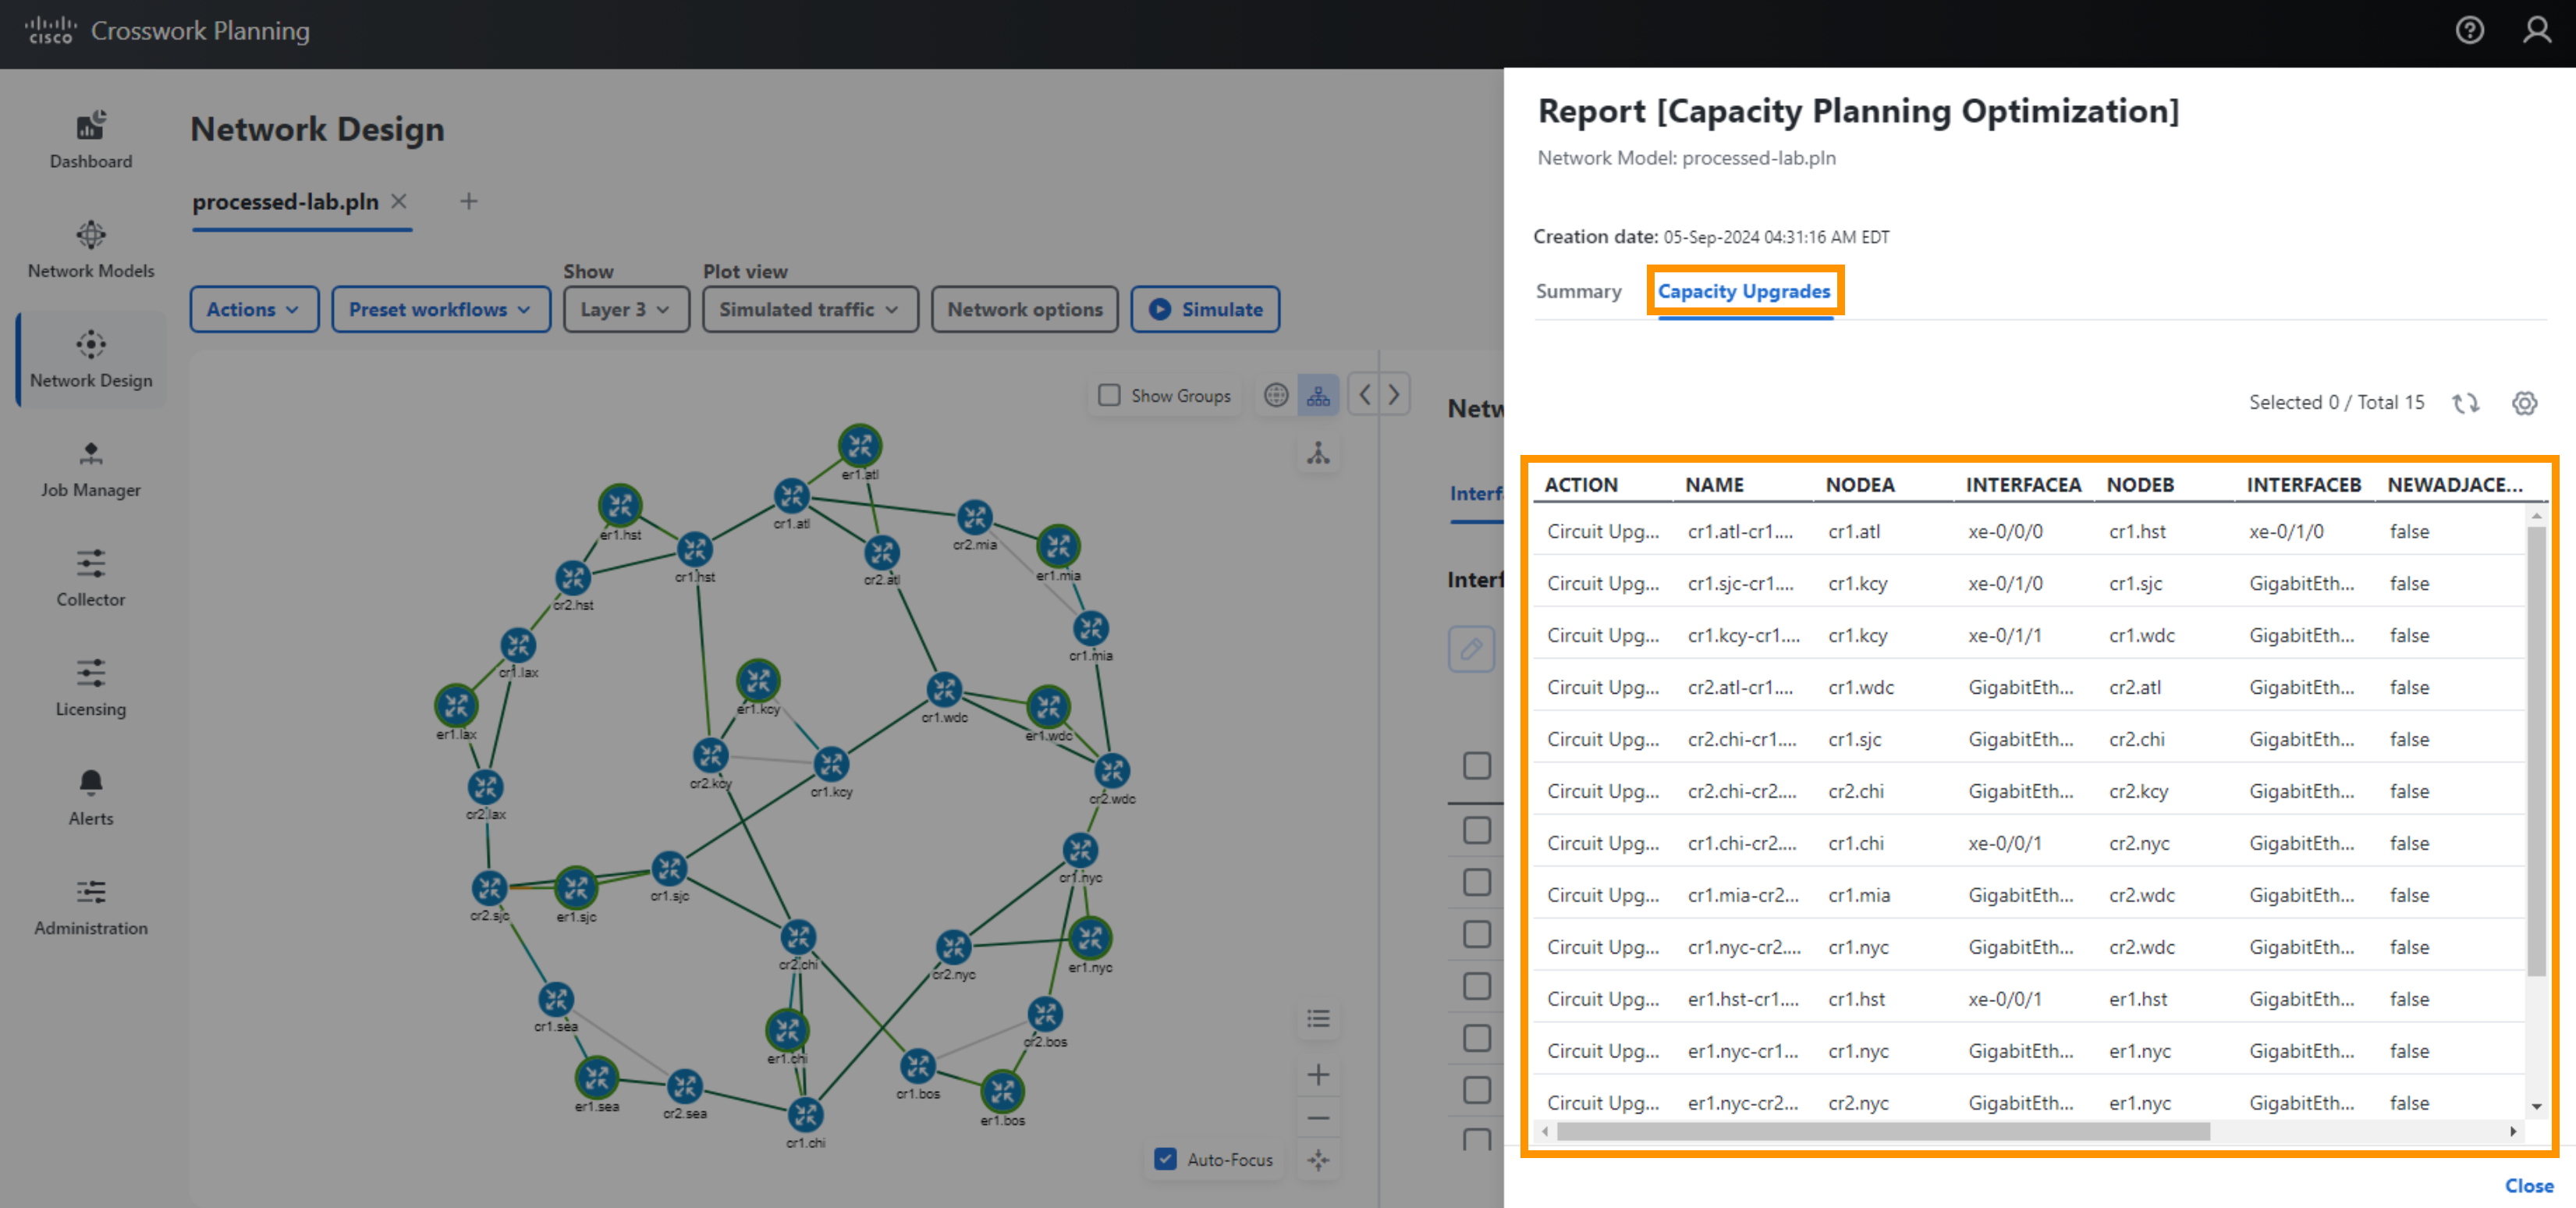
- A new Network Model will be created and a report window will appear. You can see where new capacity was added.
- You can re-run simulation analysis on the new plan and see the worst case differences before and after
Capacity Planning and Forecasting
[INFO] Make sure you have reversed any changes made in the previous step. Crosswork Planning Design does not have an “undo” function so you need to undo any changes manually. You can always re-download and open up a copy of the model (processed-lab.pln) using the button below the heading “What Can You Do With a Network Simulation”.
You have simulated adding traffic to the network by adding demands. Using Design you can also apply a growth percentage to a demand or set of demands and project that growth into the future.
Step 11 Capacity Planning and Forecasting
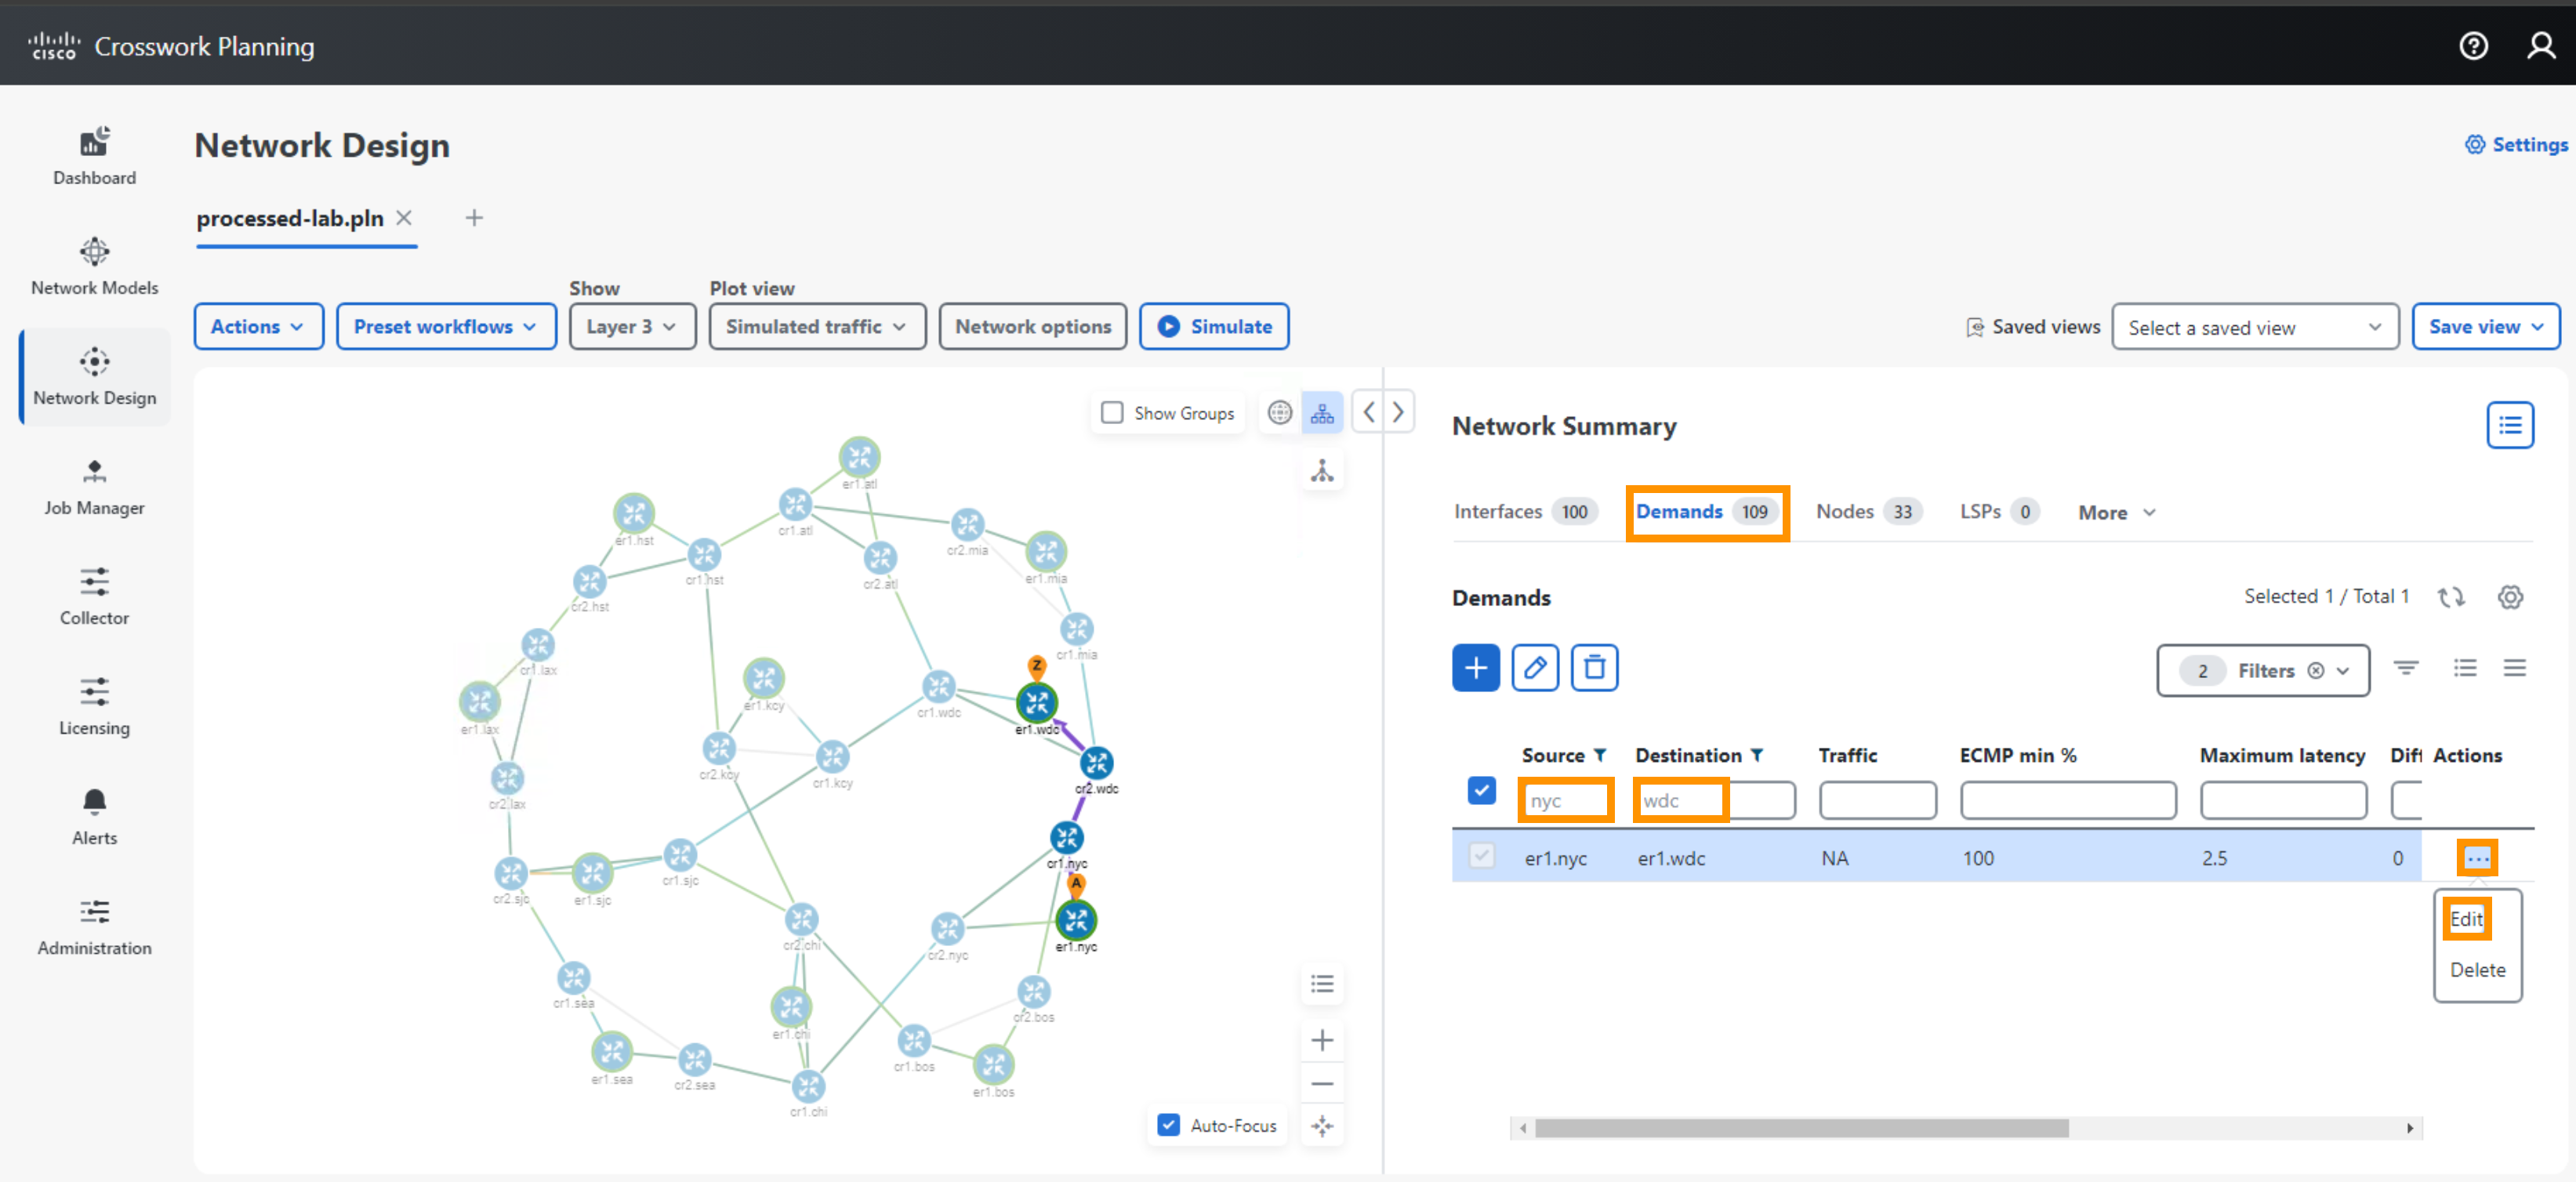
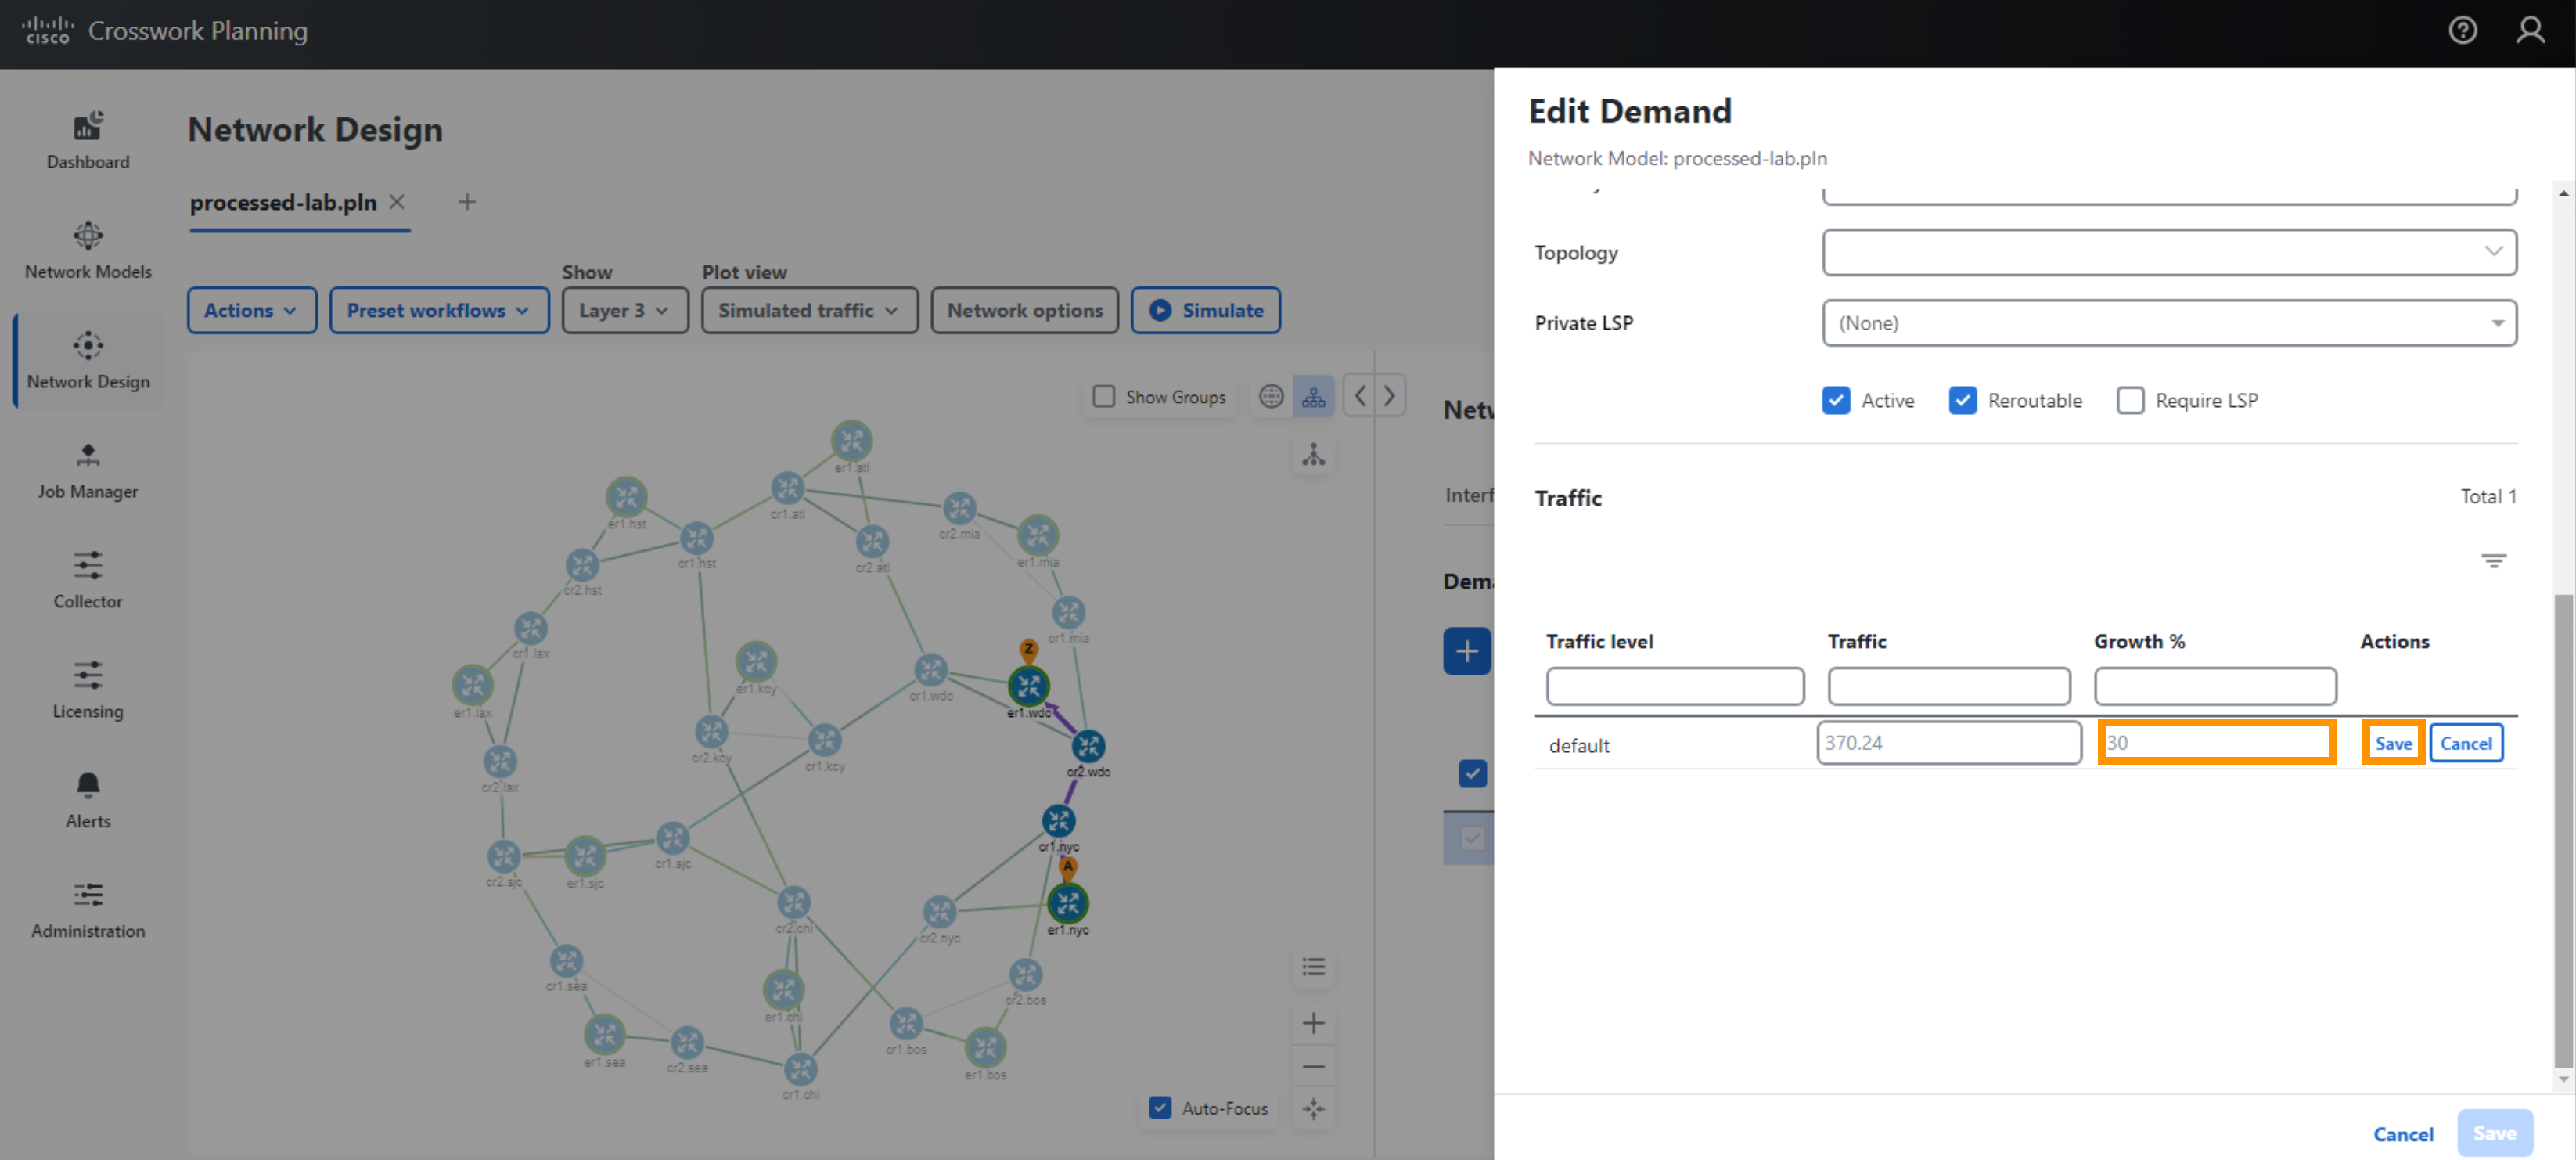
- Apply a Growth Percentage to Demands
- Select the demands between sites NYC and WDC
- Apply a Growth Percentage of 30%. (This means you are estimating the demands will grow by 30% over the next time period.)
- Select Save (under Demand), followed by Save at the Bottom Right Corner of the screen
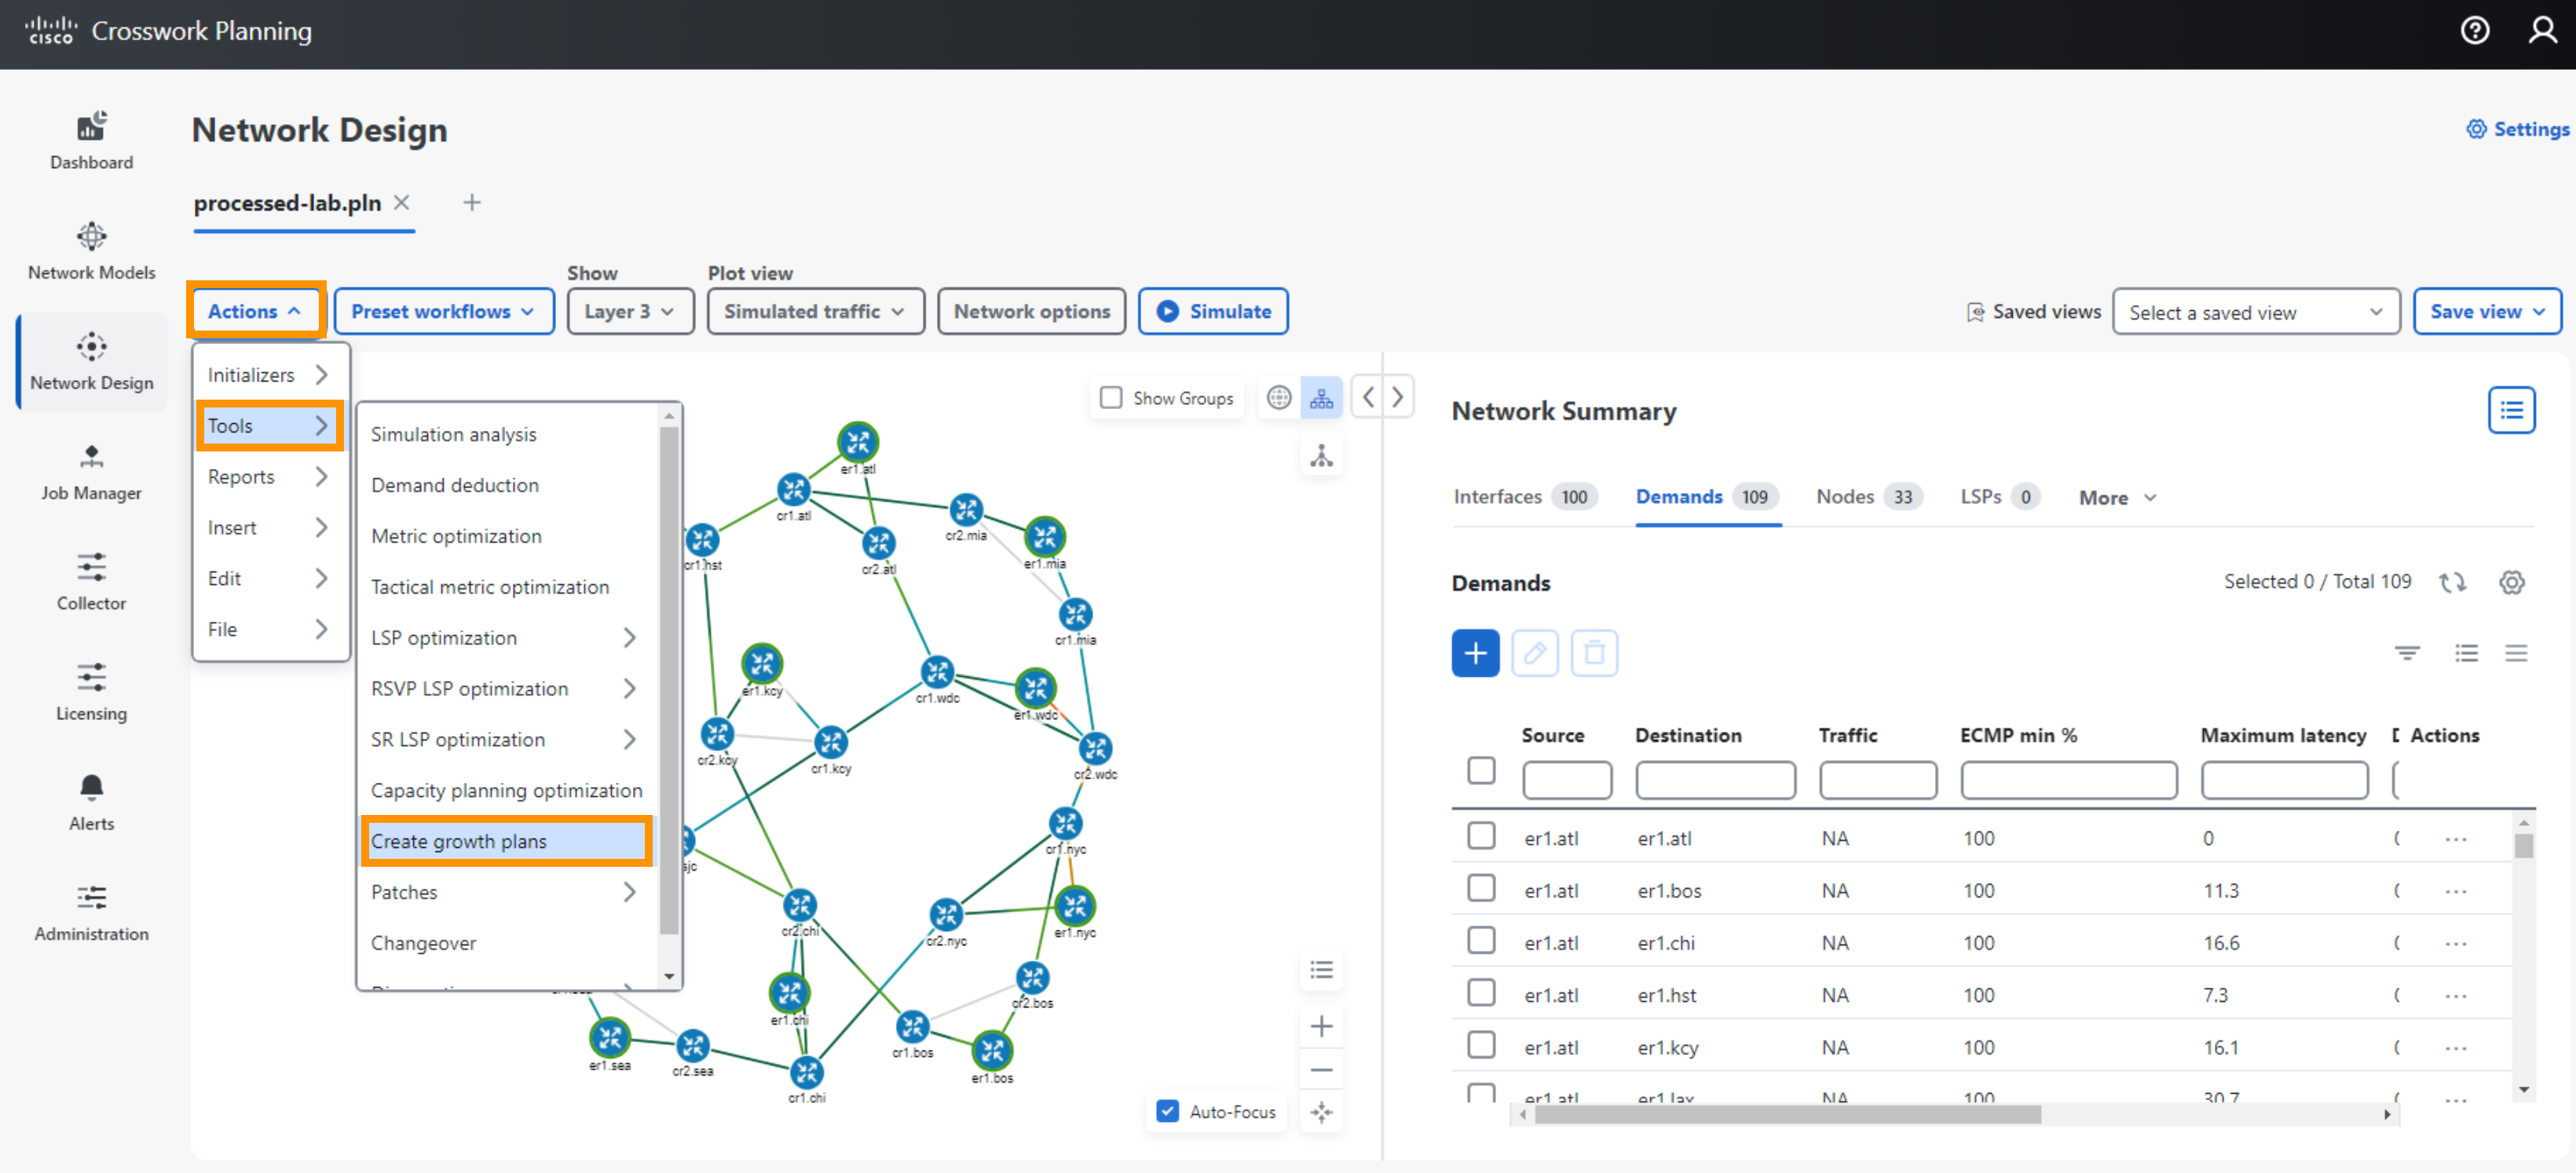
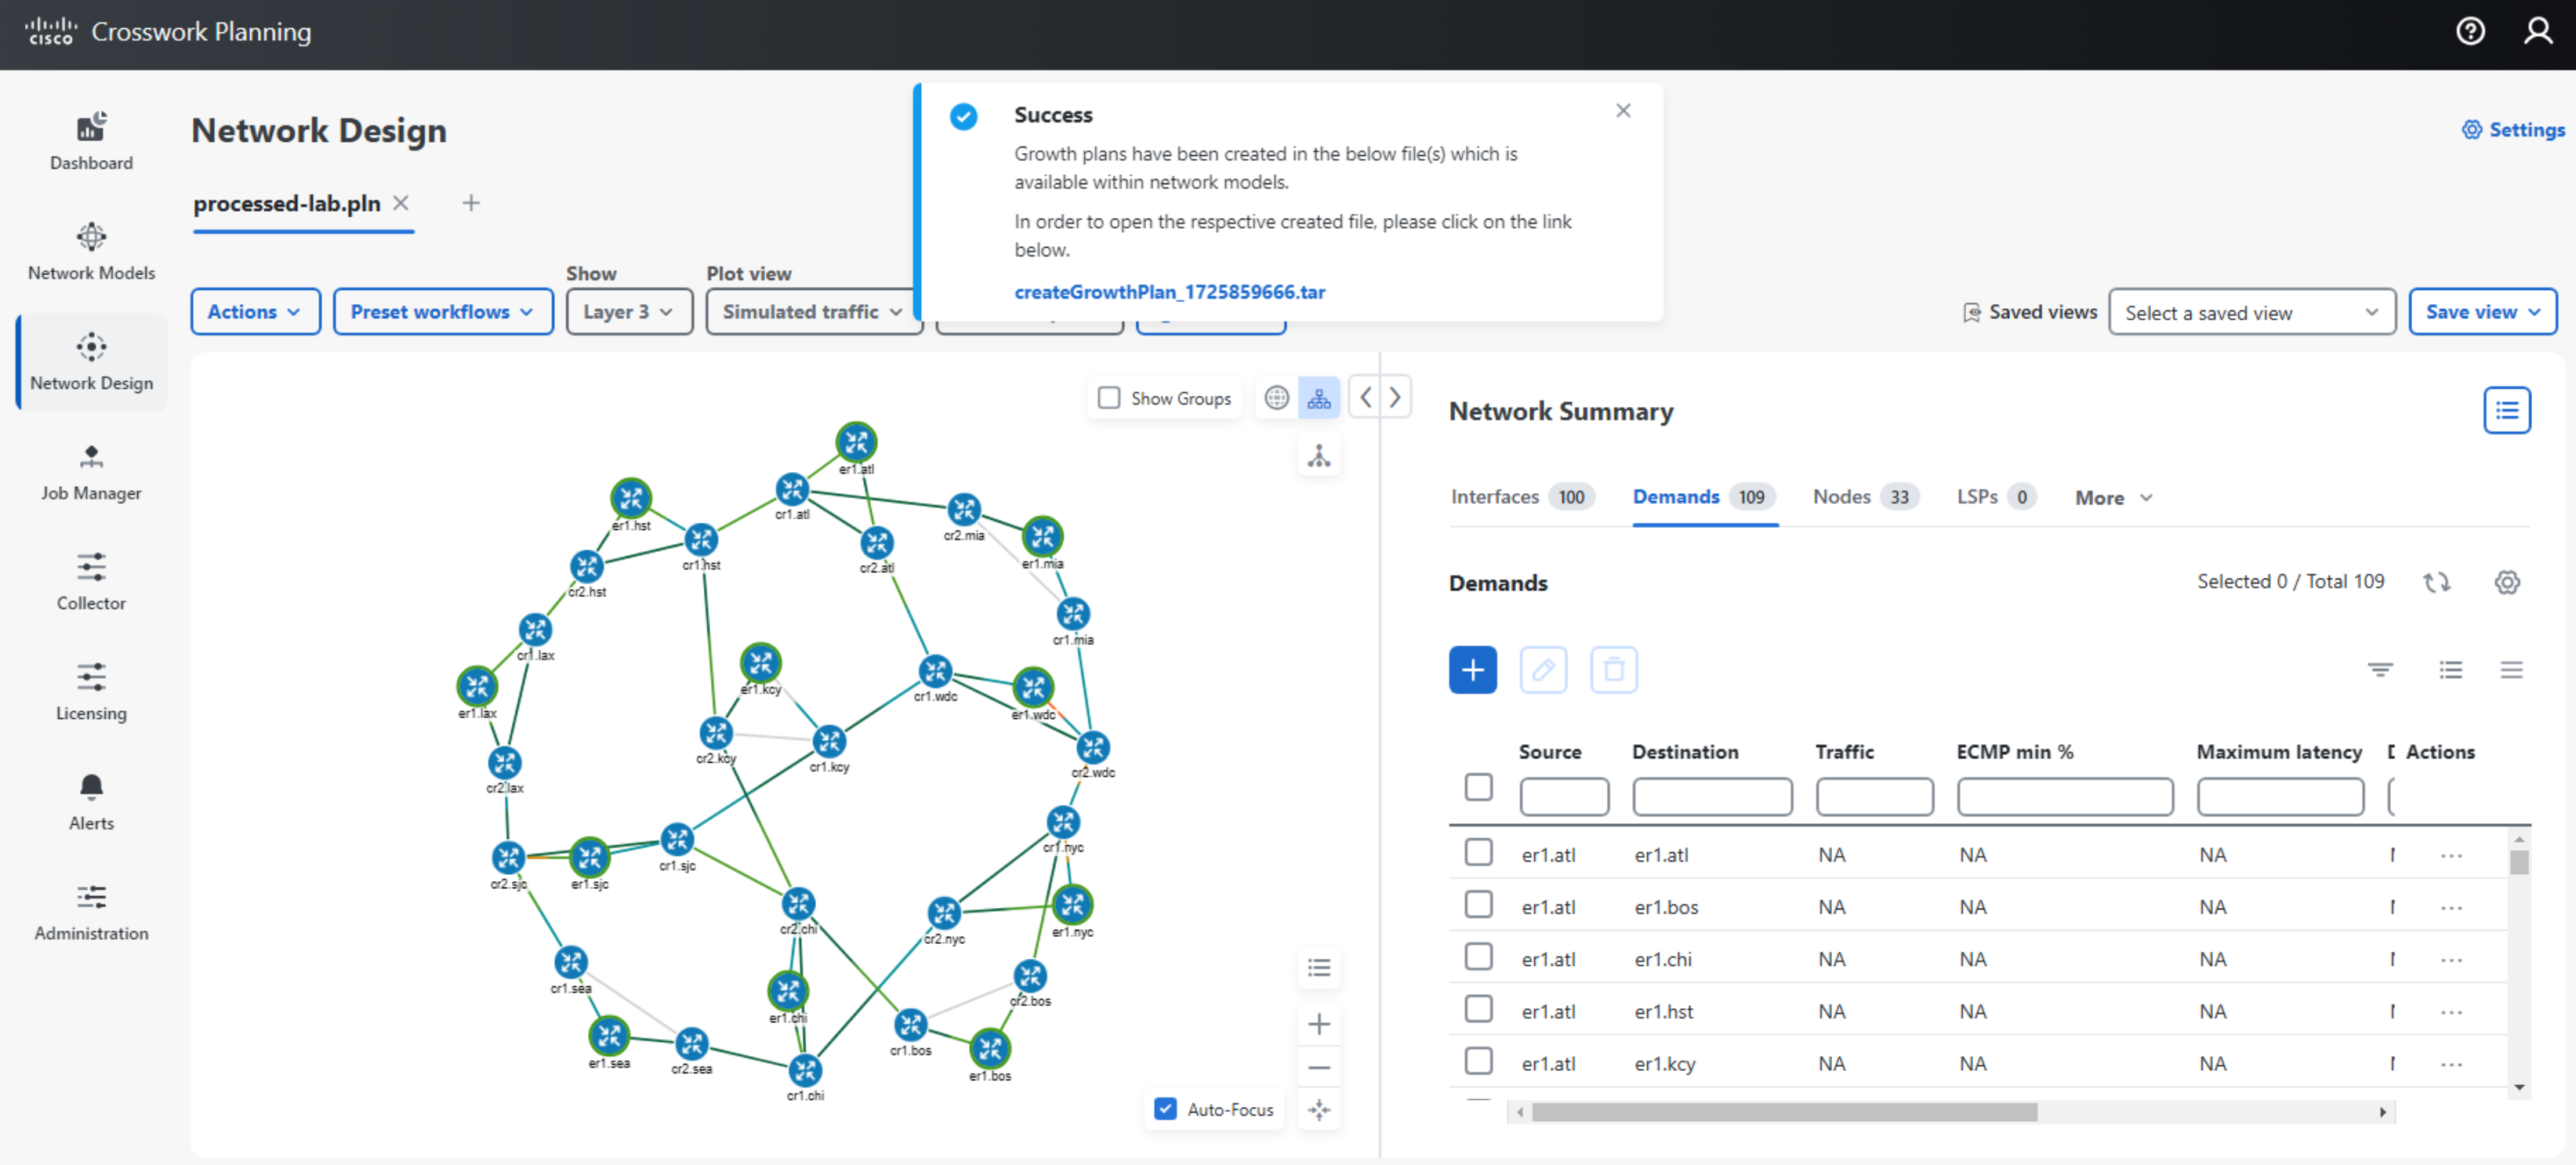
- Create Growth Plans
- Select Actions > Tools > Create Growth Plans
- Select Demand Growth Percentage
- Enter number of periods 3
- Select Save
- A tar file comprising plan files for the growth periods will be created.
- You may download and unpack the individual plan files contained within the tar file
- You may also import the individual plan files to Crosswork Planning to observe the impact of traffic growth and to run Simulation Analysis.
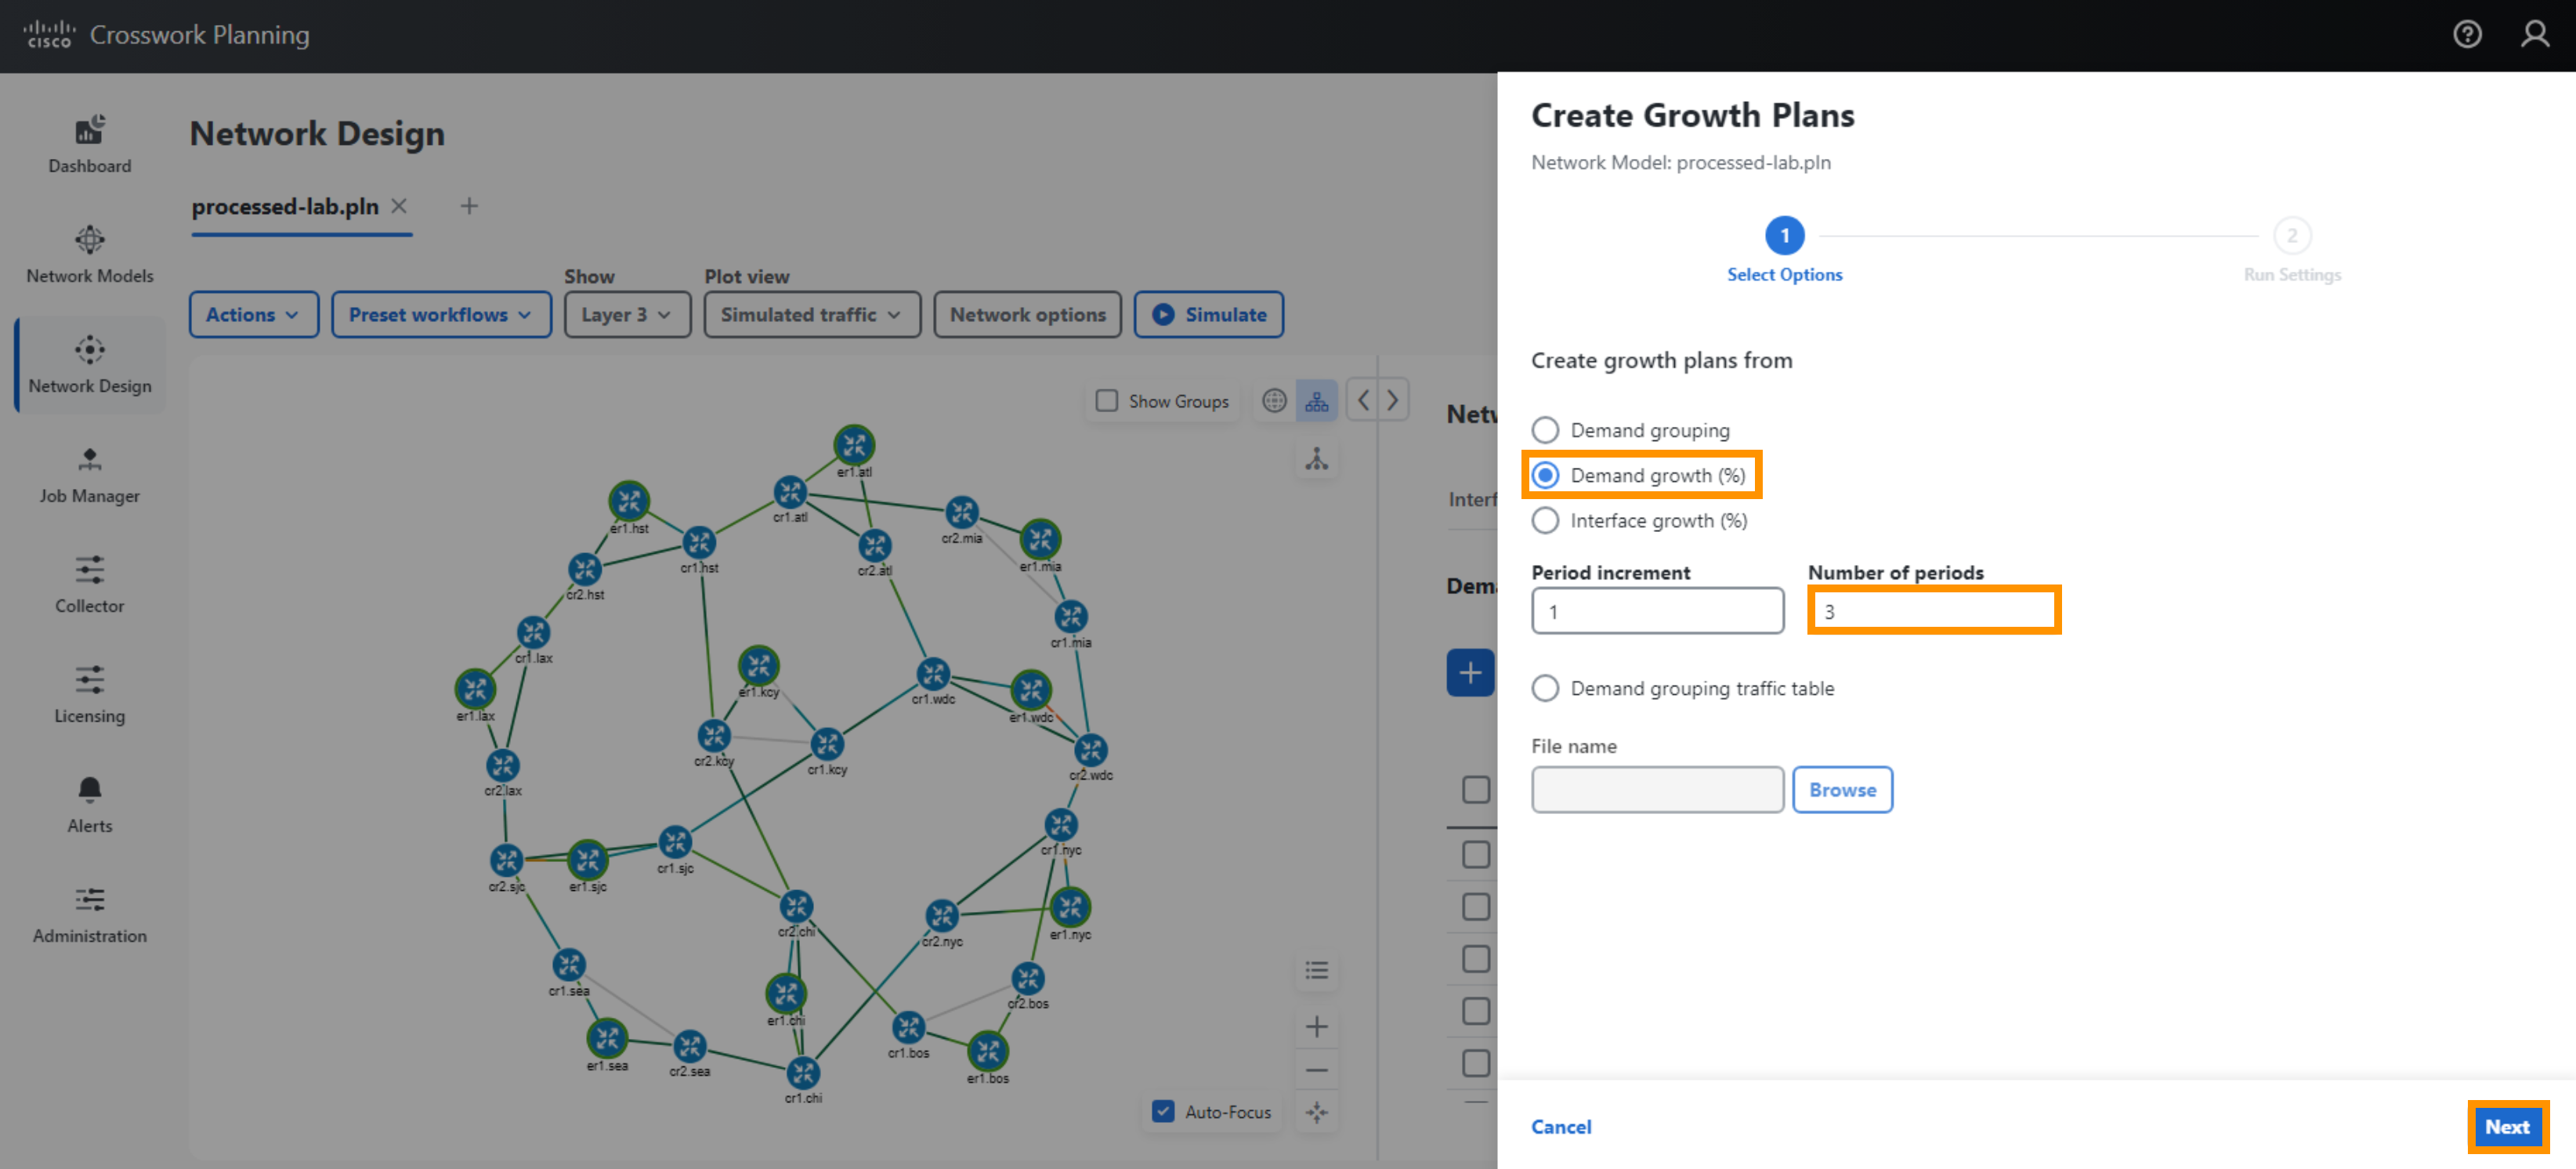
Understanding the Create Growth Plans Options
Example 1: You estimate demands grow 3% per week, so you apply a growth percentage of 3% to the demands. You want to know what your network will look like in 1 year using Create Growth Plans
- Period Increment 52
- Number of Periods 1
Example 2: You estimate demands grow 20% per quarter, so you apply a growth percentage of 20% to the demands. You want to know what your network will look like after every 2 quarter for the next 6 quarters using Create Growth Plans
- Period Increment 2
- Number of Periods 3
[INFO] Growth information derived from the Crosswork Planning Live application can be imported into design. However, Crosswork Planning live is not covered here.
Leave a Comment