
Everything you need to know about Pipeline
We’ve delivered several great tutorials and blogs about Pipeline and modes of its operations during last year. Hopefully, that gave enough information for your good first impression about that collector! IOS XR Telemetry got new protocols and features recently. Plus, we still get different questions about the end-to-end process of using Pipeline and consuming Telemetry. So, it might be helpful to create a more detailed explanation of the whole process. The goal of this tutorial is to remind you the architecture to consume Telemetry streams from routers and give a detailed explanation of how to use Pipeline in different modes. This document will be long, by intention. The purpose is to have everything in a single place. You will be able to quickly jump to the section, you are interested in. If you think you need to remember the basics of how to configure Model Driven Telemetry on IOS XR routers, have a look at our previous post.
A typical basic analytics platform architecture
One of the popular first questions we are still receiving is whether it is possible to re-use the existing SNMP collector to consume and process Streaming Telemetry. The short answer is “No”. The long answer is that Telemetry is not just much faster comparing to SNMP, but it also has a different format and, hence, processing of that data is different. When it comes to Telemetry consumption, one might think about this high-level architecture:
- Collection layer: the first stop for the data streamed out of the router. The main goal is to collect all the streams and transform them from GPB/JSON into a format that will be supported by the layer above. Filtering might also be configured here.
- Storage layer: usually a TSDB (time-series database). The goal is to take the data from the “Collection layer” and store it together with timestamps. You can also have other types of databases here (think of telemetry as a big data solution).
- Application layer: this is where you apply your business logic tools for the data stored in the storage layer.
You should have a solid picture of the basic three-layer architecture by now. A question might come about mapping this architecture to a real solution.
This is an open-source based end-to-end solution for IOS-XR Model Driven Telemetry consumption:
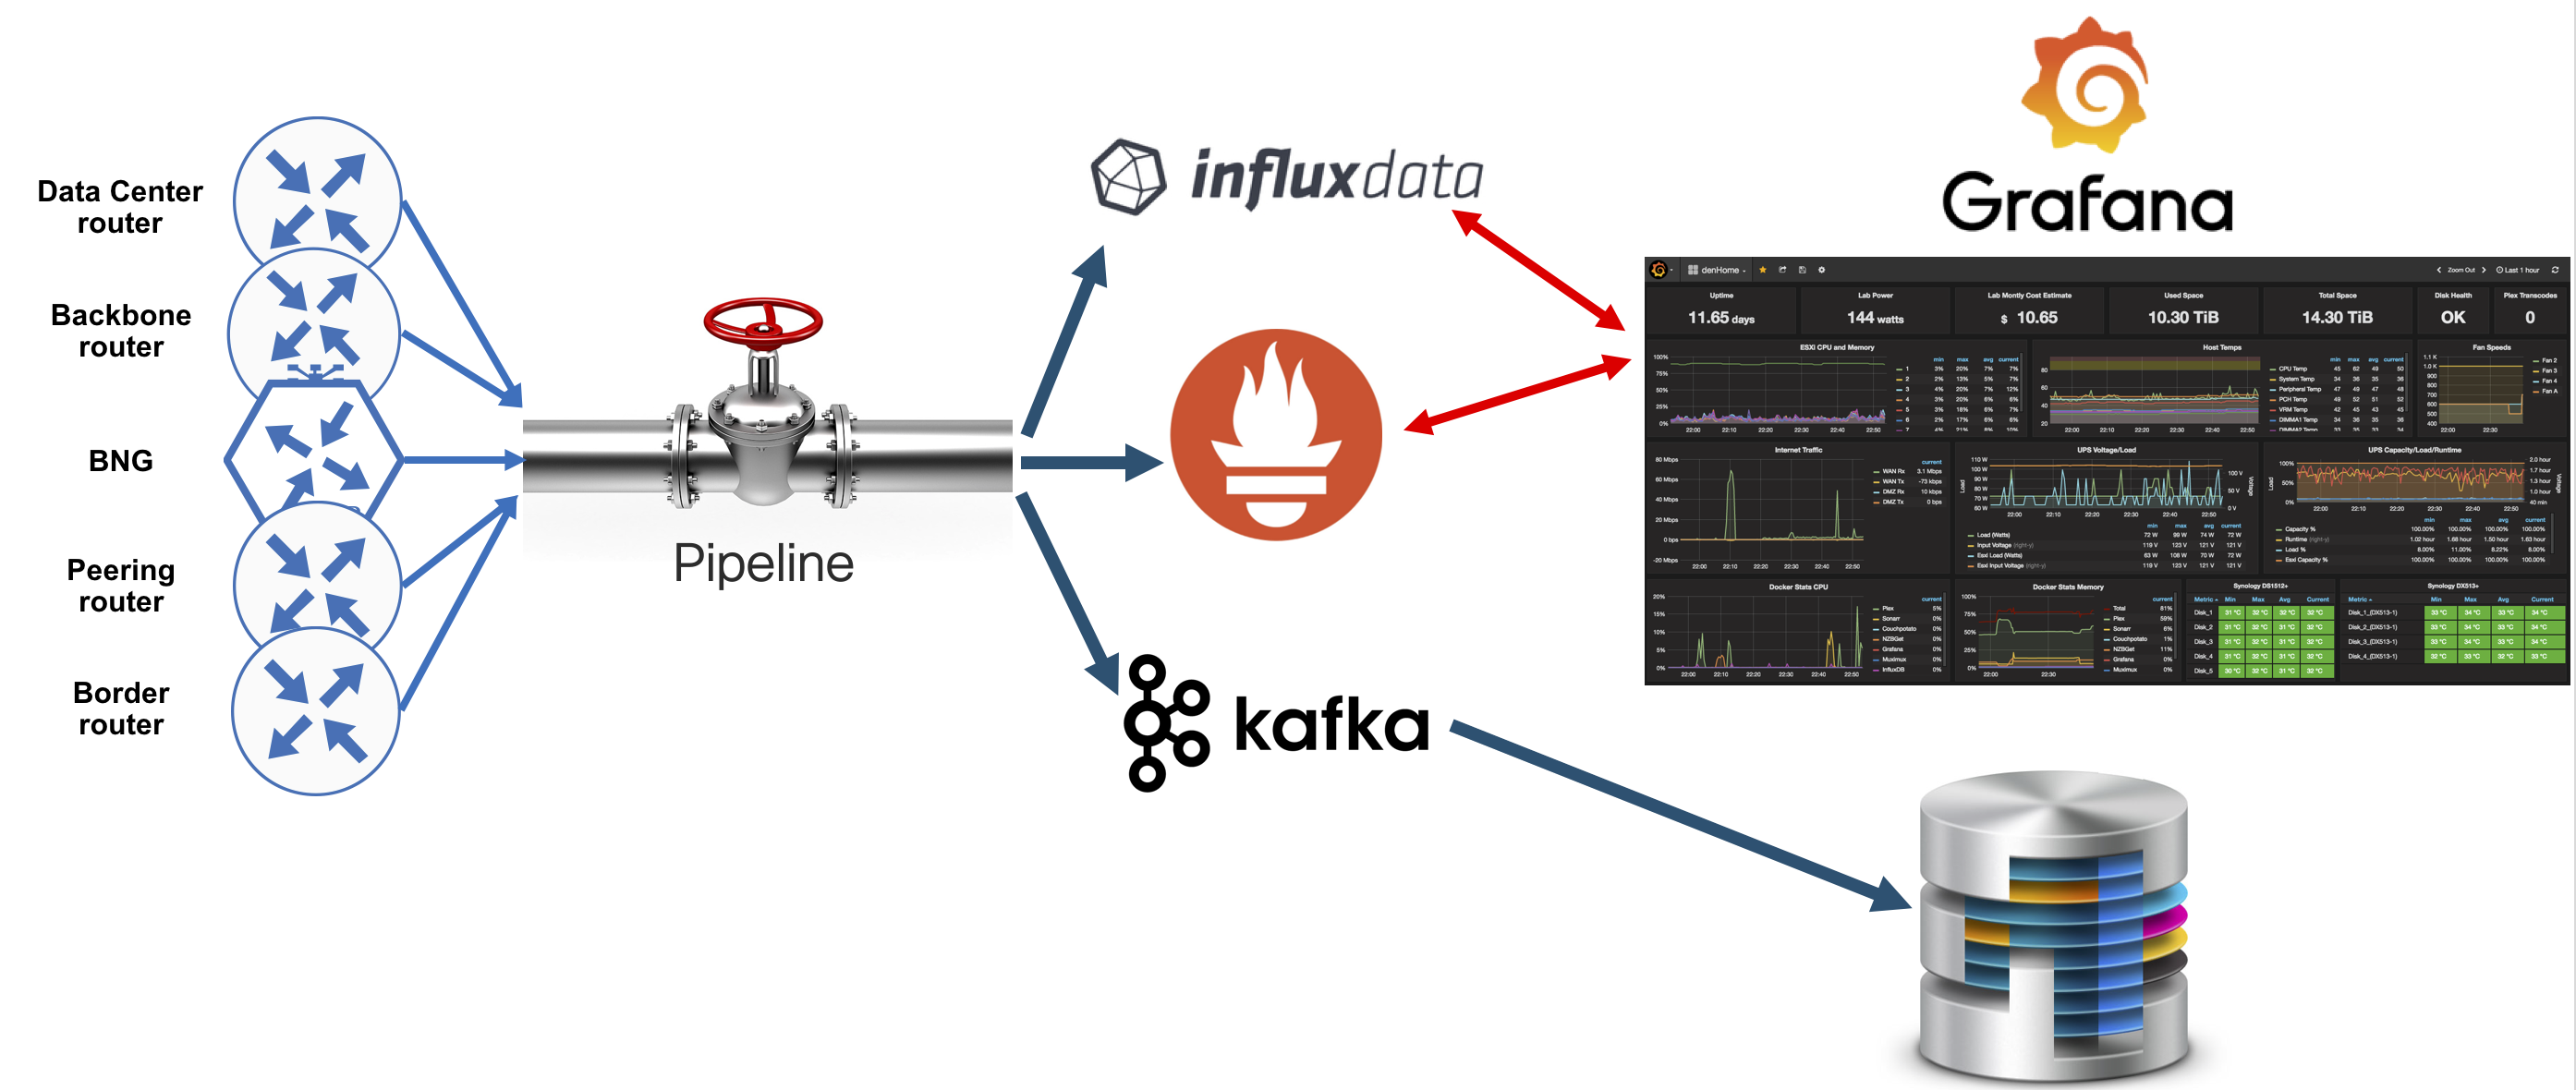
All elements in the solution can be downloaded from Github (well, except routers!). Pipeline represents the “Collection layer”. InfluxDB and Prometheus represent the “Storage layer”, or the place to store your data. Grafana is an example of the “Application layer”. As of today, Grafana is a very popular visualization tool, that can be used for monitoring and alerting. Pipeline can also stream data into Kafka bus. You can connect your own databases to consume data from Kafka bus. Pipeline is the main topic of this tutorial. Storage and Application layers will be explained in details in the following tutorials.
Pipeline: a brief overview
Pipeline is a well-written Golang–based code which consumes IOS XR telemetry streams directly from routers or indirectly from a pub/sub bus (Kafka). Once collected, Pipeline performs transformations of the data and forwards the result to the configured consumer.
Pipeline supports different input transport formats from routers (please be aware that multiple input modules of any type can run in parallel):
- TCP
- gRPC
- UDP
- Apache Kafka
Pipeline can support different encodings as well:
- (compact) GPB
- KV-GPB
- JSON
Pipeline can stream data to several different consumers. Supported downstream consumers include:
- InfluxDB (TSDB)
- Prometheus (TSDB)
- Apache Kafka
- dump-to-file (mostly for diagnostics purposes)
Pipeline: how to start
There are two ways to install Pipeline on your Linux server:
- Clone or download from Github
- Install as a Docker container
“Pipeline.conf” contains everything you need to configure your collector. It contains several input sections (where you can define how you want the collector to interact with routers) and different output sections (to define where you want to send the processed data).
“Metrics.json” is the place where you need to define what you want to insert into your TSDB (InfluxDB, Prometheus).
pipeline is the binary for the Pipeline collector and can be found in “bigmuddy-network-telemetry-pipeline/bin” directory.
To make Pipeline running, one must start the binary file. There are several ways to do it:
- The simplest way is just to start the binary as is. To do this, you need to go to the “bigmuddy-network-telemetry-pipeline” directory and send this command “./bin/pipeline”. After you start Pipeline, the system will check for the “pipeline.conf” file in the current directory (hence, to start Pipeline from the “/bin” directory, you will need to copy the “pipeline.conf” file there. So, probably it is easier to start just from the main directory)
- There is an alternative way to start pipeline with another (your own) version of the ”pipeline.conf” configuration file. As an example, you want to quickly check your new Pipeline configuration, but don’t want to update the current working config. You can just create a copy of “pipeline.conf”, make all the needed changes and then run your Pipeline specifying that file, using this command: ./bin/pipeline -config="pipeline_test.conf"
- A very good option when you want to see internal logging messages is to start this way: ./bin/pipeline -log= --debug.
Option 3 is very helpful for tests, when you want to check how routers connect to the Pipeline (or Pipeline connects to the routers) or when something goes wrong, you can check logging messages, as it will accelerate your troubleshooting activity. When you’re ready to move to a scaled environment, it is better to simplify Pipeline operations as much as possible and start it using option 1 or 2.
Pipeline: metrics.json
IOS XR Model Driven Telemetry is based on YANG models, that’s why telemetry data pushed from a router is also hierarchical. Time-series databases (InfluxDB, Prometheus, etc) typically expect data in a simple, flat format. Pipeline takes the hierarchical YANG-based data and transforms it into a flat format for TSDBs consumption. To perform this transformation, Pipeline uses the “metrics.json” file. The “metrics.json” file is a series of JSON objects, one for each configured sensor path. Each object follows corresponding YANG model and you can specify fields (counters) you want to be added.
An example of the “metrics.json” file can be found in the GitHub repo. It contains these models already:
- Interface stats (generic-counters).
- MPLS-TE tunnels auto-bandwidth.
- QoS output stats.
- Processes memory info.
- RAM/free/system memory info.
- CPU utilization.
Creation of the content of the “metrics.json” file might seem difficult initially, but as soon as you start working with it, you will see the logic behind. The header always stays in the same format, you just update your sensor path. Finally, you follow the YANG model and select fields you’re interested in (respecting the hierarchy of the model). As an example, let’s see how a single hop IPv4 BFD YANG model will look like after translation into a “metrics.json” object. Here is the YANG model and the specific path we are interested in:
vosipchu$ pyang -f tree Cisco-IOS-XR-ip-bfd-oper.yang --tree-path bfd/ipv4-single-hop-summary
module: Cisco-IOS-XR-ip-bfd-oper
   +--ro bfd
      +--ro ipv4-single-hop-summary
         +--ro session-state
            +--ro total-count?      uint32
            +--ro down-count?       uint32
            +--ro up-count?         uint32
            +--ro unknown-count?    uint32
And this is how you can build the content in the “metrics.json” file:
{
	"basepath" : "Cisco-IOS-XR-ip-bfd-oper:bfd/ipv4-single-hop-summary",
	"spec" : {
		"fields" : [
			{"name":"session-state",
				"fields" : [
					{"name":"down-count"},
					{"name":"total-count"},
					{"name":"unknown-count"},
					{"name":"up-count"}
				]
			}
		]
	}
},
In one of our next tutorials we will share the “metrics.json” file containing JSON objects for many popular sensor paths, together with use cases for your convenience and faster Telemetry adoption!
Pipeline: internal monitoring
Pipeline comes already with a basic configuration that accepts TCP-based telemetry on port 5432 and the processed data is dumped into a file in the JSON format. (we will go through all configurations later in this tutorial). Above that, exporting of internal state for Pipeline monitoring is active as well. You don’t need to configure anything in addition to this, but this works with Prometheus time series database. It doesn’t mean you have to use just Prometheus for all other sensor paths, but you should have it running. You can also use a script from the Pipeline GitHub repo to start Prometheus for monitoring.
Here is a snapshot from Pipeline under load (not all monitored parameters are shown below):

If, for some reason, internal monitoring is disabled, you need to make sure you have these 2 lines under [default] section of the “Pipeline.conf” file (you can find it at the beginning of the file):
metamonitoring_prometheus_resource = /metrics
metamonitoring_prometheus_server = 10.1.1.1:8989  ## put the IP address and port of your Prometheus server
Pipeline: TCP Dial-OUT
As it was mentioned earlier, Pipeline has several input methods. Let’s start with TCP Dial-OUT mode configuration. This is the case, where you use TCP as the transport protocol for your streaming telemetry data delivery. And this mode is enabled by default! To make sure that Pipeline accepts and processes telemetry data, you need to make sure that configuration on your router corresponds to the configuration on Pipeline.
Here is the configuration to be done for TCP Dial-OUT mode:

As you can see, the configuration is pretty simple. You can use IPv6 or IPv4 destination address, Pipeline works fine with both. A major requirement for TCP is to have a two-way connectivity, as TCP is a connection-oriented protocol. You need to make sure that destination port on your router is equal to the listen port at Pipeline. If you have several IP addresses / NICs on your server, Pipeline will listen to the specified port on each interface. You can also add IP address in the Pipeline configuration if you want to be specific. The format for IPv4 address is:
listen = ipv4_address:port
The format for IPv6 address is:
listen = [ipv6_address]:port
As of today, IOS XR supports several encoding protocols:
- Compact GPB
- Key-Value GPB
- JSON
You can proceed with any encoding you like, but from Pipeline side configuration will always stay as:
encap = st
This small feature should make your life a bit easier!
If you have everything configured correctly, the two-way connectivity is up and you run Pipeline in debug mode, you should get a similar message in stdout:
INFO[2017-11-15 14:07:41.898128] TCP server accepted connection encap=st keepalive=0s local="[2600::100]:5432" name=testbed remote="[2222:beaf:13::3]:55137" tag=pipeline
This is everything you need to know to have TCP Dial-OUT mode up and running!
Pipeline: UDP Dial-OUT
UDP Dial-OUT support in IOS XR Model Driven Telemetry was added in IOS XR 6.2.x release and could be a good option to do quick tests with Streaming Telemetry. UDP is a connectionless protocol, so, you need to have just a one-way connection to your collector. The lack of feedback from Pipeline back to your routers and unreliable delivery of packets are two major concerns against using Streaming Telemetry over UDP in your production environment.
UDP Dial-OUT mode configuration is similar to TCP Dial-OUT mode. Here is the configuration for UDP Dial-OUT mode:

As with TCP Dial-OUT, you can use IPv6 or IPv4 addresses to reach to Pipeline. You can use any available encoding protocol on the router (GPB, KVGPB or JSON), encoding configuration in Pipeline will stay the same (“encap = st”) There is no messaging expected in stdout from Pipeline, as there is no connection establishment with UDP.
This is everything you need to know to have UDP Dial-OUT mode up and running!
gRPC: things to know about
Before going forward with other input modes, let’s make a short stop to talk about gRPC. gRPC is the most popular transport protocol across installations of our customers. The reason is that it is based on HTTP/2 and has a number of benefits:
- Dial-IN and Dial-OUT support
- Binary mode
- Encryption support
- Windowing mechanism at the application layer (speed negotiations between the collector and the router)
To have gRPC running, you need to have a two-way connectivity between the router and your collector. That sounds reasonable, but you should always remember that gRPC code in IOS XR routers runs as a third-party application (to learn more about application hosting in IOS XR, have a look here) in Linux (hence, that is why there is no gRPC support on 32-bit QNX-based XR!). So, it means that you need to check your connectivity exactly from there!
Here are the steps you need to follow to check the connectivity:
- In CLI exec mode type “bash” (this will move you to gRPC application)
- From there check the routing table with “ip route show” Linux command
- If there is no route to your destination, you have to add it. Otherwise, try to ping (and hope to get your echo replies!)
Here is an example of the steps above:
RP/0/RP0/CPU0:NCS5502_bottom#bash
Wed Feb 21 09:06:47.963 PST
[NCS5502_bottom:~]$ ip route show
default dev fwdintf  scope link  src 172.16.0.3
10.30.110.32/27 dev Mg0_RP0_CPU0_0  proto kernel  scope link  src 10.30.110.43
 [NCS5502_bottom:~]$ ping 10.30.110.38
PING 10.30.110.38 (10.30.110.38) 56(84) bytes of data.
64 bytes from 10.30.110.38: icmp_seq=1 ttl=64 time=0.751 ms
64 bytes from 10.30.110.38: icmp_seq=2 ttl=64 time=0.962 ms
^C
Before moving into the explanation how to fix situations with no proper route to your collector, let’s have a look at the routing table output above. That output should be very similar to what you will see after enabling MDT with gRPC. The default route (in blue color) is used for all Telemetry traffic going out through data plane ports. It will be created automatically as soon as you have the first Loopback configured on your router (and it will be not, if you don’t yet have loopbacks!). The route shown in magenta color represents all the traffic flowing through management port, and it is also created automatically for you.
Let’s think about two possible scenarios where you might need to make changes to the routing table. The first one is when you have your collector behind the data port, but not reachable via the selected loopback interface. Yet another situation is when you have the collector within your management network, but there is no route to that destination (you have the directly connected network only through the management port and the default route is through data ports). In both cases you will need to update the TPA routing table. The best way to achieve that is to configure the needed source interface under TPA configuration in IOS XR. Here is an example of changing the default route through the management port:
tpa
 vrf default
  address-family ipv4
   update-source MgmtEth0/RP0/CPU0/0
  !
 !
!
And the result of the change is:
RP/0/RP0/CPU0:NCS5502_bottom#bash
Wed Feb 21 11:37:13.271 PST
 [NCS5502_bottom:~]$ ip route show
default dev fwdintf  scope link  src 10.30.110.43
10.30.110.32/27 dev Mg0_RP0_CPU0_0  proto kernel  scope link  src 10.30.110.43
As you can see, the default route was updated with the IP address of the management port. You can read a bit more about gRPC tricks in our previous post. Worth to mention, you’re working with Linux here and can add a route using Linux commands:
route add –net ip_address netmask mask gw your_gw_address
But in that case, it will be available untill the first reboot (and then you need to configure it again, or automate this process).
Everything described in that section is important for both, Dial-IN and Dial-OUT mode. Two-way connectivity means that the router should be able to reach to the collector and, vice versa, your collector will need to have the path to the router.
Pipeline: gRPC Dial-OUT (no TLS)
The most common mode for Telemetry today is gRPC Dial-OUT without encryption (no TLS option). This option was explained before, so let’s just quickly recap the configuration and point out a couple of updates from the previous version.
Here is the configuration to be done for gRPC Dial-OUT (no TLS) mode:

There are several moments that need more attention. When you configure “self-describing-gpb” (Key-Value GPB) or “gpb” (Compact GPB) on your router, you always configure “encap = gpb” in the “pipeline.conf” file. If you want to use JSON encoding, you will have to have this line in “pipeline.conf” file:
“encap = json”
Everything else follows the same logic as in the previous mode. Just be sure to check that you have TLS disabled on your router, as well as in Pipeline.
If you have everything configured correctly, the two-way connectivity is up and you run Pipeline in debug mode, you should get a similar message in stdout:
INFO[2017-11-15 14:20:26.098695] gRPC: Receiving dialout stream encap=json name=grpcdialout peer="[2500::3]:59206" server=[2600::100]:57500 tag=pipeline type="pipeline is SERVER"
This is everything you need to know to have gRPC Dial-OUT (no TLS) mode up and running!
Pipeline: gRPC Dial-OUT (TLS)
gRPC has SSL/TLS integration and promotes the use of SSL/TLS to authenticate the server and to encrypt all the data exchanged between the client and the server. It is something similar to SNMPv3 (added security). In Dial-OUT mode, the router is the “client” and Pipeline is the “server.” Therefore, in the TLS handshake, Pipeline will need to send a certificate to authenticate itself to the router. The router validates Pipeline’s certificate using the public certificate of the Root Certificate Authority (CA) that signed it and then generates session keys to encrypt the session. Running in this mode requires you to have certificates and have your infra ready. But if you want just to try this mode on, there are two ways available for you:
- Follow the steps from this tutorial, or
- Follow the steps in this document. Start with downloading an archive with three files from here
After you downloaded the archive and extracted files from it, follow these steps:
- Put the “dialout.pem” and “dialout.key” files in any folder you like on the server running Pipeline. Remember the path (it will be used later in the “pipeline.conf” file)
- Put the “ca-chain.cert.pem” file on your router to this directory: “/misc/config/grpc/dialout” folder (use “run” from CLI exec mode to get into Linux and then standard SCP command).
- Change the name of the “ca-chain.cert.pem” file from step two to “dialout.pem”.
After going through all the steps above, make sure you have proper configurations on your router and Pipeline (destination, encoding, and type stay the same as in gRPC Dial-OUT no TLS mode):

You need to specify the full path to your “dialout.pem” and “dialout.key” files, located on the server. That is how Pipeline will know where to find the needed certificates.
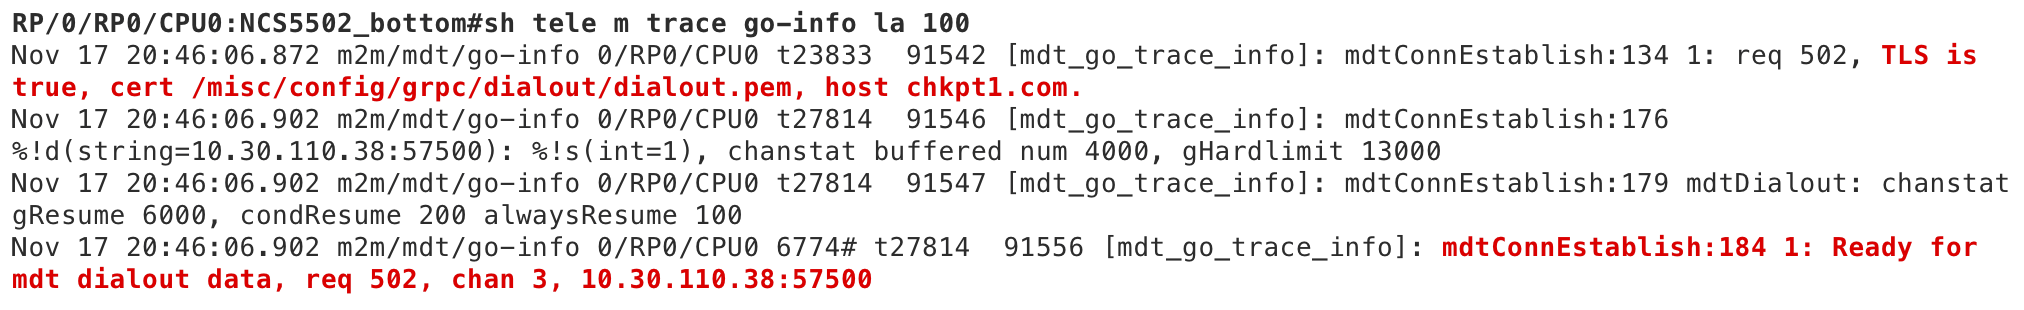
If you followed the steps, you should see a similar output from Pipeline running in debug mode:
INFO[2017-11-17 20:45:54.732520] gRPC: Receiving dialout stream encap=gpb name=grpcdialout peer="10.30.110.43:59914" server=10.30.110.38:57500 tag=pipeline type="pipeline is SERVER"
And here is an indication of the successful connection from the router:
The most common issue for gRPC Dial-OUT with TLS mode is a bad certificate. You will see a similar message from Pipeline if that happens:
2017/11/17 15:51:20 grpc: Server.Serve failed to complete security handshake from "10.30.110.43:58954": remote error: tls: bad certificate
This is everything you need to know to have gRPC Dial-OUT (TLS) mode up and running!
Pipeline: gRPC Dial-IN (no TLS)
gRPC provides a possibility for a collector to dial-in to a router and to request Telemetry data to be streamed out. This mode could be convenient for you if you want to have a centralized way of making configurations in your network and requesting operational data.
There are several changes needed on the router side to support Dial-IN mode.
First, you need to make sure that there is a port opened for a gRPC session:
grpc
 port 57500
  address-family ipv6     ## this is only needed if you plan to use IPv6
The port number specified under gRPC configuration should be equal to the port configured at your collector (Pipeline). Our example is based on IPv6, so, it has to be specified under gRPC configuration as well (skip that line for IPv4 case).
When Pipeline connects to a router, it needs to be authenticated. In other words, Pipeline needs to provide a login/password pair that has proper rights within a router. There are a good overview and description about Pipeline authentication in our previous tutorial. To make things simpler and faster, let’s just create a login/password pair and add “root-lr” group:
username
 group root-lr
 group cisco-support
 secret 5 $1$uuqh$Pl5K1G.aaZUtPlV4LouAk/
After you committed mentioned configurations, rest of Telemetry configuration is similar to other cases:
telemetry model-driven
 sensor-group health
  sensor-path Cisco-IOS-XR-shellutil-oper:system-time/uptime
 !
 subscription health
  sensor-group-id health sample-interval 5000
As you can see, there is no “Destination Group” part needed. That is correct and expected for Dial-IN mode, as encoding and subscription to use will come within the gRPC call. Here is how the Pipeline configuration for Dial-IN (no-TLS) with KV-GPB encoding mode looks like:
[grpc_in_mymdtrouter]
stage = xport_input
type = grpc      			## transport is gRPC
encoding = gpbkv  			## Key-Value GPB encoding
encap = gpb				## use “gpb” for both, compact and key-value GPB
server = [2500::3]:57500   		## IP address and port of the router
subscriptions = health     		## specify the subscription to be used (it has to be configured)
tls = false        			## no TLS
There are a couple of things worth your attention:
- Transport is always “grpc” (the only protocol that supports Dial-IN).
- The port number should be identical to the port number configured on your router. (For IPv4 addresses you don’t need to include square brackets, just type: “server = IP_address:port”)
- You can specify several subscriptions, separate them with comma, e.g. “subscriptions = health1,health2,health2”
You can have different encodings for Dial-IN mode: GPB, KV-GPB and JSON. Here is how you need to configure Pipeline for different encodings in Dial-IN mode:
- GPB encoding: “encap = gpb” and “encoding = gpbcompact”
- KV-GPB encoding: “encap = gpb” and “encoding = gpbkv”
- JSON encoding: “encap = json” and “encoding = json”
Your next step is to start Pipeline. After you start it, you will be asked to enter the login/password pair for the router (the same as defined on your router):
$ bin/pipeline -config pipeline.conf

Startup pipeline
Load config from [pipeline.conf], logging in [pipeline.log]

CRYPT Client [grpc_in_mymdtrouter], [[2500::3]:57500]
 Enter username: cisco
 Enter password:
Wait for ^C to shutdown
If you don’t want to have this step (with manual typing), you can store the login/password pair in the “pipeline.conf” file, but you won’t be able to have passwords stored in clear text. There is a way how to encrypt passwords in the “pipeline.conf” file, the full description is here. If the gRPC call was successful you will see a similar output on the screen (Pipeline should be in debug mode):
INFO[2017-11-15 16:51:09.093983] gRPC: Connected codec=gpb encap=gpb encodingRequest=gpbkv name="grpc_in_mymdtrouter" server=[2500::3]:57500 subscriptions=[health] tag=pipeline type="pipeline is CLIENT" username=cisco
And you also can additionally check the state on the router:

This is everything you need to know to have gRPC Dial-IN (no TLS) mode up and running!
Pipeline: gRPC Dial-IN (TLS)
In Dial-IN mode, Pipeline acts as the “client” in the TLS handshake. Therefore, the router will need to send a certificate to authenticate itself to Pipeline. As with the previous mode, you need to configure a gRPC port on the router, but this time you need to add “tls” support:
grpc
 port 57500
 tls
After you commit this gRPC with TLS configuration, the router will generate a self-signed certificate that you need to copy to the server running Pipeline:
RP/0/RP0/CPU0:NCS5502_bottom#run
Fri Nov 17 20:54:21.285 PST
[xr-vm_node0_RP0_CPU0:~]$cd /misc/config/grpc
[xr-vm_node0_RP0_CPU0:/misc/config/grpc]$ls
dialout  ems.key  ems.pem   ## copy ems.pem to the server with Pipeline
To copy, you can use a standard SCP command from Linux:
[xr-vm_node0_RP0_CPU0:/misc/config/grpc]$scp ems.pem your_username@pipeline_server:/some/remote/directory
Rest of the configuration stays the same as in previous gRPC dial-IN no TLS mode.
Here is how the Pipeline configuration looks like:
[grpc_in_mymdtrouter]
stage = xport_input
type = grpc
encoding = gpbkv
encap = gpb
server = 10.30.110.43:57500
subscriptions = health
tls = true 					## TLS is enabled
tls_pem = /somepath/ems.pem	 		## specify the path to the ems.pem certificate
tls_servername = ems.cisco.com			## specify the name
This example is based on IPv4 configuration, just to show the difference with previous scenarios. Configuration stays as with gRPC Dial-IN (no TLS) mode, but this time you need to activate TLS mode and define the path for the certificate.
After you start Pipeline and enter the login/password pair, you will see similar logging messages:
INFO[2017-11-17 21:11:42.987607] setup authentication                          authenticator="10.30.110.43:57500" name=grpcdialout pem= tag=pipeline username=cisco
DEBU[2017-11-17 21:11:42.987942] Conductor watching for shutdown...            config=pipeline.conf debug=true logfile= tag=pipeline
INFO[2017-11-17 21:11:42.988039] gRPC starting block                           encap=gpb encodingRequest=gpbkv name=grpcdialout server=10.30.110.43:57500 subscriptions=[health] tag=pipeline type="pipeline is CLIENT" username=cisco
INFO[2017-11-17 21:11:42.988976] gRPC: Connected                               codec=gpb encap=gpb encodingRequest=gpbkv name=grpcdialout server=10.30.110.43:57500 subscriptions=[health] tag=pipeline type="pipeline is CLIENT" username=cisco
INFO[2017-11-17 21:11:43.024879] gRPC: Subscription handler running            encap=gpb encodingRequest=gpbkv name=grpcdialout reqID=7821695275122717908 server=10.30.110.43:57500 subscription=health subscriptions=[health] tag=pipeline type="pipeline is CLIENT" username=cisco
And you can additionally check the state on the router: 
This is everything you need to know to have gRPC Dial-IN (TLS) mode up and running!
This section concludes information about input modules. Let’s talk now about output modules you can have in Pipeline.
Pipeline: out to “dump.txt”
There are several ways how you can configure the data to be pushed out of Pipeline. When you just start exploring Pipeline, dumping to a file might be the best option to start with. You will be able to see the content of the data your router is streaming out and it will be easier for you to move on with a TSDB. Dumping to a file is active by default when you download Pipeline. In that mode every Telemetry packet is transformed by Pipeline and written to the “dump.txt” file. This file needs to be created (manually) before any information will be written there. Here is the Pipeline configuration for the mode:
[inspector]
stage = xport_output
type = tap
file = /home/pipeline/bin/dump.txt     		## the full path to the file is needed
encoding = json
## countonly = false
As you can see, the configuration is simple. There are several important comments about this mode:
- You need to specify the full path to the “dump.txt” file and this file needs to be created before Pipeline is started. Otherwise, you won’t see anything.
- There is an option to disable telemetry data transformation, while still keeping the connection with the router in UP mode and just count the number of Telemetry packets coming in. That mode is useful when you want to test Telemetry speed and don’t want to troubleshoot slow processing on the server running Pipeline. To enable this mode, change “countonly = false” to “countonly = true”.
Here is an example of a successful record in the “dump.txt” file from the syslog sensor path:
Summary: GPB(common) Message [10.30.110.41:60914(NCS5501_top)/Cisco-IOS-XR-infra-syslog-oper:syslog/messages/message msg len: 2214]
{
    "Source": "10.30.110.41:60914",
    "Telemetry": {
        "node_id_str": "NCS5501_top",
        "subscription_id_str": "test",
        "encoding_path": "Cisco-IOS-XR-infra-syslog-oper:syslog/messages/message",
        "collection_id": 72000,
        "collection_start_time": 0,
        "msg_timestamp": 1516238643814,
        "collection_end_time": 1516238643814
    },
    "Rows": [
        {
            "Timestamp": 1516238643811,
            "Keys": {
                "message-id": 1600
            },
            "Content": {
                "card-type": "RP",
                "category": "SECURITY",
                "group": "SSHD",
                "message-name": "INFO_USER_LOGOUT",
                "node-name": "0/RP0/CPU0",
                "process-name": "SSHD_",
                "severity": "message-severity-informational",
                "text": "SSHD_[68638]: %SECURITY-SSHD-6-INFO_USER_LOGOUT : User 'cisco' from '10.154.161.88' logged out on 'vty20' \n",
                "time-of-day": "Jan 17 17:24:00.240 : ",
                "time-stamp": 1516238640000,
                "time-zone": "PST"
            }
        },
Looking through the content of the “dump.txt” file can give you a picture of the counters that your router is streaming out.
Please be aware that if you stream a lot of data at very high speed, the “dump.txt” will consume a lot of space (there is no compression involved, as in time series databases, and text is stored as is).
This is everything you need to know about pushing data to the “dump.txt” file mode configuration!
Pipeline: out to InfluxDB
The most popular option is to stream data into InfluxDB (a time series database or TSDB). It is the place where you will store telemetry data to be retrieved later by other tools, like Grafana. InfluxDB and Grafana configuration explanation will be covered in a separated tutorial later. If you want to get some initial information right now, please have a look here.
Pipeline configuration for InfluxDB is pretty straightforward:
[metrics_influx]
stage = xport_output
type = metrics   			## specify the type of the file to be used to select data to be accepted into the TSDB
file = /home/pipeline/metrics.json  	## define the location of this file
datachanneldepth = 10000  		## optionally, specify a buffer for the data
output = influx  			## destination is InfluxDB
influx = http://10.30.110.38:8086  	## address and port of InfluxDB (can be IPv6 as well)
database = mdt_db    			## the database within InfluxDB (you will have to create it)
workers = 15    			## a number of threads working internally (bigger means more threads to be activated)
#dump = metricsdump.txt    		## a local dump file for InfluxDB
As you can see, the configuration of Pipeline for InfluxDB is pretty straightforward. There are several moments that need your attention:
- You should specify the full path to the “metrics.json” file.
- Everything not defined in “metrics.json” will be dropped and not inserted into InfluxDB.
- You need to specify a specific database inside InfluxDB. The database is not created by itself, as soon as you get InfluxDB installed, you should create this database.
- When you just start testing InfluxDB it might be helpful to enable local logging of all the data inserted into the database (enabling “dump”). You will be able to quickly check that your “metrics.json” file was correct and all needed information is there (Later on, as you feel more confident, you will be able just to get directly into InfluxDB and check information right there, using InfluxDB Query language that is pretty similar to SQL and easy to use).
Please be aware that if you stream a lot of data at very high speed, the “metricsdump.txt” file will consume a lot of space (there is no compression involved and text is saved as a string, while InfluxDB does an efficient compression data while storing).
This is everything you need to know to start pushing data to InfluxDB and have it up and running!
Pipeline: out to Prometheus
The second possible time series database is Prometheus. Prometheus, by default, prefers a pull based metrics collection. It means, that Prometheus will periodically collect metrics and store it in its database. Such method is not that aligned with goals of telemetry and, so, you need to add one more tool that will push metrics directly to Prometheus. This tool is PushGW. With that information in mind, we can proceed to the Pipeline configuration:
[metrics_influx]
stage = xport_output
type = metrics     				## specify the type of the file to be used to select data to be accepted into the TSDB
file = /home/pipeline/metrics.json  	        ## define the location of this file
datachanneldepth = 10000    			## optionally, specify a buffer for the data
output = prometheus  				## this is where you specify that the destination is Prometheus
pushgw = 10.30.110.38:9091    			## address and port of PushGW
jobname = telemetry  				## Specify a jobname to be used
statsensorcount = 1000    			## must be set for any stats to be exported
As you can see, nothing is so hard here. This is everything you need to know to start pushing data to Prometheus and have it up and running!
Pipeline: out to Kafka
The last option for Pipeline that will be covered is how to stream data into Kafka bus. It might be useful if you just want to stream the data somewhere and have several your clients to connect to it. In this case, you push your transformed data to the bus and then consumers subscribe to it.
Here is the config of Pipeline to push data to Kafka:
[output_kafka]
stage = xport_output
type = kafka           			## specify the type of the output
encoding = json  			## JSON is used as the encoding
brokers = 10.30.110.38:32768  		## specify a Kafka broker
topic = telemetry			## specify a name of the topic
This is everything you need to know to start pushing data to Kafka bus and have it up and running!
So many ways… what is the best one?
There are many options in Pipeline available for you. This tutorial was created to help you to understand Pipeline better, its benefits and possibilities. If you feel yourself a bit lost and thinking about the best way to start with, then try to look at this stack: IOSXR->Pipeline->InfluxDB->Grafana. It was proved through many trials and pretty easy to make it up and running.
Conclusion
Pipeline is a lightweight, yet a very powerful tool that you can download and start using today. It gives you the flexibility to explore telemetry, to understand how it works and what are the benefits behind the speed and wide coverage of YANG models. There are still many questions left unanswered and we will do our best to make sure that you have a detailed explanation of everything you might need for this exciting journey into [near] real-time monitoring and automation. In our next tutorials, we will cover what you should expect when you activate Telemetry, how Telemetry works internally and interesting use cases that you will be able to download and try by yourself. Stay with us!
Leave a Comment