
IOS XR Telemetry Collection Stack Intro
Throughout all our posts here, in XRDOCS/Telemetry, we have been mostly talking about different sides of Telemetry from a router perspective. All the IOS XR MDT configuration basics were covered here. As soon as you’re done with your basic understanding of Telemetry configuration, you might want to increase the depth of your knowledge and have a look at how Telemetry works internally in different releases. Right at this point, you might ask yourself how you can start collecting telemetry, and you should spend some time reading this document. It explains in-depth Pipeline, an open-sourced collector from Cisco. So far so good, but there is a big step missing. What can and should you do with that all your Telemetry data? How can you process all the data coming out from Pipeline? This is the last step in your Telemetry journey, but a big one. In this post we will share information about an open-sourced solution stack for consuming IOS XR Telemetry. The goal is to explain you every component of the IOS XR Telemetry Collection Stack and provide you a script to make your installation easier.
The IOS XR Telemetry Collection Stack Overview
The goal of the IOS XR Telemetry Collection Stack is to get the counters from a router using Model Driven Telemetry and SNMP, to store them in a database and visualize in a graphical tool. SNMP counters collection was added to this stack based on several suggestions we got from different discussions. As an example, you will be able to use that to compare performance, speed, and CPU load between XR Telemetry and SNMP (especially when you bring up several servers with mentioned SNMP collectors).
The IOS XR Telemetry Collection Stack has this architecture:

The Collection Stack has several major components:
- Pipeline – a tool responsible for the termination of Telemetry streams and conversion to several different formats, acceptable by next layers.
- Telegraf – is a part of InfluxData portfolio and is an agent responsible for polling different metrics (SNMP for our goals). It will also monitor utilization of the server resources.
- Prometheus – a popular Time Series Databases or TSDB. The role of the database will be to monitor Pipeline and its resources.
- InfluxDB – is a TSDB that will be used as the main data store for all your Telemetry and SNMP counters.
- Kapacitor – is a data processing engine. It will have a role of an alert generator (with Slack as the destination for alerts)
- Grafana – a visualization tool to show graphs and counters you are getting from a router.
Pipeline Overview
Pipeline is the first stop for IOS XR Telemetry traffic. After converting incoming traffic from a router, it will forward all the data to the configured consumers. Pipeline was described in details in our previous post.
Within the Collection Stack Pipeline will accept TCP and gRPC streams, convert and push data to the InfluxDB database. It will also have internal monitoring done through Prometheus (a very convenient way to control the load of Pipeline). You will also be able to activate a “troubleshooting mode”, where you get all your incoming data dumped into a file (useful for troubleshooting purposes).
Version used: 1.0.0
Telegraf Overview
Telegraf is an agent for collecting and forwarding metrics and is a part of the InfluxData TICK stack. Telegraf has several input plugins to get metrics directly from the system it’s running on, as well as from different remote devices (we mostly will be interested in SNMP). It also has several output plugins to send metrics to a variety of databases (we only will be interested in “InfluxDB” output plugin). This agent is similar to Pipeline, except it has a different set of incoming and outgoing consumers! Telegraf is written in Go and pretty flexible. You may want to follow release notes, to always be up to date with the latest enhancements (the latest version at the time of writing is 1.6, make sure you’re checking the most recent release)
For our Telemetry Collection Stack, Telegraf will be used as the SNMP poller. It will have several OIDs pre-configured for you. Telegraf will also monitor the server, where the Collection Stack is installed.
A lot of information is available at the official company web site. If you’re struggling with the understanding of a plugin, feel free to use their GitHub page with detailed description for each type of a module.
Version used: 1.5.3
Prometheus Overview
Prometheus is yet another popular open-sourced database that is a part of the XR Telemetry Collection Stack. Prometheus was developed at SoundCloud back in 2012 and has had several releases since that time.
While Pipeline can use Prometheus as the primary database to store all telemetry data, that TSDB will be used for Pipeline monitoring only. It is essential to understand how well Pipeline is operating and control the processing load, to make sure we do not meet a situation with more data coming in that the tool can process. You can find information about the product at their official web site.
Version used: 1.5.2
InfluxDB Overview
InfluxDB is the main data store for all the Telemetry data as well as SNMP counters coming from your router. It is also a part of the InfluxData TICK stack. InfluxDB is a data store written in Go specifically for time series data. InfluxDB works pretty fast. That is important, as when it comes to consuming Telemetry data, write and read performance are important. InfluxDB has several internal compression algorithms to optimize hard disk space usage with your data. It also offers a SQL-like query, intuitive language for interacting with data.
Within our Telemetry Collection Stack, InfluxDB will collect and store all counters coming with Telemetry and SNMP. It also will provide stored information to Grafana for visualization and to Kapacitor for alerts generation.
A lot of detailed information can be found at their official web site
Version used: 1.5.1
Kapacitor Overview
Kapacitor is the final component of the InfluxData TICK stack used in our XR Telemetry Collection Stack. The primary role of the Kapacitor is to generate alerts. It queries data from InfluxDB database according to the configured rules and can generate an alert based on configured user-defined functions and thresholds. Kapacitor can send alerts to a big number of different handlers. In our case, Kapacitor is configured to send messages to a Slack Channel. Kapacitor can also perform other actions and even push data back to InfluxDB (example for this mode will be provided in upcoming tutorials).
A lot of detailed information can be found at their official web site.
Version used: 1.4.1
Grafana Overview
Grafana is a very popular tool for building dashboards and graphs. Within the Telemetry Collection Stack, it will be the primary end user consumer of data. Grafana is a lightweight tool that can use a big number of different databases, including InfluxDB and Prometheus, used in the Telemetry Collection Stack. Grafana has several of versions, and every new one adds a set of interesting benefits, so, it might be useful to check the release notes periodically.
The IOS XR Telemetry Collection Stack has several pre-configured dashboards to visualize different counters streamed from a router. In our next tutorials we will add other different use cases and provide corresponding dashboards for you.
Version used: 5.0.3
We have a basic understanding now of all the components and their roles within the IOS XR Telemetry Collection Stack, let’s move on to the script itself!
IOS XR Collection Stack Installation Steps
The goal of this section is to describe all steps needed to make it easy for you to follow. This procedure assumes you have a freshly installed Ubuntu server. This code was tested on Ubuntu 16.04.2 LTS (4.4.0-62-generic) “Xenial Xerus”. You may want to try another version of Ubuntu, but you might end up with making minor fixes.
Follow these basic steps to have the described stack up and running:
- Download the Collection Stack repo on your server. [cd ~ && wget https://github.com/vosipchu/XR_TCS/archive/master.zip]
- Install ZIP, extract the archive, rename the directory (sudo apt-get -y install zip && unzip master.zip && mv XR_TCS-master IOSXR-Telemetry-Collection-Stack)
- Run the “init.sh” script from that directory (~/IOSXR-Telemetry-Collection-Stack/init.sh) and log off.
- Log in back and update the “BuildUP-help.doc” file from that directory (nano ~/IOSXR-Telemetry-Collection-Stack/BuildUP-help.doc). See how to update the document right below.
- Run the main script (sudo ~/IOSXR-Telemetry-Collection-Stack/IOS-XR-Telemetry-BuildUP-stack.sh < ~/IOSXR-Telemetry-Collection-Stack/BuildUP-help.doc)
- The final step, run the “wrappers.sh” script (~/IOSXR-Telemetry-Collection-Stack/wrappers.sh) and log off / log in again.
At the step number four, you need to update the document with variables, according to your needs, as those inputs will be used throughout the script. Please, do not change the structure or add/remove words. Here is the content of the document:
#YOUR_PROXY_SERVER:
http://proxy-server.com:80/
#YOUR_FIRST_NTP_SERVER:
time1.google.com
#YOUR_SECOND_NTP_SERVER:
time2.google.com
#YOUR_THIRD_NTP_SERVER:
time3.google.com
#MDT_DB_RETENTION_TIME(HOURS)
168
#MDT_DB_SHARDS(HOURS)
6
#TELEGRAF_RETENTION_TIME(HOURS)
96
#TELEGRAF_SHARDS(HOURS)
3
#ROUTER_ADDRESS_FOR_SNMP
10.10.10.10
#SNMP_COMMUNITY
public
#YOUR_SERVER_IP_ADDRESS
10.20.20.20
#YOUR_SLACK_TOKEN_ID
T00000000/B00000000/XXXXXXXXXXXXXXXXXXXXXXXX
#YOUR_SLACK_CHANNEL
cpu_notifications
#YOUR_SLACK_USERNAME
Telemetry_Bot
#GRAFANA_USER
admin
#GRAFANA_PASSWORD
admin
You need to modify words in blue color. Let’s go line by line:
- If you have a Proxy Server configured, update the URL of the proxy. If you don’t, just comment out this line (add “#” at the beginning).
- You should update information about your NTP servers. It is very important that your router and your server are in sync, in order to properly resolve timestamps in telemetry packets and show you the correct information. (If you have less than 3 NTP servers, just comment out unneeded ones).
- Next four lines are for two databases created inside InfluxDB, “mdt_db” (for telemetry data) and “telegraf” (for SNMP data). For every database you need to specify two values (or leave as configured):
- Retention time (this is the total time you will have your data store before it will be overwritten. The default is 168h/7days, for Telemetry and 96h/4days for SNMP counters)
- Shard duration (a database is sliced into shards). Here you specify the size of the slice. Default is 6h for Telemetry and 3h for SNMP counters. Information within a database will be overwritten in a shard by shard mode.
- The next two lines define the IP address of a router and the SNMP community for the SNMP part of the XR Telemetry Collection Stack. If you don’t want to have SNMP and compare it with Telemetry in the same tool, just leave as is. Telegraf will start, monitor the server and get no data for SNMP.
- There is an integration with Slack for alerts coming from Kapacitor, and is seen as an introduction to many different possibilities you can have. If you don’t have or need this, leave as is, it will not harm.
- If you want to change the default login/password pair for Grafana (to protect from improper access), you can do it in the last two lines of the document with variables.
That’s it! This is all you need to know to have the IOS XT Telemetry Collection Stack up and running! If you’re interested in details of the script, jump here after finishing this tutorial!
What You Will Get with the Collection Stack
The IOS XR Telemetry Collection Stack is working now. There will be several things available for you:
- Configs for your router
- A set of different pre-configured dashboards for monitoring
- An alerting capability for CPU monitoring
- A collection of alias commands to improve your experience while working with the components of the Stack
MDT Config For Your Router
Before you can start exploring Telemetry in your installed Telemetry Collection Stack, you need to configure a router to begin streaming telemetry data. There are several configuration files available for you here:
~/IOSXR-Telemetry-Collection-Stack/Routers
You will see four different files there. Two (TCP/gRPC transport) for ASR9k and two for NCS5500 (TCP/gRPC transport). Configurations are different because a sensor path for memory stats is different between both platforms (and the goal was to have exact configs you can copy/paste without thinking a lot). Let’s go through the NCS55xx gRPC-based Model-Driven Telemetry configuration. This first step defines the destination for the telemetry traffic. All the script works with IPv4 traffic. IPv6 addressing is supported, but it was never asked for (if required, can be added in the next release). The script will update the destination address for you, all you need is to copy that part:
telemetry model-driven
 destination-group DGroup1
  address-family ipv4 YOUR_IP_ADDR port 57500
   encoding self-describing-gpb
   protocol grpc no-tls
  !
The second step configures all sensor groups. Your router will collect and push information about:
- CPU utilization
- Memory consumption (ASR9k uses a different YANG model for memory)
- Time since last reboot
- Latest interface counters
- Interfaces summary information (how many interfaces are up, down or admin-down)
- RX/TX power levels from optics (ASR9k supports this YANG model starting with IOS XR 6.4.1)
- ISIS routes count
- ISIS neighbors’ state, ISIS interfaces, dropped frames
- Information about BGP (path count, prefix count, BGP neighbors)
- MPLS-TE Tunnels summary overview
- RSVP control messages overview
- RSVP bandwidth allocation per interface.
 sensor-group health
  sensor-path Cisco-IOS-XR-wdsysmon-fd-oper:system-monitoring/cpu-utilization
  sensor-path Cisco-IOS-XR-nto-misc-oper:memory-summary/nodes/node/summary
  sensor-path Cisco-IOS-XR-shellutil-oper:system-time/uptime
 !
 sensor-group interfaces
  sensor-path Cisco-IOS-XR-infra-statsd-oper:infra-statistics/interfaces/interface/latest/generic-counters
  sensor-path Cisco-IOS-XR-pfi-im-cmd-oper:interfaces/interface-summary
 !
 sensor-group optics
  sensor-path Cisco-IOS-XR-controller-optics-oper:optics-oper/optics-ports/optics-port/optics-info
 !
 sensor-group routing
  sensor-path Cisco-IOS-XR-clns-isis-oper:isis/instances/instance/levels/level/adjacencies/adjacency
  sensor-path Cisco-IOS-XR-clns-isis-oper:isis/instances/instance/statistics-global
  sensor-path Cisco-IOS-XR-ip-rib-ipv4-oper:rib/vrfs/vrf/afs/af/safs/saf/ip-rib-route-table-names/ip-rib-route-table-name/protocol/isis/as/information
  sensor-path Cisco-IOS-XR-ipv4-bgp-oper:bgp/instances/instance/instance-active/default-vrf/process-info
 !
 sensor-group mpls-te
 sensor-path Cisco-IOS-XR-mpls-te-oper:mpls-te/tunnels/summary
 sensor-path Cisco-IOS-XR-ip-rsvp-oper:rsvp/interface-briefs/interface-brief
 sensor-path Cisco-IOS-XR-ip-rsvp-oper:rsvp/counters/interface-messages/interface-message
 !
The last part of the config defines subscription groups. Several subscription groups are used to use the benefits of parallel push. As always, make sure you have L3 connectivity between your router and collector (don’t forget to check L3 connectivity from TPA as well!)
 subscription health
  sensor-group-id health strict-timer
  sensor-group-id health sample-interval 30000
  destination-id DGroup1
 !
 subscription interfaces
  sensor-group-id interfaces strict-timer
  sensor-group-id interfaces sample-interval 30000
  destination-id DGroup1
 !
 subscription optics
  sensor-group-id optics strict-timer
  sensor-group-id optics sample-interval 30000
  destination-id DGroup1
 !
 subscription routing
  sensor-group-id routing strict-timer
  sensor-group-id routing sample-interval 30000
  destination-id DGroup1
 !
 subscription mpls-te
  sensor-group-id mpls-te strict-timer
  sensor-group-id mpls-te sample-interval 30000
  destination-id DGroup1
Pre-configured Dashboards
You have your Collection Stack up and running. Your router has the proper configuration applied and pushing counters out. You can now jump directly to Grafana to check the dashboards available to you!
To start, please, type in your browser of choice: http://
After logging in, you will see the homepage. Click the “Home” menu on your top left, and you will see five folders with different dashboards prepared for you. Let’s go through every folder:
- InfluxDB Monitoring folder: contains the “InfluxDB Metrics” and “InfluxDB-Internal” dashboards. They are helpful when it comes to an understanding how InfluxDB operates. Different graphs include write speed, query execution, data points write speed, various errors, and storage size. [InfluxDB Internal database is used for monitoring]
InfluxdDB Metrics: 
InfluxDB Internal: 
- Pipeline Monitoring folder: contains the “Pipeline Health” dashboard. This dashboard is your big helper when it comes to an understanding how well (or not) Pipeline processing the data. At some point you might want to start pushing more data to Pipeline and checking for “Decoded Messages Volume” might be important for you. [Prometheus database is used for that] It also contains the “Prometheus Stats Internal” dashboard, which allows you to check the condition of the Prometheus database. It contains a set of internal counters, and you might find it useful when it comes to monitoring that database [Prometheus database is used for that]
Pipeline Health: 
Prometheus Statistics: 
- Server Details folder: contains the “Server Monitoring” dashboard. It gives you a possibility to check different values of the server where you have the IOS XR Telemetry Collection Stack up and running. The dashboard provides counters, such as CPU load, hard drive free space, DRAM and system load. [InfluxDB Telegraf database is used for that]
Server Monitoring: 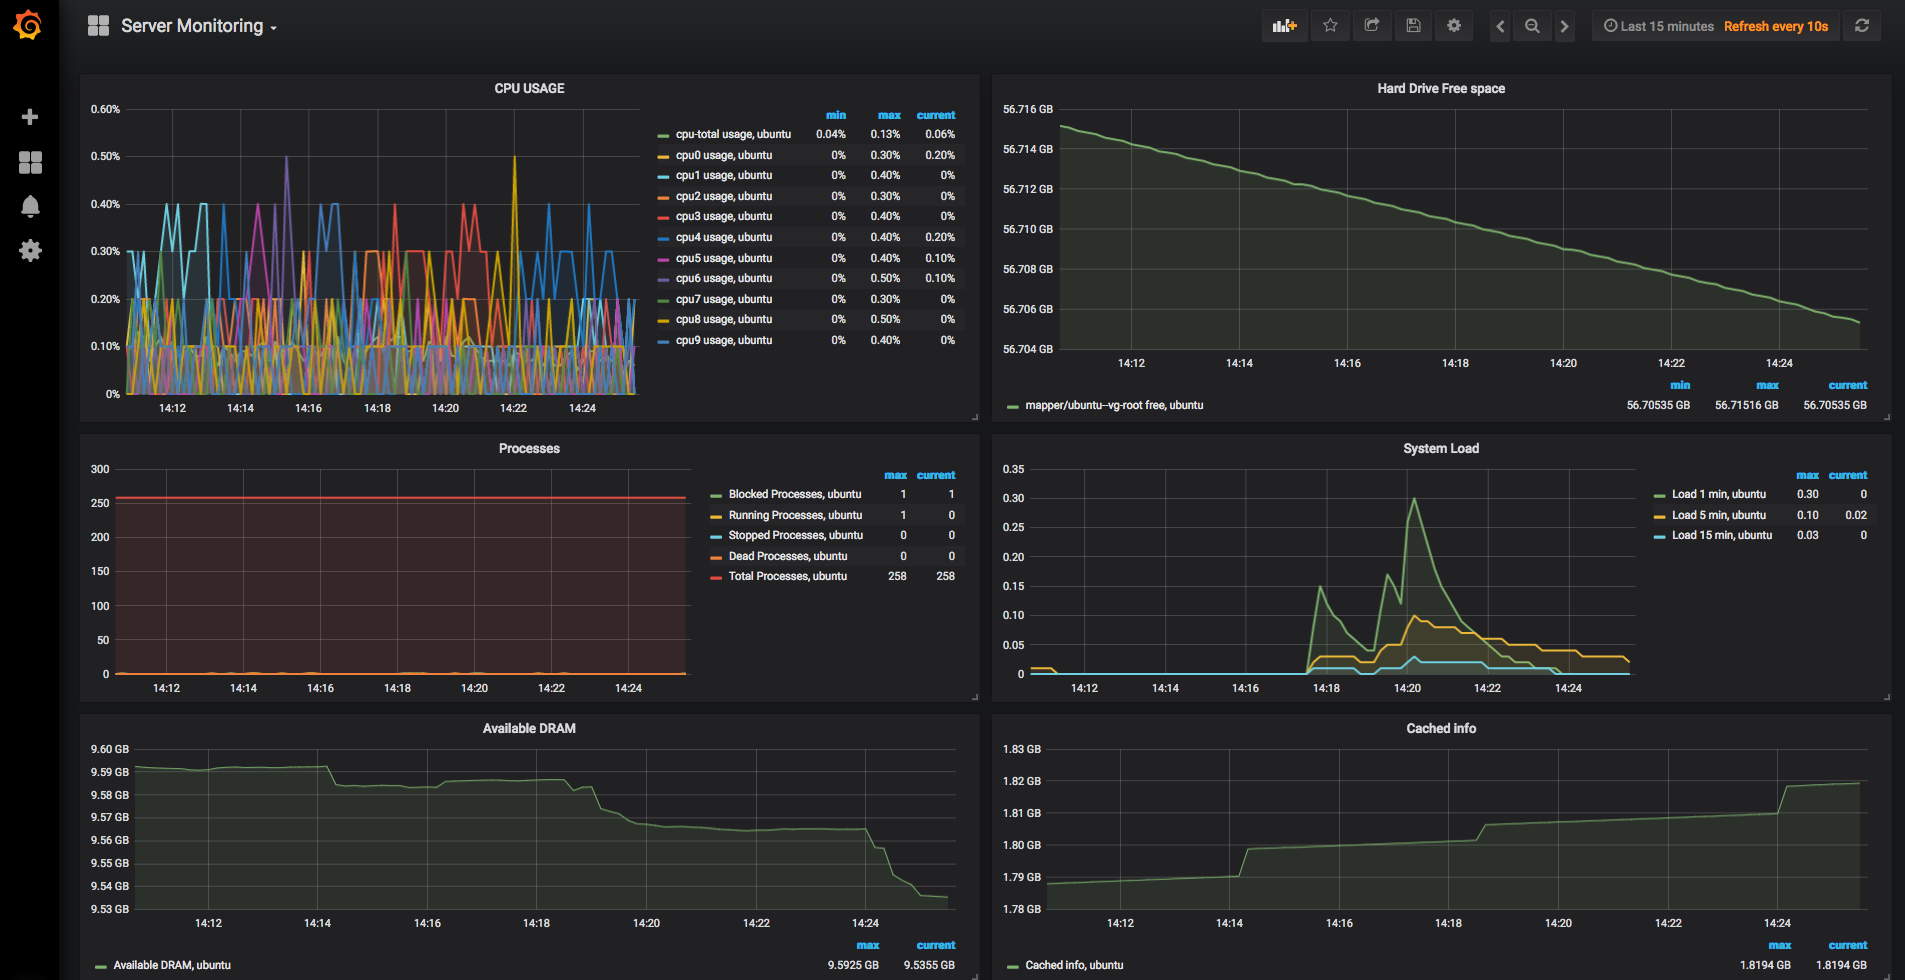
SNMP (Telegraf) folder: contains “Influx-SNMP” dashboard that gives you several graphs built by SNMP counters:
- CPU Load
- Memory information
- Interface speed
- Inventory info
- BGP accepted/advertised/denied/withdrawn prefixes
- MPLS tunnels details
[InfluxDB Telegraf database is used for that]
SNMP Counters: 
- XR-Telemetry folder: contains the “Device_Health_Check_Demo” dashboard. This dashboard gives you a set of different graphs built by IOS XR Telemetry counters:
- CPU utilization
- Memory information
- Uptime
- Interface summary
- Interfaces rate
- Drops counter
- Optics TX/RX power levels and lase bias current
- ISIS Routing information
- BGP Routing information
- MPLS Tunnels information
[InfluxDB mdt_db database is used for that]
XR Telemetry counters: 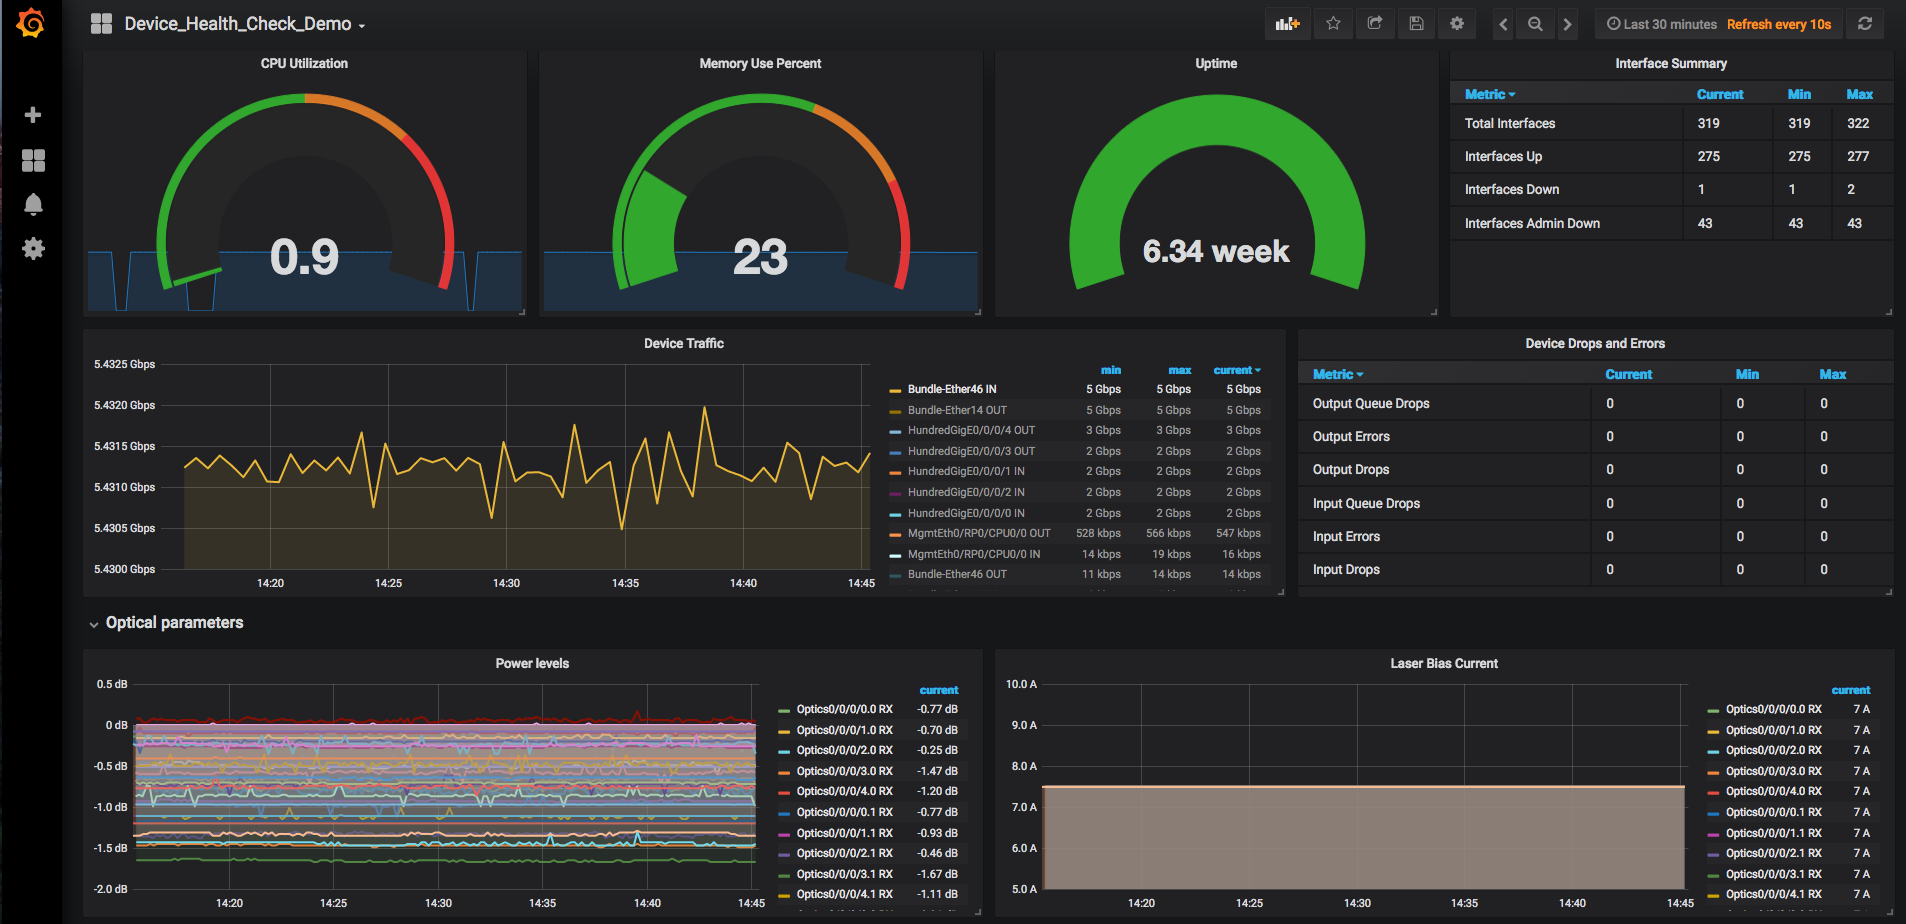
Alerting Tool
The Collection Stack also has an alerting system builtin. An example TICK script is configured as an introduction to the alerting capabilities within the Telemetry Collection Stack. You can find all the scripts running in Kapacitor with this command (it will be just one script running):
cisco@ubuntu:~$ kapacitor list tasks
ID                Type      Status    Executing Databases and Retention Policies
CPU-ALERT-ROUTERS stream    enabled   true      ["mdt_db"."autogen"]
When you look through that TICK script, you should pay attention to these lines:
cisco@ubuntu51-2:~$ kapacitor show CPU-ALERT-ROUTERS | grep "|alert()" -A 6
    |alert()
        // 15 is the threshold. Crossing 15 means something is wrong
        .info(lambda: "total-cpu-one-minute" > 15)
        // Add different levels of alarms if you want
        //        .warn(lambda: "total-cpu-one-minute" > 20)
        //        .crit(lambda: "total-cpu-one-minute" > 25)
        .log('/tmp/alerts.log')
The goal of this script is to generate an info-level alert every time the CPU crosses the configured threshold (15). You can also enable the other two levels of alerting, warning and critical, by removing “//” at the beginning of lines (“//” means ignore that line). In the Collection Stack alerts are sent to the configured Slack Channel(https://docs.influxdata.com/kapacitor/v1.5/event_handlers/slack/). The Slack Channel is configured by the script. You need to insert information from the “how to integrate” steps. This information includes the name of the channel, the username, and the token. If your server with the Collection Stack is located behind a proxy, there is a chance that you might have issues with alerts being not delivered to your Slack channels. That’s why there is also an additional python script running, that accepts alerts from Kapacitor and pushing them toward the Slack channel. This pair will work in both scenarios (with and without proxy), that’s why it is a part of the script.
You should see something similar to this:

There are more examples of other TICK scripts can be found on InfluxDB GitHub page.
Slack is just one of the destinations available in Kapacitor. You can also configure sending data to Kafka, Telegram, email, etc. The full list of handlers is here
Alias Commands to Manage the Collection Stack
To make your interaction with the Stack easier, a set of alias commands is added. You will be able to operate every component of the stack in a simple way. Every time you log in to your server, you will see a “welcome screen”, showing all those basic commands for your convenience.
Here is an overview of the alias commands:
- show name_of_the_app (e.g., show grafana) – use this “show” command to check the current state of the application (working or not working). You can check influxdb, telegraf, kapacitor, prometheus, grafana and pipeline status.
- stop name_of_the_app (e.g., stop influxdb) – this command is used when you need to stop an application. For example, you’re not interested in monitoring of Pipeline operation, then, you can just stop Prometheus. It is also helpful when something goes wrong and you need to stop this. Works with all components of the Stack.
- start name_of_the_app & (e.g., start kapacitor &) – this command starts a component that you stopped previously. It should be helpful when you want to restart a component, you can just do it via “stop” and “start” commands. Don’t forget to add “&” at the end to start an element in the background. This command works with all components as well.
- pipeline troubleshooting start(stop) – use this command when you want to start (or stop) Debug Mode of Pipeline. It a normal operation, Pipeline will listen to TCP/gRPC flows and push data to InfluxDB. When you activate Debug Mode, the system will add dumping of incoming counters to the “dump.txt” file (don’t forget to stop this mode, as storing data in the “dump.txt” file consumes your hard drive space very fast).
The “welcome screen” will also include a short list of commands for your reference that you might find helpful in your first Telemetry testing steps. The list includes commands from InfluxDB and Kapacitor, as you will, most probably, interact with them pretty often.
- influx -execute “show databases” - use this command to see all the configured databases on InfluxDB.
- influx -execute “show diagnostics” - the output from this command will give you useful information about InfluxDB, such as the version, the branch, the bind-address, version of Go code, uptime and several internal configurations.
- influx -execute “show measurements” -database=”mdt_db” - use this command to see all the measurements within the specified database. This is a very convenient command to know, as it will show you a list of sensor-paths accepted by the database (in other words, if your metrics.json was configured properly, you should see all those sensor paths in that list. And you will not if there is a mistake in the metrics.json file)
- influx -execute “show retention policies” -database=”mdt_db” - a quick way to check the configured and applied retention policy for the specified database.
- influx -execute “show tag values with key=Producer” -database=”mdt_db” - output from this command will help you to find out all the routers accepted and inserted within each measurement (sensor-path) for the specific database. Can be helpful for your quick troubleshooting.
- influx -execute “SELECT "bytes-received" FROM "Cisco-IOS-XR-infra-statsd-oper:infra-statistics/interfaces/interface/latest/generic-counters" WHERE ("Producer" = ‘NCS5501_top’ AND "interface-name" = ‘Bundle-Ether12’ AND time > now() - 1m)” -database=”mdt_db” - this long command is very useful, as you can check the content of a specific series. Going left to right: specify the field you’re interested in (basically, the counters you want to check), then specify the measurement (for XR Telemetry it will be a sensor-path), then you can specify a specific router and give more details if needed (like, interface name in the example). Finally, you specify the time interval (during the last minute) and the database where to look for (mdt_db). The result will contain two columns: the left one with timestamps (epoch format) and the right one will contain the values (bytes-received values). [you will see how useful this info when you’re troubleshooting your work!]
- influx -execute “create database XR with duration 48h shard duration 6h” - use this command if you want to create a new database in InfluxDB. Do not forget to specify the retention time and shard duration.
- influx -execute “alter retention policy "autogen" on "XR" duration 96h” - helpful in a situation, where you want to update your retention policy on an already created database.
- influx -execute “alter retention policy "autogen" on "XR" shard duration 12h” - this command works the same as the previous one, but changes the duration of the shard.
- influx -execute “drop database XR” - use this command in case you want to remove a specific database (e.g., the one you used for tests)
- influx -execute “drop series from /.*/” -database=”XR” - a very helpful command when you want to clear all counters, all records in your specific database.
- kapacitor list tasks - use this command to check the status of the configured Kapacitor scripts (CPU alerting in our Stack.)
- kapacitor define CPU-ALERT-ROUTERS -tick ~/analytics/kapacitor/CPU-ALERT-ROUTERS.tick - the command is used to define your new Kapacitor TICK script.
- kapacitor enable CPU-ALERT-ROUTERS - the command is used to activate your new and already defined TICK script (by name).
The IOS XR Telemetry Collection Stack Removal
You installed the Collection Stack, tested Telemetry and ready to move on. You may want to remove the Stack and all the information collected and created. To ease your work and make it faster, a script was added as well. To remove the Collection Stack, please type this:
$ sudo ~/IOSXR-Telemetry-Collection-Stack/IOS-XR-Telemetry-Destroy-stack.sh
The script will go through all the installed databases and components, remove them, and remove all created/modified files. Worth to mention, Proxy, NTP and SNMP MIBs will remain installed.
You should also remove alias commands, as you won’t need them anymore. And there is also a script available for your convenience:
$ sudo ~/IOSXR-Telemetry-Collection-Stack/wrappers-remove.sh
That’s it! You just removed the IOS XR Telemetry Collection Stack from your server.
Conclusion
The purpose of the Telemetry Collection Stack is to help you with the first steps in XR Telemetry testing. You will have a working stack with different components involved in just several minutes with a minimum amount of efforts from your side, plus, you will be able to control every component in a convenient way. A set of basic dashboards was added to show you several fundamental counters you can get using Model Driven Telemetry. We plan to add more dashboards for different use cases in our next tutorials. Stay tuned!
Leave a Comment