
Is Your Infra Ready for Telemetry?
In our previous post we explained how to build your Telemetry Collection Stack using open source tools, e.g. Pipeline, InfluxDB and others. The installation code for the stack was also provided for your convenience. This Telemetry Collection Stack will be used as the basis for our future use cases to be shared here, at xrdocs.io. But there is one crucial step missing before moving forward. Whenever you start the installation of the Collection Stack, you will probably ask yourself about the characteristics of the server to be used to store and process the counters. In this post, we will try to show you the utilization of the server in our scenario. It is not meant to be a full guide to cover all possible scenarios, but it contains a pretty scaled telemetry environment, and it should give you a reasonable level of understanding on how to select your server for your telemetry needs.
Telemetry Configuration Overview
Before moving to the server side, let’s see what we have from the Telemetry side. The main router used in our testing was NCS5501 with IOS XR 6.3.2. The following sensors were configured:
sensor-group fib
 sensor-path Cisco-IOS-XR-fib-common-oper:fib-statistics/nodes/node/drops
 sensor-path Cisco-IOS-XR-fib-common-oper:fib/nodes/node/protocols/protocol/vrfs/vrf/summary
!
sensor-group brcm
 sensor-path Cisco-IOS-XR-fretta-bcm-dpa-hw-resources-oper:dpa/stats/nodes/node/hw-resources-datas/hw-resources-data
 sensor-path Cisco-IOS-XR-fretta-bcm-dpa-hw-resources-oper:dpa/stats/nodes/node/npu-numbers/npu-number/display/trap-ids/trap-id
 sensor-path Cisco-IOS-XR-fretta-bcm-dpa-hw-resources-oper:dpa/stats/nodes/node/asic-statistics/asic-statistics-for-npu-ids/asic-statistics-for-npu-id
!
sensor-group health
 sensor-path Cisco-IOS-XR-shellutil-oper:system-time/uptime
 sensor-path Cisco-IOS-XR-pfi-im-cmd-oper:interfaces/interface-summary
 sensor-path Cisco-IOS-XR-wdsysmon-fd-oper:system-monitoring/cpu-utilization
 sensor-path Cisco-IOS-XR-nto-misc-oper:memory-summary/nodes/node/summary
!
sensor-group optics
 sensor-path Cisco-IOS-XR-controller-optics-oper:optics-oper/optics-ports/optics-port/optics-info
!
sensor-group mpls-te
 sensor-path Cisco-IOS-XR-mpls-te-oper:mpls-te/te-mib/scalars
 sensor-path Cisco-IOS-XR-mpls-te-oper:mpls-te/tunnels/summary
 sensor-path Cisco-IOS-XR-ip-rsvp-oper:rsvp/interface-briefs/interface-brief
 sensor-path Cisco-IOS-XR-mpls-te-oper:mpls-te/fast-reroute/protections/protection
 sensor-path Cisco-IOS-XR-mpls-te-oper:mpls-te/signalling-counters/signalling-summary
 sensor-path Cisco-IOS-XR-mpls-te-oper:mpls-te/p2p-p2mp-tunnel/tunnel-heads/tunnel-head
 sensor-path Cisco-IOS-XR-mpls-te-oper:mpls-te/fast-reroute/backup-tunnels/backup-tunnel
 sensor-path Cisco-IOS-XR-mpls-te-oper:mpls-te/topology/configured-srlgs/configured-srlg
 sensor-path Cisco-IOS-XR-ip-rsvp-oper:rsvp/counters/interface-messages/interface-message
 sensor-path Cisco-IOS-XR-mpls-te-oper:mpls-te/p2p-p2mp-tunnel/tunnel-remote-briefs/tunnel-remote-brief
 sensor-path Cisco-IOS-XR-mpls-te-oper:mpls-te/signalling-counters/head-signalling-counters/head-signalling-counter
 sensor-path Cisco-IOS-XR-mpls-te-oper:mpls-te/signalling-counters/remote-signalling-counters/remote-signalling-counter
!
sensor-group routing
 sensor-path Cisco-IOS-XR-clns-isis-oper:isis/instances/instance/statistics-global
 sensor-path Cisco-IOS-XR-clns-isis-oper:isis/instances/instance/neighbors/neighbor
 sensor-path Cisco-IOS-XR-ip-rib-ipv4-oper:rib/rib-table-ids/rib-table-id/summary-protos/summary-proto
 sensor-path Cisco-IOS-XR-clns-isis-oper:isis/instances/instance/levels/level/adjacencies/adjacency
 sensor-path Cisco-IOS-XR-ipv4-bgp-oper:bgp/instances/instance/instance-active/default-vrf/process-info
 sensor-path Cisco-IOS-XR-ip-rib-ipv6-oper:ipv6-rib/rib-table-ids/rib-table-id/summary-protos/summary-proto
 sensor-path Cisco-IOS-XR-ipv4-bgp-oper:bgp/instances/instance/instance-active/default-vrf/neighbors/neighbor
 sensor-path Cisco-IOS-XR-ip-rib-ipv4-oper:rib/vrfs/vrf/afs/af/safs/saf/ip-rib-route-table-names/ip-rib-route-table-name/protocol/bgp/as/information
 sensor-path Cisco-IOS-XR-ip-rib-ipv4-oper:rib/vrfs/vrf/afs/af/safs/saf/ip-rib-route-table-names/ip-rib-route-table-name/protocol/isis/as/information
 sensor-path Cisco-IOS-XR-ip-rib-ipv6-oper:ipv6-rib/vrfs/vrf/afs/af/safs/saf/ip-rib-route-table-names/ip-rib-route-table-name/protocol/bgp/as/information
 sensor-path Cisco-IOS-XR-ip-rib-ipv6-oper:ipv6-rib/vrfs/vrf/afs/af/safs/saf/ip-rib-route-table-names/ip-rib-route-table-name/protocol/isis/as/information
!
sensor-group if-stats
 sensor-path Cisco-IOS-XR-infra-statsd-oper:infra-statistics/interfaces/interface/latest/generic-counters
!
sensor-group mpls-ldp
 sensor-path Cisco-IOS-XR-mpls-ldp-oper:mpls-ldp/nodes/node/bindings-summary-all
 sensor-path Cisco-IOS-XR-mpls-ldp-oper:mpls-ldp/global/active/default-vrf/summary
 sensor-path Cisco-IOS-XR-mpls-ldp-oper:mpls-ldp/nodes/node/default-vrf/neighbors/neighbor
 sensor-path Cisco-IOS-XR-mpls-ldp-oper:mpls-ldp/nodes/node/default-vrf/afs/af/interfaces/interface
!
sensor-group openconfig
 sensor-path openconfig-bgp:bgp/neighbors
 sensor-path openconfig-interfaces:interfaces/interface
!
sensor-group troubleshooting
 sensor-path Cisco-IOS-XR-lpts-ifib-oper:lpts-ifib/nodes/node/slice-ids/slice-id
 sensor-path Cisco-IOS-XR-drivers-media-eth-oper:ethernet-interface/statistics/statistic
 sensor-path Cisco-IOS-XR-ipv4-arp-oper:arp/nodes/node/traffic-interfaces/traffic-interface
We’re streaming counters from different fields:
- health: CPU utilization, memory, uptime and interface summary stats;
- optics: RX/TX power levels for transceivers;
- if-stats: interface counters (RX/TX bytes, packets, errors, etc);
- routing: a big number of different counters from ISIS and BGP;
- fib: FIB stats;
- mpls-ldp: MPLS LDP stats (interfaces, bindings, neighbors);
- mpls-te: tons of counters about MPLS-TE tunnels and RSVP-TE;
- brcm: NPU-related counters;
- troubleshooting: a set of stats about possible errors/drops on the router;
- openconfig: stats from interfaces and BGP using OC models.
Our next step is to calculate the number of counters the router will push to the collector. This was done in several steps:
- The number of counters for every sensor path was found.
- A sensor path collects data per some element (per NPU, per neighbor, per interface, etc.), so, proper math was applied.
- The total sum of the counters is based on the number of counters multiplied by the elements count.
Here is the table with the results to show you every step and the summary:
| Telemetry Sensor Paths | Counters per path | Works per … | On the router | Streamed from the router |
|---|---|---|---|---|
| sensor-group fib | ||||
| Cisco-IOS-XR-fib-common-oper.yang –tree-path fib-statistics/nodes/node/drops | 23 | per Node | 2 | 46 |
| Cisco-IOS-XR-fib-common-oper.yang –tree-path fib/nodes/node/protocols/protocol/vrfs/vrf/summary | 85 | per Node/per Protocol | 6 | 510 |
| sensor-group brcm | ||||
| Cisco-IOS-XR-fretta-bcm-dpa-hw-resources-oper.yang –tree-path dpa/stats/nodes/node/hw-resources-datas/hw-resources-data | 22 | per Node / per table | 5 | 110 |
| Cisco-IOS-XR-fretta-bcm-dpa-hw-resources-oper.yang –tree-path dpa/stats/nodes/node/npu-numbers/npu-number/display/trap-ids/trap-id | 16 | per Node / per NPU | 2 | 32 |
| Cisco-IOS-XR-fretta-bcm-dpa-hw-resources-oper.yang –tree-path dpa/stats/nodes/node/asic-statistics/asic-statistics-for-npu-ids/asic-statistics-for-npu-id | 67 | per Node / per NPU | 2 | 134 |
| sensor-group health | ||||
| Cisco-IOS-XR-shellutil-oper.yang –tree-path system-time/uptime | 2 | per device | 1 | 2 |
| Cisco-IOS-XR-pfi-im-cmd-oper.yang –tree-path interfaces/interface-summary | 10 | per device | 1 | 10 |
| Cisco-IOS-XR-wdsysmon-fd-oper.yang –tree-path system-monitoring/cpu-utilization | 9 | per Node | 774 | 6,966 |
| Cisco-IOS-XR-nto-misc-oper.yang –tree-path memory-summary/nodes/node/summary | 10 | per Node | 2 | 20 |
| sensor-group optics | ||||
| Cisco-IOS-XR-controller-optics-oper.yang –tree-path optics-oper/optics-ports/optics-port/optics-info | 398 | per transceiver | 10 | 3,980 |
| sensor-group mpls-te | ||||
| Cisco-IOS-XR-mpls-te-oper.yang –tree-path mpls-te/te-mib/scalars | 5 | per device | 1 | 5 |
| Cisco-IOS-XR-mpls-te-oper.yang –tree-path mpls-te/tunnels/summary | 186 | per device | 1 | 186 |
| Cisco-IOS-XR-ip-rsvp-oper.yang –tree-path rsvp/interface-briefs/interface-brief | 17 | per interface | 15 | 255 |
| Cisco-IOS-XR-mpls-te-oper.yang –tree-path mpls-te/fast-reroute/protections/protection | 42 | per FRR HE tunnel | 272 | 11,424 |
| Cisco-IOS-XR-mpls-te-oper.yang –tree-path mpls-te/signalling-counters/signalling-summary | 24 | per device | 1 | 24 |
| Cisco-IOS-XR-mpls-te-oper.yang –tree-path mpls-te/p2p-p2mp-tunnel/tunnel-heads/tunnel-head | 900 | per HE tunnel | 272 | 244,800 |
| Cisco-IOS-XR-mpls-te-oper.yang –tree-path mpls-te/fast-reroute/backup-tunnels/backup-tunnel | 30 | per FRR backup tunnel | 10 | 300 |
| Cisco-IOS-XR-mpls-te-oper.yang –tree-path mpls-te/topology/configured-srlgs/configured-srlg | 7 | per device | 1 | 7 |
| Cisco-IOS-XR-ip-rsvp-oper.yang –tree-path rsvp/counters/interface-messages/interface-message | 56 | per interface | 15 | 840 |
| Cisco-IOS-XR-mpls-te-oper.yang –tree-path mpls-te/p2p-p2mp-tunnel/tunnel-remote-briefs/tunnel-remote-brief | 32 | per tunnel (RE) | 164 | 5,248 |
| Cisco-IOS-XR-mpls-te-oper.yang –tree-path mpls-te/signalling-counters/head-signalling-counters/head-signalling-counter | 81 | per tunnel (HE) | 272 | 22,032 |
| Cisco-IOS-XR-mpls-te-oper.yang –tree-path mpls-te/signalling-counters/remote-signalling-counters/remote-signalling-counter | 61 | per tunnel (RE) | 164 | 10,004 |
| sensor-group routing | ||||
| Cisco-IOS-XR-clns-isis-oper.yang –tree-path isis/instances/instance/statistics-global | 49 | per instance | 1 | 49 |
| Cisco-IOS-XR-clns-isis-oper.yang –tree-path isis/instances/instance/neighbors/neighbor | 73 | per instance / per neighbor | 5 | 365 |
| Cisco-IOS-XR-ip-rib-ipv4-oper.yang –tree-path rib/rib-table-ids/rib-table-id/summary-protos/summary-proto | 75 | per table / per protocol | 7 | 525 |
| Cisco-IOS-XR-clns-isis-oper.yang –tree-path isis/instances/instance/levels/level/adjacencies/adjacency | 88 | per instance / per level | 1 | 88 |
| Cisco-IOS-XR-ipv4-bgp-oper.yang –tree-path bgp/instances/instance/instance-active/default-vrf/process-info | 244 | per instance | 1 | 244 |
| Cisco-IOS-XR-ip-rib-ipv6-oper.yang –tree-path ipv6-rib/rib-table-ids/rib-table-id/summary-protos/summary-proto | 75 | per table / per protocol | 6 | 450 |
| Cisco-IOS-XR-ipv4-bgp-oper.yang –tree-path bgp/instances/instance/instance-active/default-vrf/neighbors/neighbor | 432 | per instance / per neighbor | 12 | 5,184 |
| Cisco-IOS-XR-ip-rib-ipv4-oper.yang –tree-path rib/vrfs/vrf/afs/af/safs/saf/ip-rib-route-table-names/ip-rib-route-table-name/protocol/bgp/as/information | 11 | per VRF/AF/SAF/TABLE/AS | 1 | 11 |
| Cisco-IOS-XR-ip-rib-ipv4-oper.yang –tree-path rib/vrfs/vrf/afs/af/safs/saf/ip-rib-route-table-names/ip-rib-route-table-name/protocol/isis/as/information | 11 | per VRF/AF/SAF/TABLE/AS | 1 | 11 |
| Cisco-IOS-XR-ip-rib-ipv6-oper.yang –tree-path ipv6-rib/vrfs/vrf/afs/af/safs/saf/ip-rib-route-table-names/ip-rib-route-table-name/protocol/bgp/as/information | 11 | per VRF/AF/SAF/TABLE/AS | 1 | 11 |
| Cisco-IOS-XR-ip-rib-ipv6-oper.yang –tree-path ipv6-rib/vrfs/vrf/afs/af/safs/saf/ip-rib-route-table-names/ip-rib-route-table-name/protocol/isis/as/information | 11 | per VRF/AF/SAF/TABLE/AS | 1 | 11 |
| sensor-group if-stats | ||||
| Cisco-IOS-XR-infra-statsd-oper.yang –tree-path infra-statistics/interfaces/interface/latest/generic-counters | 36 | per interface (physical and virtual) | 315 | 11,340 |
| sensor-group mpls-ldp | ||||
| Cisco-IOS-XR-mpls-ldp-oper.yang –tree-path mpls-ldp/nodes/node/bindings-summary-all | 18 | per Node | 2 | 36 |
| Cisco-IOS-XR-mpls-ldp-oper.yang –tree-path mpls-ldp/global/active/default-vrf/summary | 24 | per Node | 2 | 48 |
| Cisco-IOS-XR-mpls-ldp-oper.yang –tree-path mpls-ldp/nodes/node/default-vrf/neighbors/neighbor | 95 | per Neighbor | 5 | 475 |
| Cisco-IOS-XR-mpls-ldp-oper.yang –tree-path mpls-ldp/nodes/node/default-vrf/afs/af/interfaces/interface | 13 | per Node/AF/Interface | 5 | 65 |
| sensor-group openconfig | ||||
| openconfig-bgp.yang –tree-path bgp/neighbors | 81 | per neighbor | 12 | 972 |
| openconfig-interfaces.yang –tree-path interfaces/interface | 47 | per interface | 36 | 1,692 |
| sensor-group troubleshooting | ||||
| Cisco-IOS-XR-lpts-ifib-oper.yang –tree-path lpts-ifib/nodes/node/slice-ids/slice-id | 27 | per node / per slice | 105 | 2,835 |
| Cisco-IOS-XR-drivers-media-eth-oper.yang –tree-path ethernet-interface/statistics/statistic | 56 | per interface (physical and virtual) | 315 | 17,640 |
| Cisco-IOS-XR-ipv4-arp-oper.yang –tree-path arp/nodes/node/traffic-interfaces/traffic-interface | 30 | per Node/Interface | 55 | 1,650 |
| 350,637 |
The total number of counters is ~350k (if my math is correct ;) ). The biggest influencer here is the MPLS-TE headend tunnels stats sensor path. It includes tons of essential and valuable counters (IOS XR is so MPLS-TE rich!).
To double check the math the “dump.txt” file with the content from a single push from all the collections was checked:
cisco@ubuntu:~/analytics/pipeline/bin$ cat dump.txt | wc -l
482514
This file contains telemetry headers and lines without counters, so, roughly it confirms the math!
For the test purpose, the router had sample intervals equal to five seconds for every subscription. Most probably, you will use longer sample intervals for your installation. The goal of the testing was to emulate a scaled (and a reasonable worst-case) scenario. In our tests, several subscriptions were configured to gain the benefits of multithreading!
With all that information about Telemetry on the router, let’s move on!
Testing Environment Overview
Before we jump to the results, let me cover the server used and the procedure.
My testing was done on Ubuntu 16.04, running as a VMWare virtual machine:
- 10 vCPU allocated from Intel(R) Xeon(R) CPU E5-2697 v3 @ 2.60GHz.
- Intel I350 NIC is installed on the server, with 10GB negotiated speed.
- ~10G of DRAM (DDR4 / 2133Mhz)
- ~70G of SSD (allocated from 2xSM1625 800GB 6G 2.5” SAS SSD).
The purpose of the testing was to check the following on the server side:
- Total and per-process CPU utilization
- DRAM utilization
- Hard disk utilization
- Hard disk write speed
- Network bandwidth
- Pipeline processing throughput
The whole testing was done in three stages:
- A single router pushing counters (to get the initial values)
- Two routers pushing counters (to find the difference and make assumptions)
- Five routers pushing counters (to confirm the assumptions and do the final checks)
For every critical component in the Stack the goal was to collect data within a TSDB (to have the historical overview) and double check the real-time view with a command from Linux itself (even if the collector uses the same way to collect the data, it might be worth to verify that proper and correct information is really collected). Telegraf was used as the collector for the server’s counters in the testing. All proper changes needed in “/etc/telegraf/telegraf.conf” will be covered later. Telegraf was configured to request information every second (1s interval).
And now we’re fully ready to jump over to the results!
Step One: One Router
At this step there was just a single router pushing ~350k counters every five seconds.
CPU Utilization
The first component to monitor is the total CPU (per core) utilization. You should have these lines in your Telegraf configuration file to have the collection active:
# Read metrics about cpu usage
[[inputs.cpu]]
  ## Whether to report per-cpu stats or not
  percpu = true
  ## Whether to report total system cpu stats or not
  totalcpu = true
  ## If true, collect raw CPU time metrics.
  collect_cpu_time = false
  ## If true, compute and report the sum of all non-idle CPU states.
  report_active = false
Here is a snapshot from a dashboard with the total CPU per core usage:

One second granularity is not good enough to catch the instantaneous load of the cores, but it shows that all the cores are loaded equally, and there are spikes up to ~10-11%. (in the idle mode, before the testing, all the cores were about ~1-2%)
Per Process Load
Having a general overview is nice, but we’re more interested in our primary components from the stack: InfluxDB, Pipeline, and Grafana. Telegraf also gives you a possibility to monitor the processes load. Configure this in the Telegraf configuration file to make the collection running:
[[inputs.procstat]]
#   ## Must specify one of: pid_file, exe, or pattern
#   ## PID file to monitor process
 exe = "grafana"

[[inputs.procstat]]
exe = "telegraf"

[[inputs.procstat]]
exe = "influxd"

[[inputs.procstat]]
exe = "pipeline"
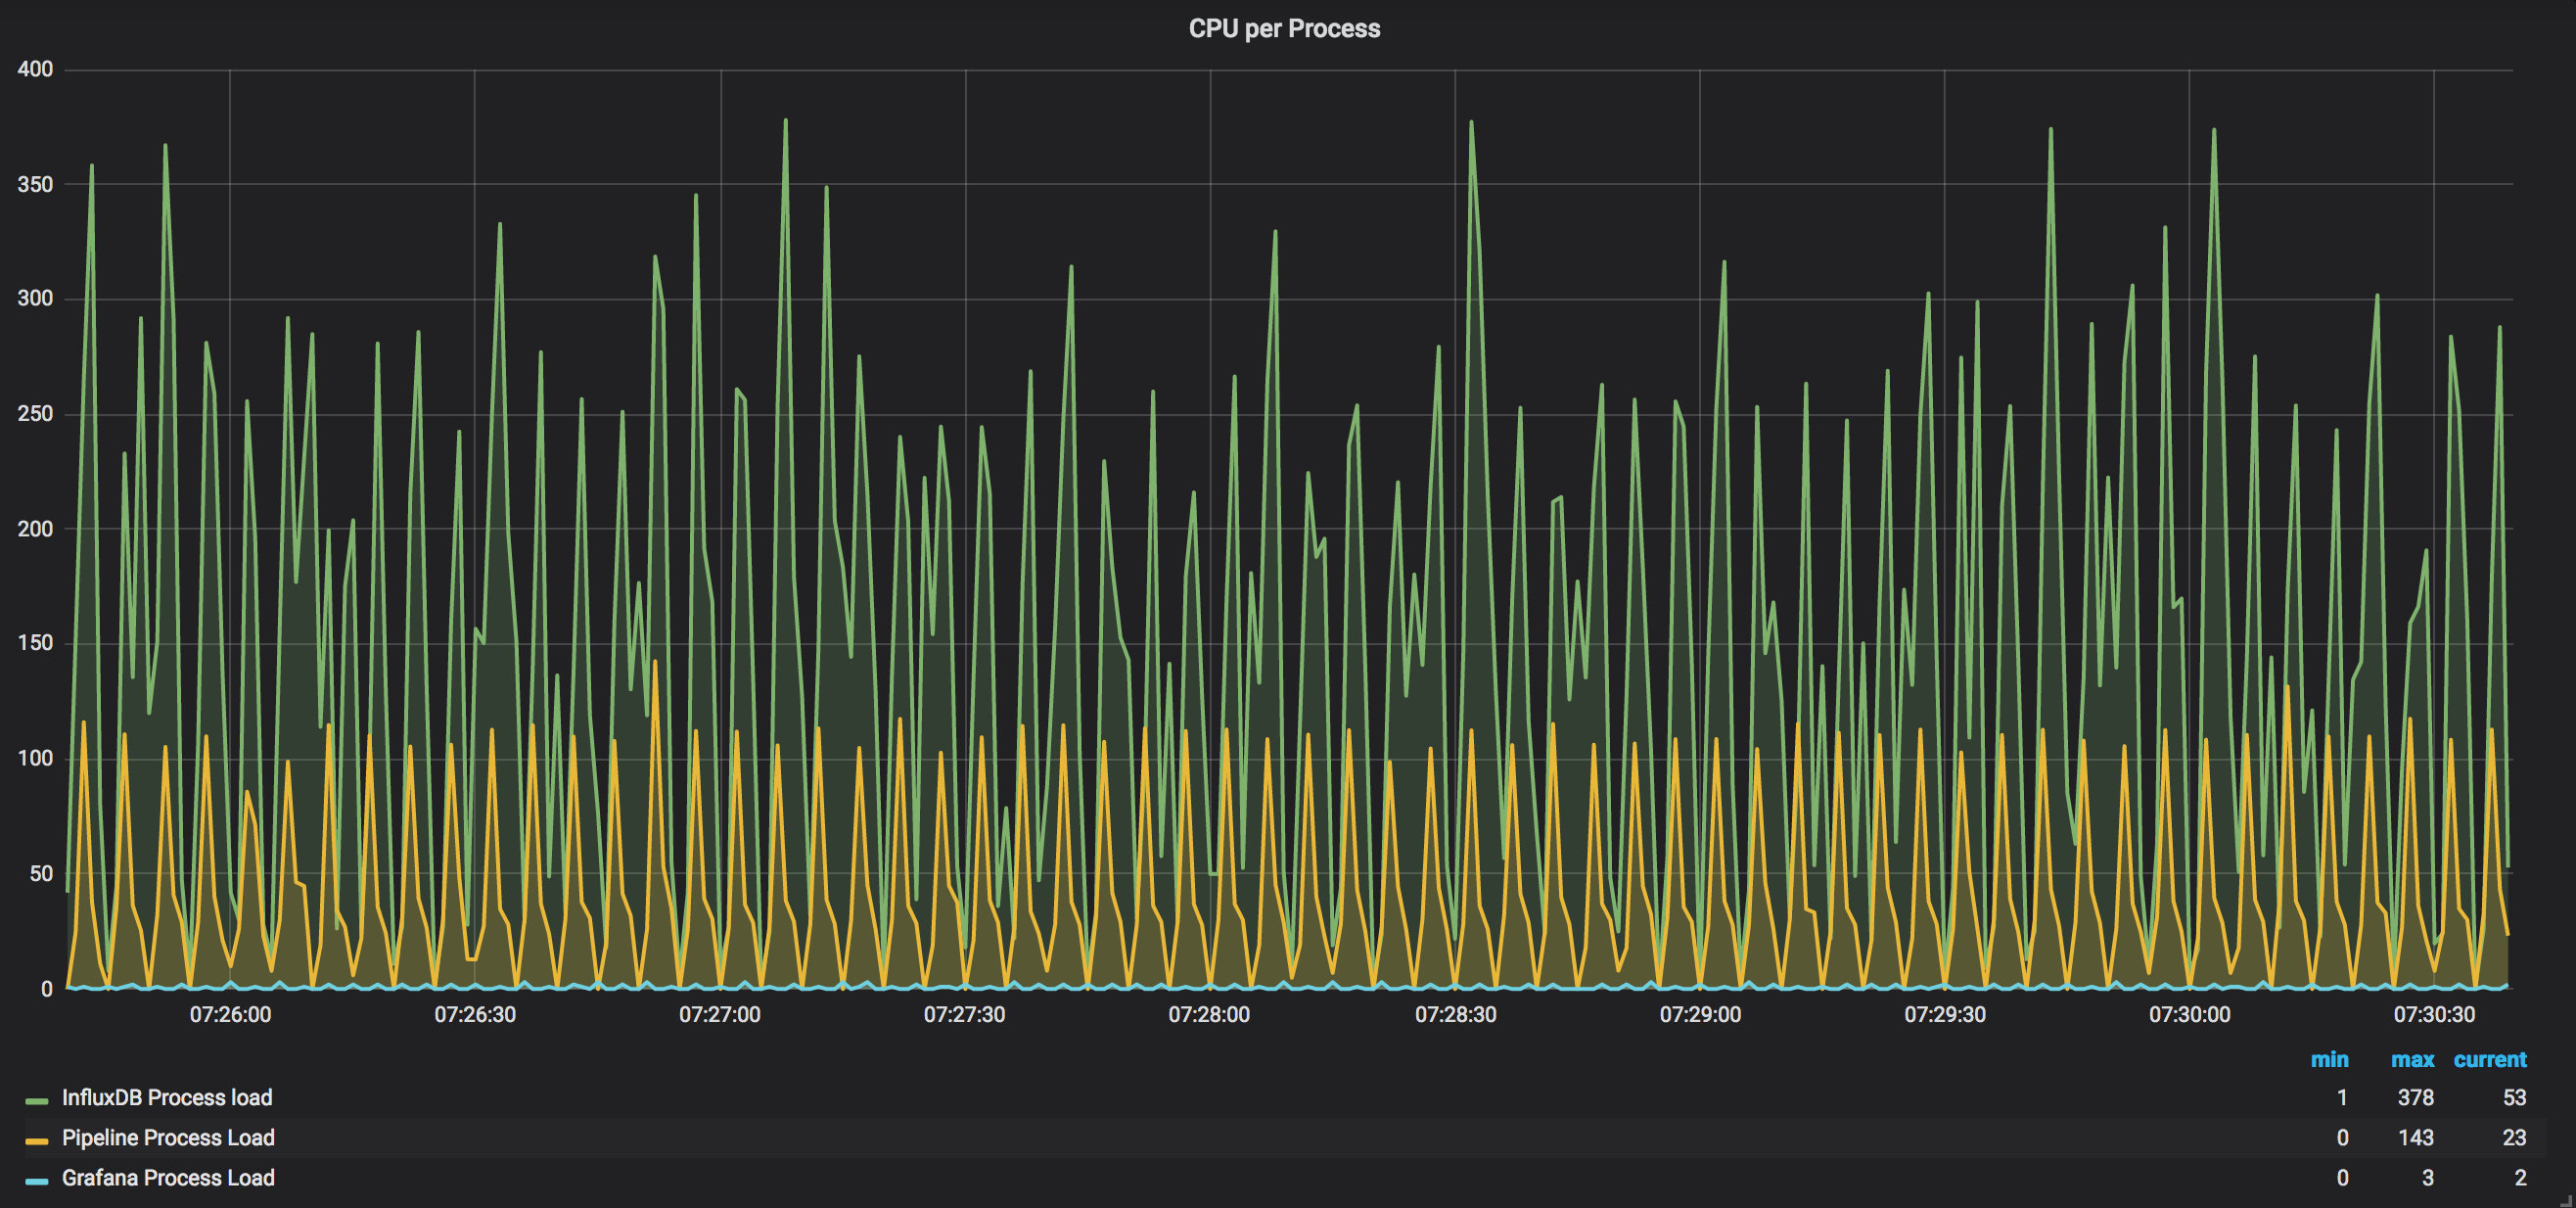
And here is a snapshot from the per-process load when there is a single active router:
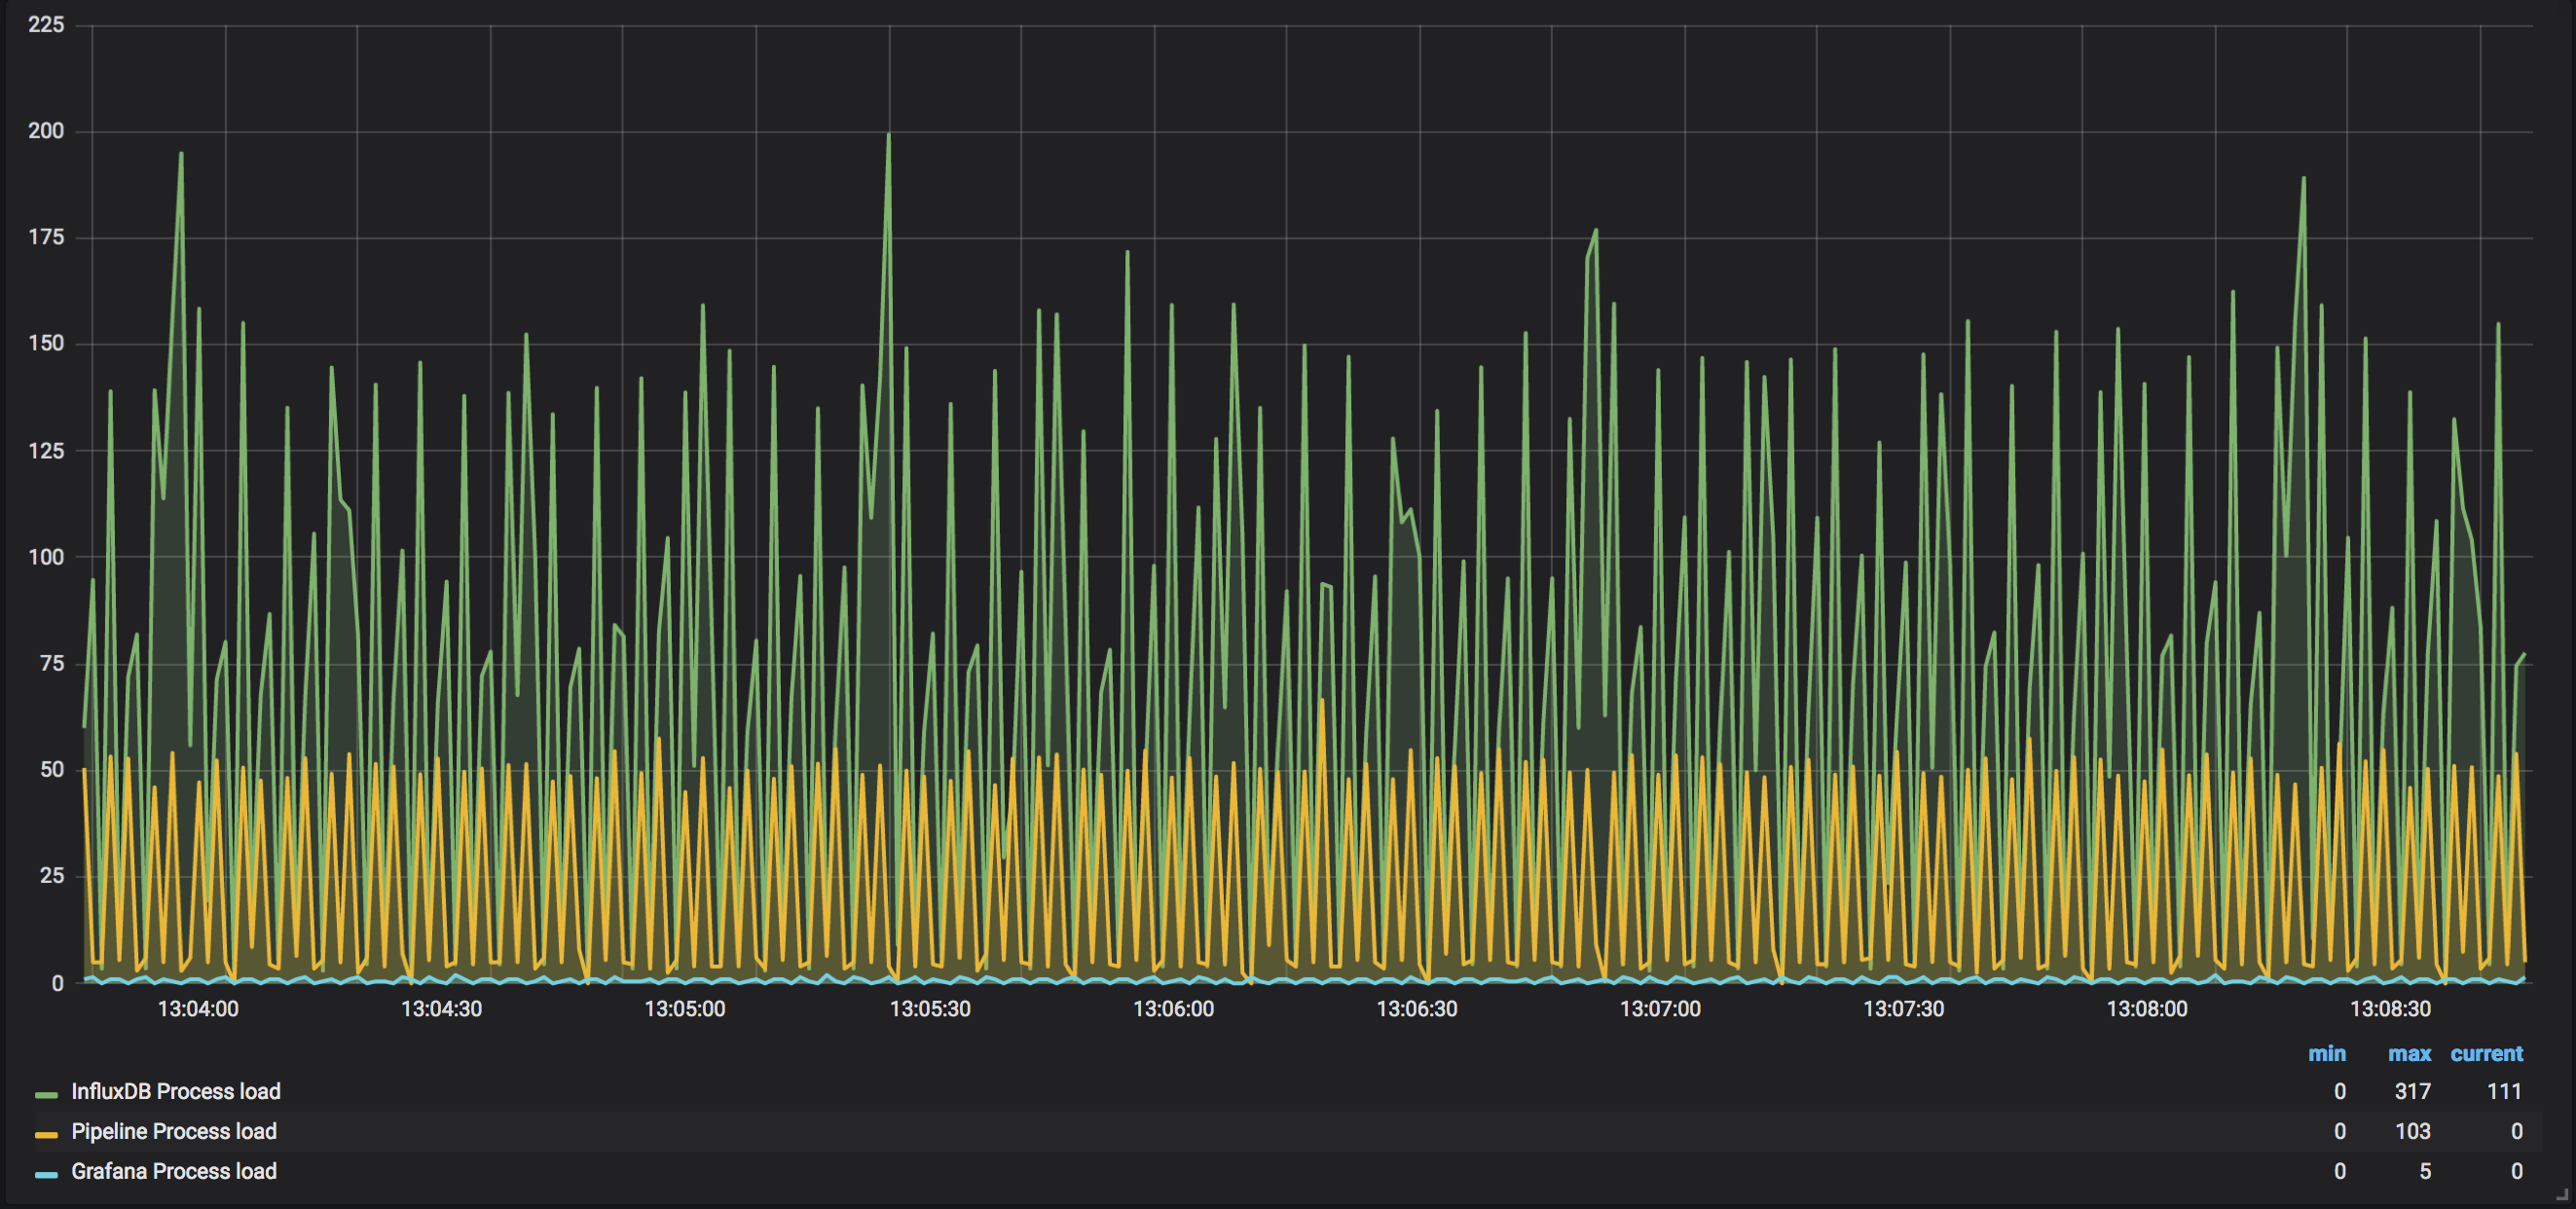
InfluxDB takes the most CPU power across all the monitored processes. It is roughly ~120%-140% of the load. Pipeline takes ~50%, and the load of Grafana is almost nothing comparing to the first two applications (and this confirms the words of the developer) This picture seems reasonable, as InfluxDB does reads, compressions, writes; hence, it takes the most power.
The final step here, for checking CPU, is to get a snapshot from Linux itself. To do this “htop” was used.
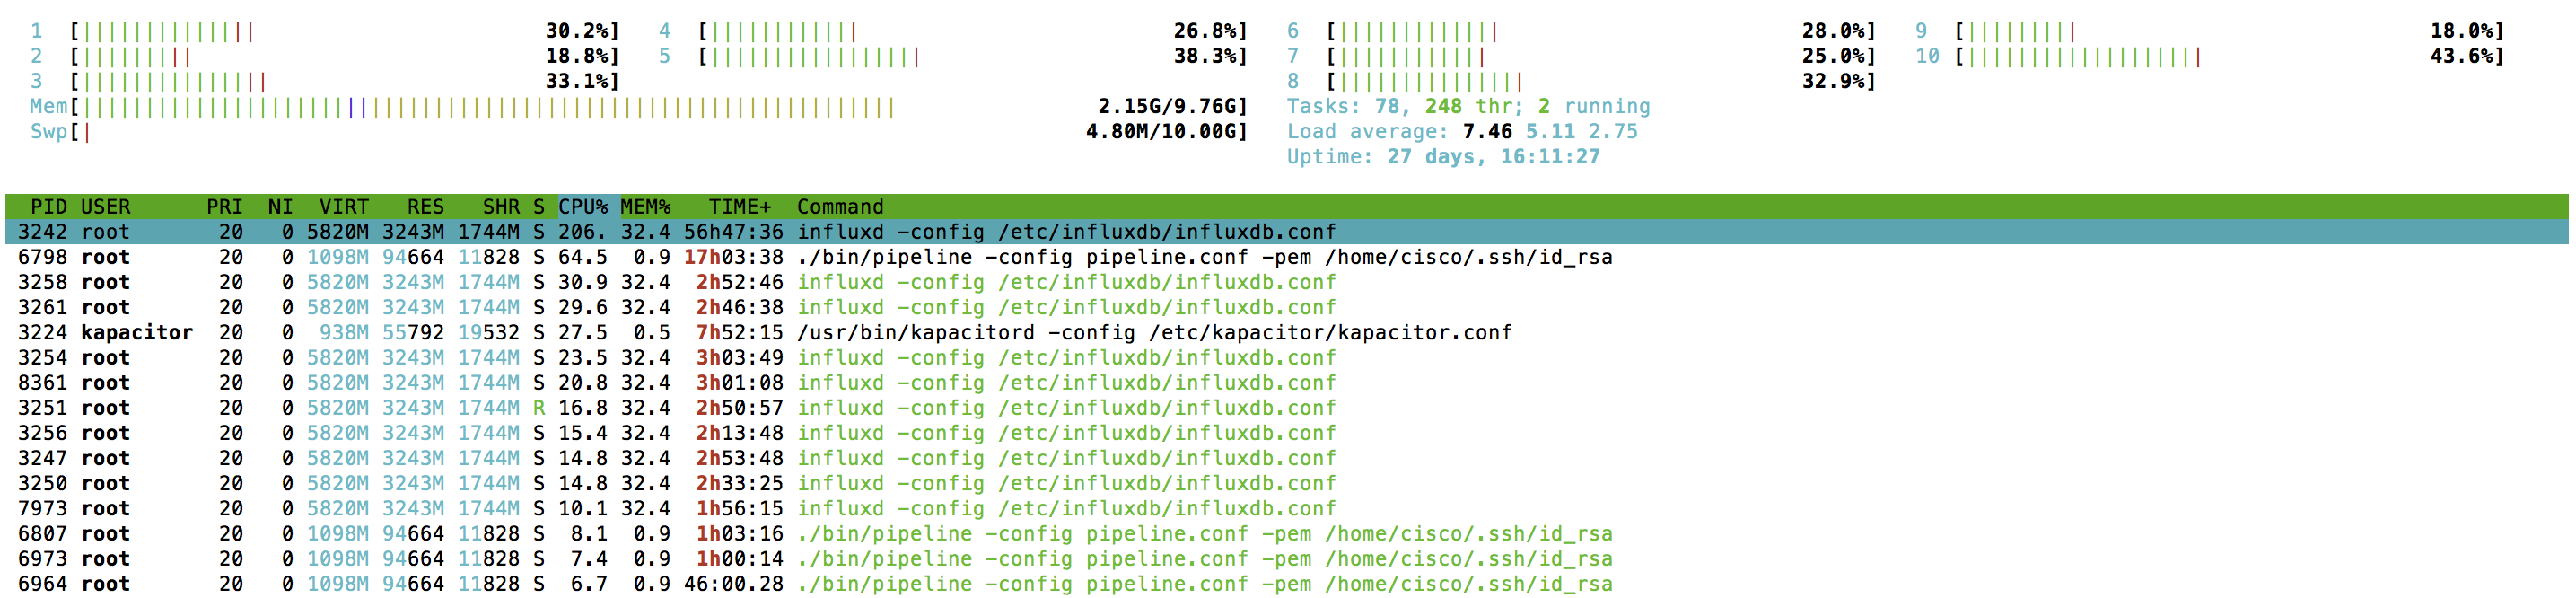
“htop” updates data pretty fast, and every ~5s it is possible to catch the top load for Influxdb as well as Pipeline. And we got the confirmation for Telegraf data seen before (a big spike was caught).
DRAM Utilization
Our next component to look at is DRAM. To have DRAM collected with Telegraf you don’t need to configure a lot:
[[inputs.mem]]
  # no configuration
There is no secret that InfluxDB reads and writes data using internal algorithms and procedures. It means that DRAM and hard disk utilization will be moving up and down constantly. Hence, it is more helpful to see the DRAM usage change over some period.
Here is a snapshot of DRAM utilization over several hours:

In the idle mode, it was about 1.3GB of DRAM used. According to the graph it roughly takes around 2.5G of DRAM now. The difference leaves ~1.2GB to process ~350k counters at five seconds interval.
Here is a quick check from the server itself:
cisco@ubuntu:~$ free -mh
              total        used        free      shared  buff/cache   available
Mem:           9.8G        2.0G        2.4G        103M        5.3G        7.3G
Swap:            9G        4.8M          9G
This value confirms the information collected with Telegraf.
Hard Disk Space
Our next stop is the hard disk. Before looking through the graphs, it is important to know the retention policy configured for the database. This information will be correlated with the results.
This is my configuration applied:
cisco@ubuntu:~$ influx -execute "show retention policies" -database="mdt_db"
name    duration shardGroupDuration replicaN default
----    -------- ------------------ -------- -------
autogen 3h0m0s   1h0m0s             1        true
So, at most, it will have around 4h of data stored (before it will delete a one-hour chunk of data). A small period was selected for the convenience of the testing. You will end up with keeping data longer, but simple math can be applied whenever needed!
You need this to be configured in the Telegraf configuration file for the collection to start:
# Read metrics about disk usage by mount point
[[inputs.disk]]
  ## By default, telegraf gather stats for all mountpoints.
  ## Setting mountpoints will restrict the stats to the specified mountpoints.
  # mount_points = ["/"]
  ## Ignore some mountpoints by filesystem type. For example (dev)tmpfs (usually
  ## present on /run, /var/run, /dev/shm or /dev).
  ignore_fs = ["tmpfs", "devtmpfs", "devfs"]
This will monitor the full disk. There was nothing else running on the server, so, the initially used volume on the hard drive was just subtracted in the Grafana dashboard to precisely monitor just the InfluxDB changes.
Here is a snapshot of the hard disk utilization based on two days of monitoring:

As you can see, it constantly goes up and down, with a midpoint of around 4GB. Here is an instant snapshot from the server itself:
cisco@ubuntu:~$ sudo du -sh /var/lib/influxdb/data/
3.5G	/var/lib/influxdb/data/
This value confirms data seen with Telegraf.
Hard Disk Write Speed
This is an essential characteristic to know about. The write speed of the hard drive is something obvious, but yet, one should pay attention to this once it comes to the Streaming Telemetry. Many different counters can be pushed from a router at the very high speed, and your disk(s) should be fast enough to write all the data. If there is not enough write speed, you will meet a situation when your graphs in Grafana are not built in real time (see slide No25 here)
To have write speed monitoring added in Telegraf, you should have these lines in the configuration file:
# Read metrics about disk IO by device
[[inputs.diskio]]
  ## By default, telegraf will gather stats for all devices including
  ## disk partitions.
  ## Setting devices will restrict the stats to the specified devices.
  devices = ["sda", "sdb", "mapper/ubuntu--vg-root"]
Here is a snapshot of the hard disk write speed with just a single router pushing data:

The write speed is within the range from ~60MBps to ~90MBps.
This can also be confirmed with the output from the Linux server itself (iotop tool was used to get this data):

This snapshot confirms the value we saw in Telegraf (it will show the top value once in ~5 seconds).
Network Bandwidth
We’re all networking people here, and that’s why there was an intention to look at bandwidth with different tools. The goal here is to understand the traffic profile with Telemetry and have proper transport infrastructure designed.
The most straightforward way is to check the RX load on the ingress interface with Telegraf. This is the configuration you need to have in “telegraf.conf” (make sure to specify your interface name):
# # Read metrics about network interface usage
    [[inputs.net]]
#   ## By default, telegraf gathers stats from any up interface (excluding loopback)
#   ## Setting interfaces will tell it to gather these explicit interfaces,
#   ## regardless of status.
#   ##
    interfaces = ["ens160"]
Telegraf collects counters from “/proc/net/dev”, as it seen here. This is similar if you try to see the stats using “ifconfig” (an old way) or “ip -s link” (a new way).
One might argue that this is pretty high in the Linux networking stack and better to use something closer to the NIC, like “ethtool” at least, but there were no filters, qos, etc. configured and relying on “/proc/net/dev” was good enough. Also, during this testing, I didn’t try to balance flows from different gRPC sessions/routers to different queues and/or different CPUs to work with the processing of those queues and SoftIRQs (plus, I350 is not very flexible in manipulation).
But even with the default configuration, there was some balancing happening:
cisco@ubuntu:~$ ethtool -S ens160
NIC statistics:
     Tx Queue#: 0
       TSO pkts tx: 5371
       TSO bytes tx: 14265596
       ucast pkts tx: 10244115
       ucast bytes tx: 711616671
       mcast pkts tx: 7
       mcast bytes tx: 506
       bcast pkts tx: 1
       bcast bytes tx: 57
       pkts tx err: 0
       pkts tx discard: 0
       drv dropped tx total: 0
          too many frags: 0
          giant hdr: 0
          hdr err: 0
          tso: 0
       ring full: 0
       pkts linearized: 0
       hdr cloned: 0
       giant hdr: 0
     Tx Queue#: 1
       TSO pkts tx: 8523
       TSO bytes tx: 23855746
       ucast pkts tx: 5597962
       ucast bytes tx: 405979501
       mcast pkts tx: 2
       mcast bytes tx: 156
       bcast pkts tx: 2
       bcast bytes tx: 116
       pkts tx err: 0
       pkts tx discard: 0
       drv dropped tx total: 0
          too many frags: 0
          giant hdr: 0
          hdr err: 0
          tso: 0
       ring full: 0
       pkts linearized: 0
       hdr cloned: 0
       giant hdr: 0
     Tx Queue#: 2
       TSO pkts tx: 15321
       TSO bytes tx: 40884653
       ucast pkts tx: 849676
       ucast bytes tx: 104659814
       mcast pkts tx: 689
       mcast bytes tx: 60840
       bcast pkts tx: 5
       bcast bytes tx: 242
       pkts tx err: 0
       pkts tx discard: 0
       drv dropped tx total: 0
          too many frags: 0
          giant hdr: 0
          hdr err: 0
          tso: 0
       ring full: 0
       pkts linearized: 0
       hdr cloned: 0
       giant hdr: 0
     Tx Queue#: 3
       TSO pkts tx: 11981
       TSO bytes tx: 30906375
       ucast pkts tx: 7161148
       ucast bytes tx: 520244572
       mcast pkts tx: 678
       mcast bytes tx: 72716
       bcast pkts tx: 1
       bcast bytes tx: 79
       pkts tx err: 0
       pkts tx discard: 0
       drv dropped tx total: 0
          too many frags: 0
          giant hdr: 0
          hdr err: 0
          tso: 0
       ring full: 0
       pkts linearized: 0
       hdr cloned: 0
       giant hdr: 0
     Tx Queue#: 4
       TSO pkts tx: 13939
       TSO bytes tx: 35826029
       ucast pkts tx: 2544772
       ucast bytes tx: 210321037
       mcast pkts tx: 0
       mcast bytes tx: 0
       bcast pkts tx: 0
       bcast bytes tx: 0
       pkts tx err: 0
       pkts tx discard: 0
       drv dropped tx total: 0
          too many frags: 0
          giant hdr: 0
          hdr err: 0
          tso: 0
       ring full: 0
       pkts linearized: 0
       hdr cloned: 0
       giant hdr: 0
     Tx Queue#: 5
       TSO pkts tx: 4268
       TSO bytes tx: 12138427
       ucast pkts tx: 147058
       ucast bytes tx: 26340175
       mcast pkts tx: 2
       mcast bytes tx: 156
       bcast pkts tx: 0
       bcast bytes tx: 0
       pkts tx err: 0
       pkts tx discard: 0
       drv dropped tx total: 0
          too many frags: 0
          giant hdr: 0
          hdr err: 0
          tso: 0
       ring full: 0
       pkts linearized: 0
       hdr cloned: 0
       giant hdr: 0
     Tx Queue#: 6
       TSO pkts tx: 133051
       TSO bytes tx: 1742790147
       ucast pkts tx: 172700036
       ucast bytes tx: 13463528864
       mcast pkts tx: 1
       mcast bytes tx: 78
       bcast pkts tx: 0
       bcast bytes tx: 0
       pkts tx err: 0
       pkts tx discard: 0
       drv dropped tx total: 0
          too many frags: 0
          giant hdr: 0
          hdr err: 0
          tso: 0
       ring full: 0
       pkts linearized: 0
       hdr cloned: 0
       giant hdr: 0
     Tx Queue#: 7
       TSO pkts tx: 113109
       TSO bytes tx: 1564030563
       ucast pkts tx: 10729684
       ucast bytes tx: 2296085621
       mcast pkts tx: 0
       mcast bytes tx: 0
       bcast pkts tx: 0
       bcast bytes tx: 0
       pkts tx err: 0
       pkts tx discard: 0
       drv dropped tx total: 0
          too many frags: 0
          giant hdr: 0
          hdr err: 0
          tso: 0
       ring full: 0
       pkts linearized: 0
       hdr cloned: 0
       giant hdr: 0
     Rx Queue#: 0
       LRO pkts rx: 69503
       LRO byte rx: 155537167
       ucast pkts rx: 4899929
       ucast bytes rx: 6933364483
       mcast pkts rx: 664
       mcast bytes rx: 71048
       bcast pkts rx: 7690
       bcast bytes rx: 461400
       pkts rx OOB: 0
       pkts rx err: 0
       drv dropped rx total: 0
          err: 0
          fcs: 0
       rx buf alloc fail: 0
     Rx Queue#: 1
       LRO pkts rx: 173207
       LRO byte rx: 420063453
       ucast pkts rx: 8744413
       ucast bytes rx: 12400319120
       mcast pkts rx: 0
       mcast bytes rx: 0
       bcast pkts rx: 0
       bcast bytes rx: 0
       pkts rx OOB: 0
       pkts rx err: 0
       drv dropped rx total: 0
          err: 0
          fcs: 0
       rx buf alloc fail: 0
     Rx Queue#: 2
       LRO pkts rx: 68829
       LRO byte rx: 179417502
       ucast pkts rx: 7784799
       ucast bytes rx: 11250828484
       mcast pkts rx: 0
       mcast bytes rx: 0
       bcast pkts rx: 10080
       bcast bytes rx: 1430784
       pkts rx OOB: 0
       pkts rx err: 0
       drv dropped rx total: 0
          err: 0
          fcs: 0
       rx buf alloc fail: 0
     Rx Queue#: 3
       LRO pkts rx: 175185
       LRO byte rx: 512157733
       ucast pkts rx: 12908488
       ucast bytes rx: 18425489162
       mcast pkts rx: 1329
       mcast bytes rx: 128923
       bcast pkts rx: 0
       bcast bytes rx: 0
       pkts rx OOB: 0
       pkts rx err: 0
       drv dropped rx total: 0
          err: 0
          fcs: 0
       rx buf alloc fail: 0
     Rx Queue#: 4
       LRO pkts rx: 95519
       LRO byte rx: 252147848
       ucast pkts rx: 4410766
       ucast bytes rx: 6185140629
       mcast pkts rx: 0
       mcast bytes rx: 0
       bcast pkts rx: 0
       bcast bytes rx: 0
       pkts rx OOB: 0
       pkts rx err: 0
       drv dropped rx total: 0
          err: 0
          fcs: 0
       rx buf alloc fail: 0
     Rx Queue#: 5
       LRO pkts rx: 3992421
       LRO byte rx: 9493291192
       ucast pkts rx: 342072378
       ucast bytes rx: 490086127366
       mcast pkts rx: 665
       mcast bytes rx: 57855
       bcast pkts rx: 6612
       bcast bytes rx: 1748874
       pkts rx OOB: 0
       pkts rx err: 0
       drv dropped rx total: 0
          err: 0
          fcs: 0
       rx buf alloc fail: 0
     Rx Queue#: 6
       LRO pkts rx: 45801
       LRO byte rx: 141305620
       ucast pkts rx: 4268647
       ucast bytes rx: 5801599902
       mcast pkts rx: 0
       mcast bytes rx: 0
       bcast pkts rx: 0
       bcast bytes rx: 0
       pkts rx OOB: 0
       pkts rx err: 0
       drv dropped rx total: 0
          err: 0
          fcs: 0
       rx buf alloc fail: 0
     Rx Queue#: 7
       LRO pkts rx: 460650
       LRO byte rx: 1279922500
       ucast pkts rx: 28727343
       ucast bytes rx: 41614846434
       mcast pkts rx: 0
       mcast bytes rx: 0
       bcast pkts rx: 0
       bcast bytes rx: 0
       pkts rx OOB: 0
       pkts rx err: 0
       drv dropped rx total: 0
          err: 0
          fcs: 0
       rx buf alloc fail: 0
     tx timeout count: 0
This is a snapshot of RX (and TX) load of the interface, where streaming telemetry was pushed to:
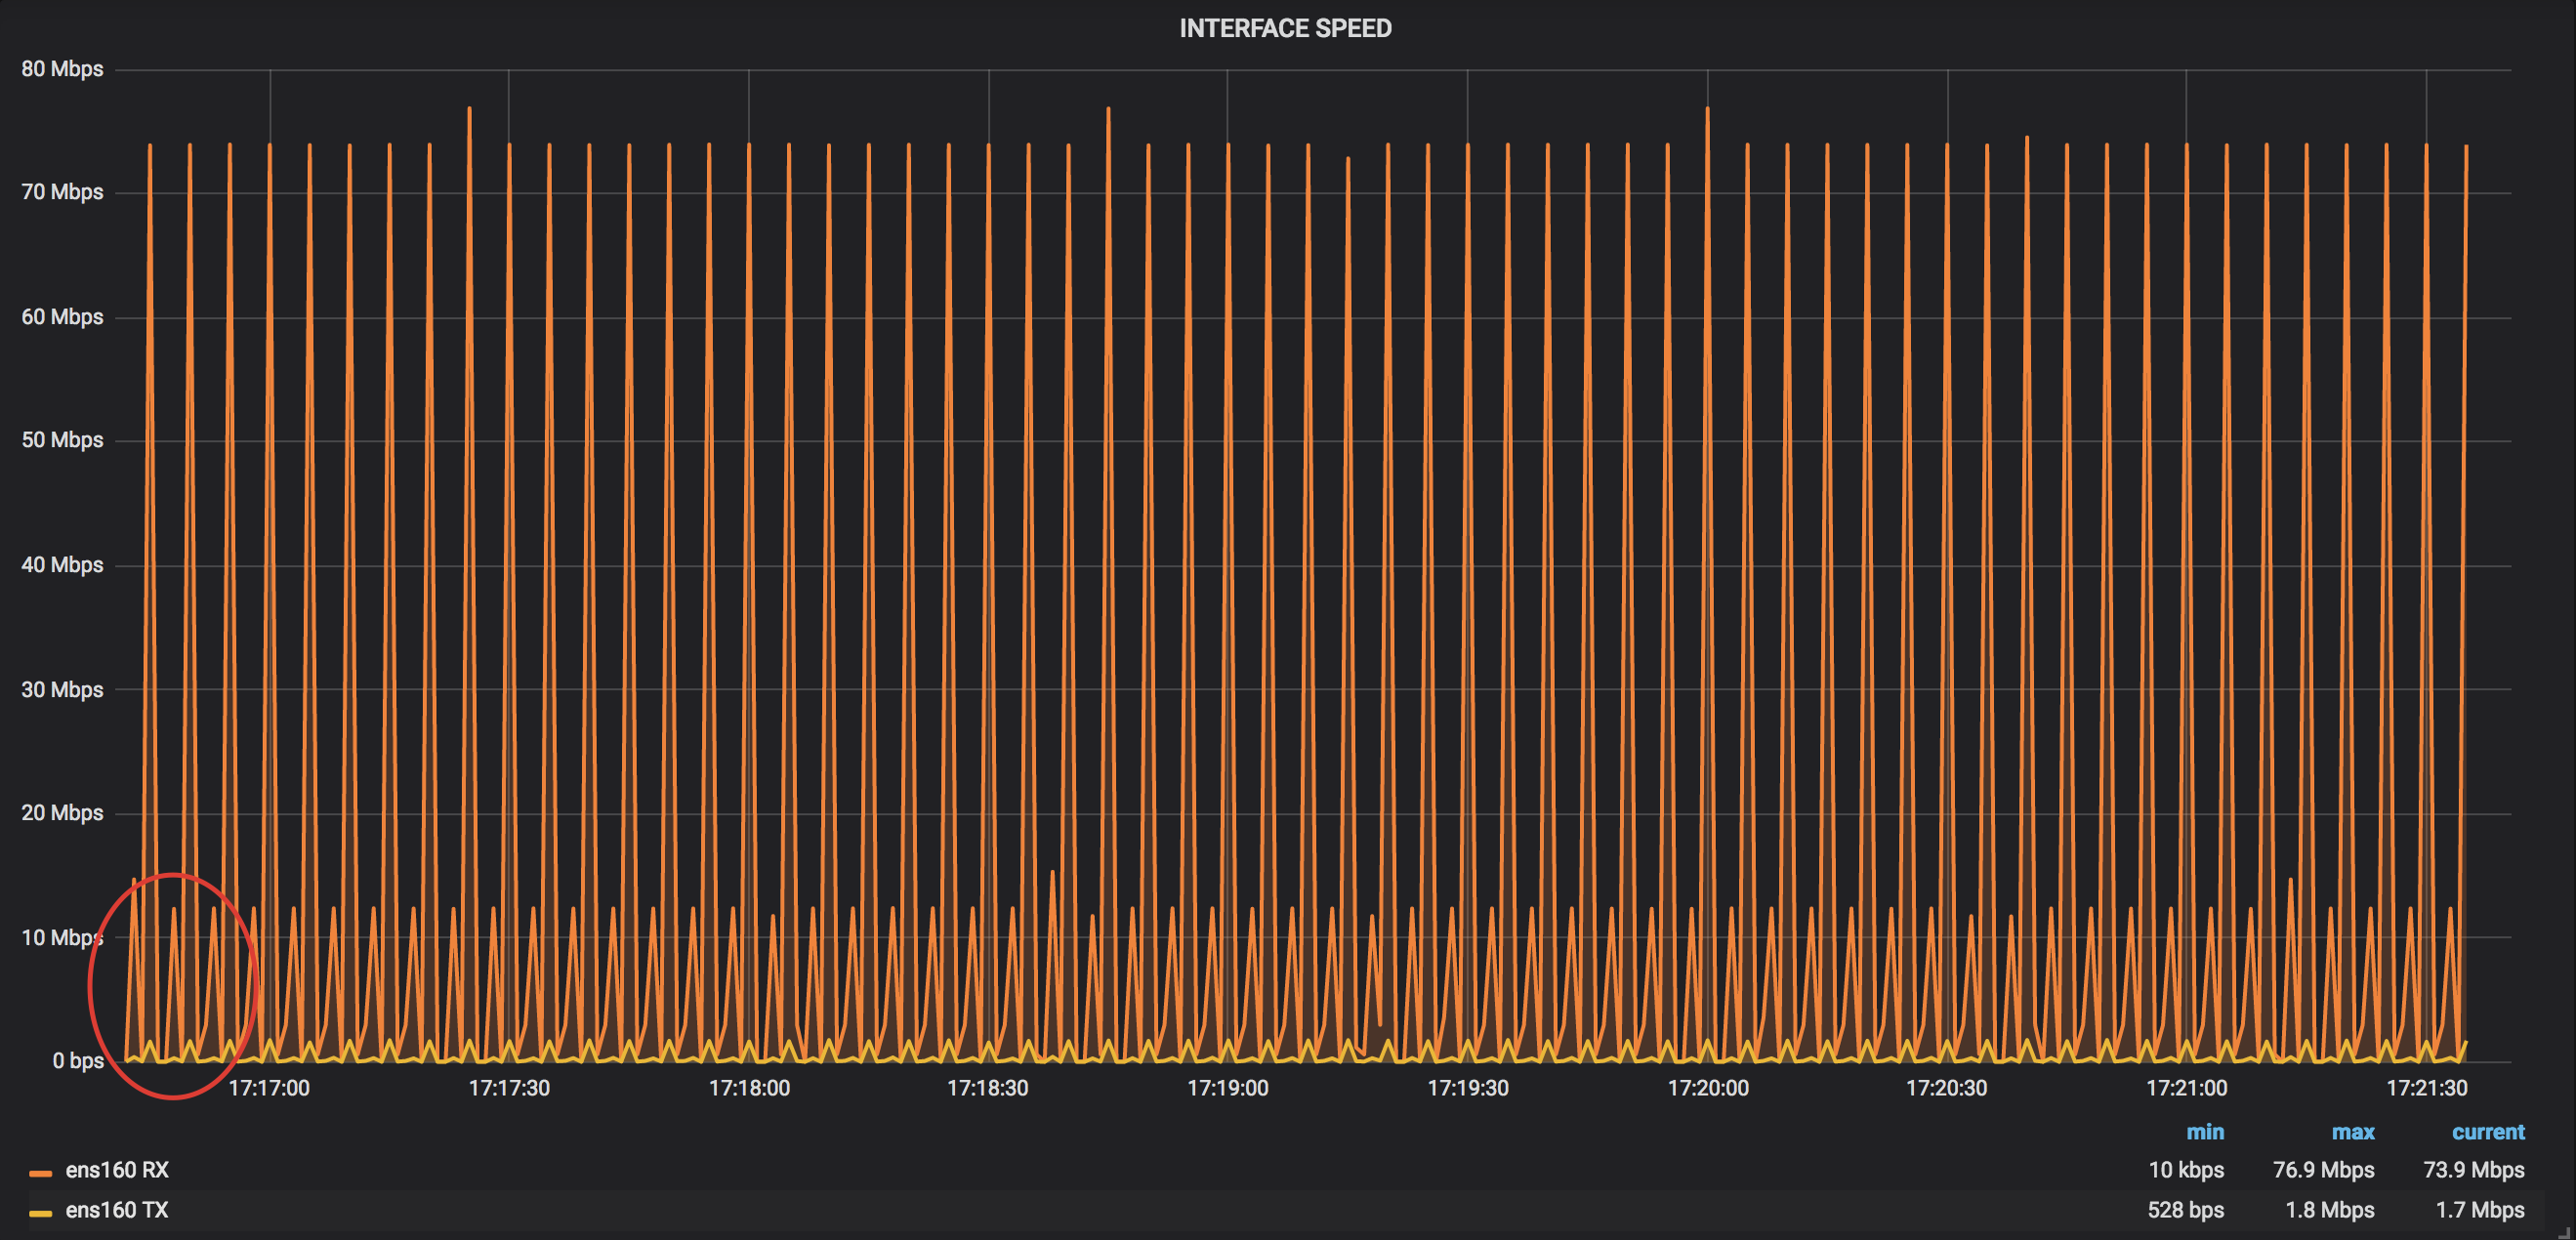
As you can see, the bandwidth profile is pretty close to the picture you might already have in your mind. Every fifth second you see two spikes of bandwidth utilization. The first one is pretty small (~12Mbps, it contains a set of “fast” collections) and then the big one follows (~73Mbps, it includes mostly MPLS-TE counters). This is something expected, as Telemetry works every sample interval and the amount of data is (roughly) the same (there were no changes/updates done in the router).
Let’s now check the transmission rate from the Management interface of the router used in the test:

The traffic profile is totally the same! You can see the small spikes (for fast collections) followed by the big spikes (MPLS-TE collections) with the same values.
You can also use any of the existing tools that collect counters from networking interfaces to calculate the rate. “Speedometer” was used in the testing. Speedometer also gets counters from /proc/net/dev, so, it will be shown here just once to check Telegraf.

This graph gives a bit better granularity, but, overall, confirms the graph we saw with Telegraf. There are several peaks with a higher rate (83Mbps vs. 73Mbps), mostly because several packets from smaller spikes were added to the big ones during the rate calculation.
And here is an example of how telemetry push looks through several hours of observation:

The Management interface load stays constant as expected.
Pipeline Throughput
The final stop in the first phase of the testing is Pipeline. Monitoring of Pipeline is essential, as this can help you to prevent situations with overloads (and hence, either drops or pushbacks to the router). Whenever you install the Telemetry Collection Stack, you will have this activated by default. All you need is to follow the graphs.
Here is a snapshot of the Pipeline load while processing counters from a single router:

Throughput is something around 2.2MBps. (try to guess the subscription the pink color corresponds to ;) ) No surprise, this load is the same and stable across a couple of days:
Step Two: Two Routers
At this step, the goal was to add another router to find the increments applied. The second router was also an NCS5501 with the same configuration, IOS XR version, and the very similar scale.
Let’s look through the snapshots to find the math.
CPU Utilization
As before, let’s start with the per core CPU load. Here is a snapshot of the graph, showing CPU load for the last 24h:

The addition of the router was around “14:00” on that graph (the time is marked on this graph and follow similar marks of the following graphs). More spikes are seen after the second router started pushing its telemetry data. The max value of spikes now is around 25%, and the midpoint is approximately 15%. It is hard to do the analysis based on this graph only, so, let’s see the per-process load.
Per Process Load
Okay, let’s check what is the situation with our three main processes:
To remind, with a single router we saw ~130% of InfluxDB and ~50% of Pipeline load. After adding the second router, it is seen that Pipeline is around 100% of the load. This gives us an assumption that Pipeline needs ~0.5 of vCPU per router. The load of InfluxDB became higher as well, ~250%. This leads us to ~1.3vCPU per router for InfluxDB. Grafana load is still nothing, comparing to both, Pipeline and InflxuDB.
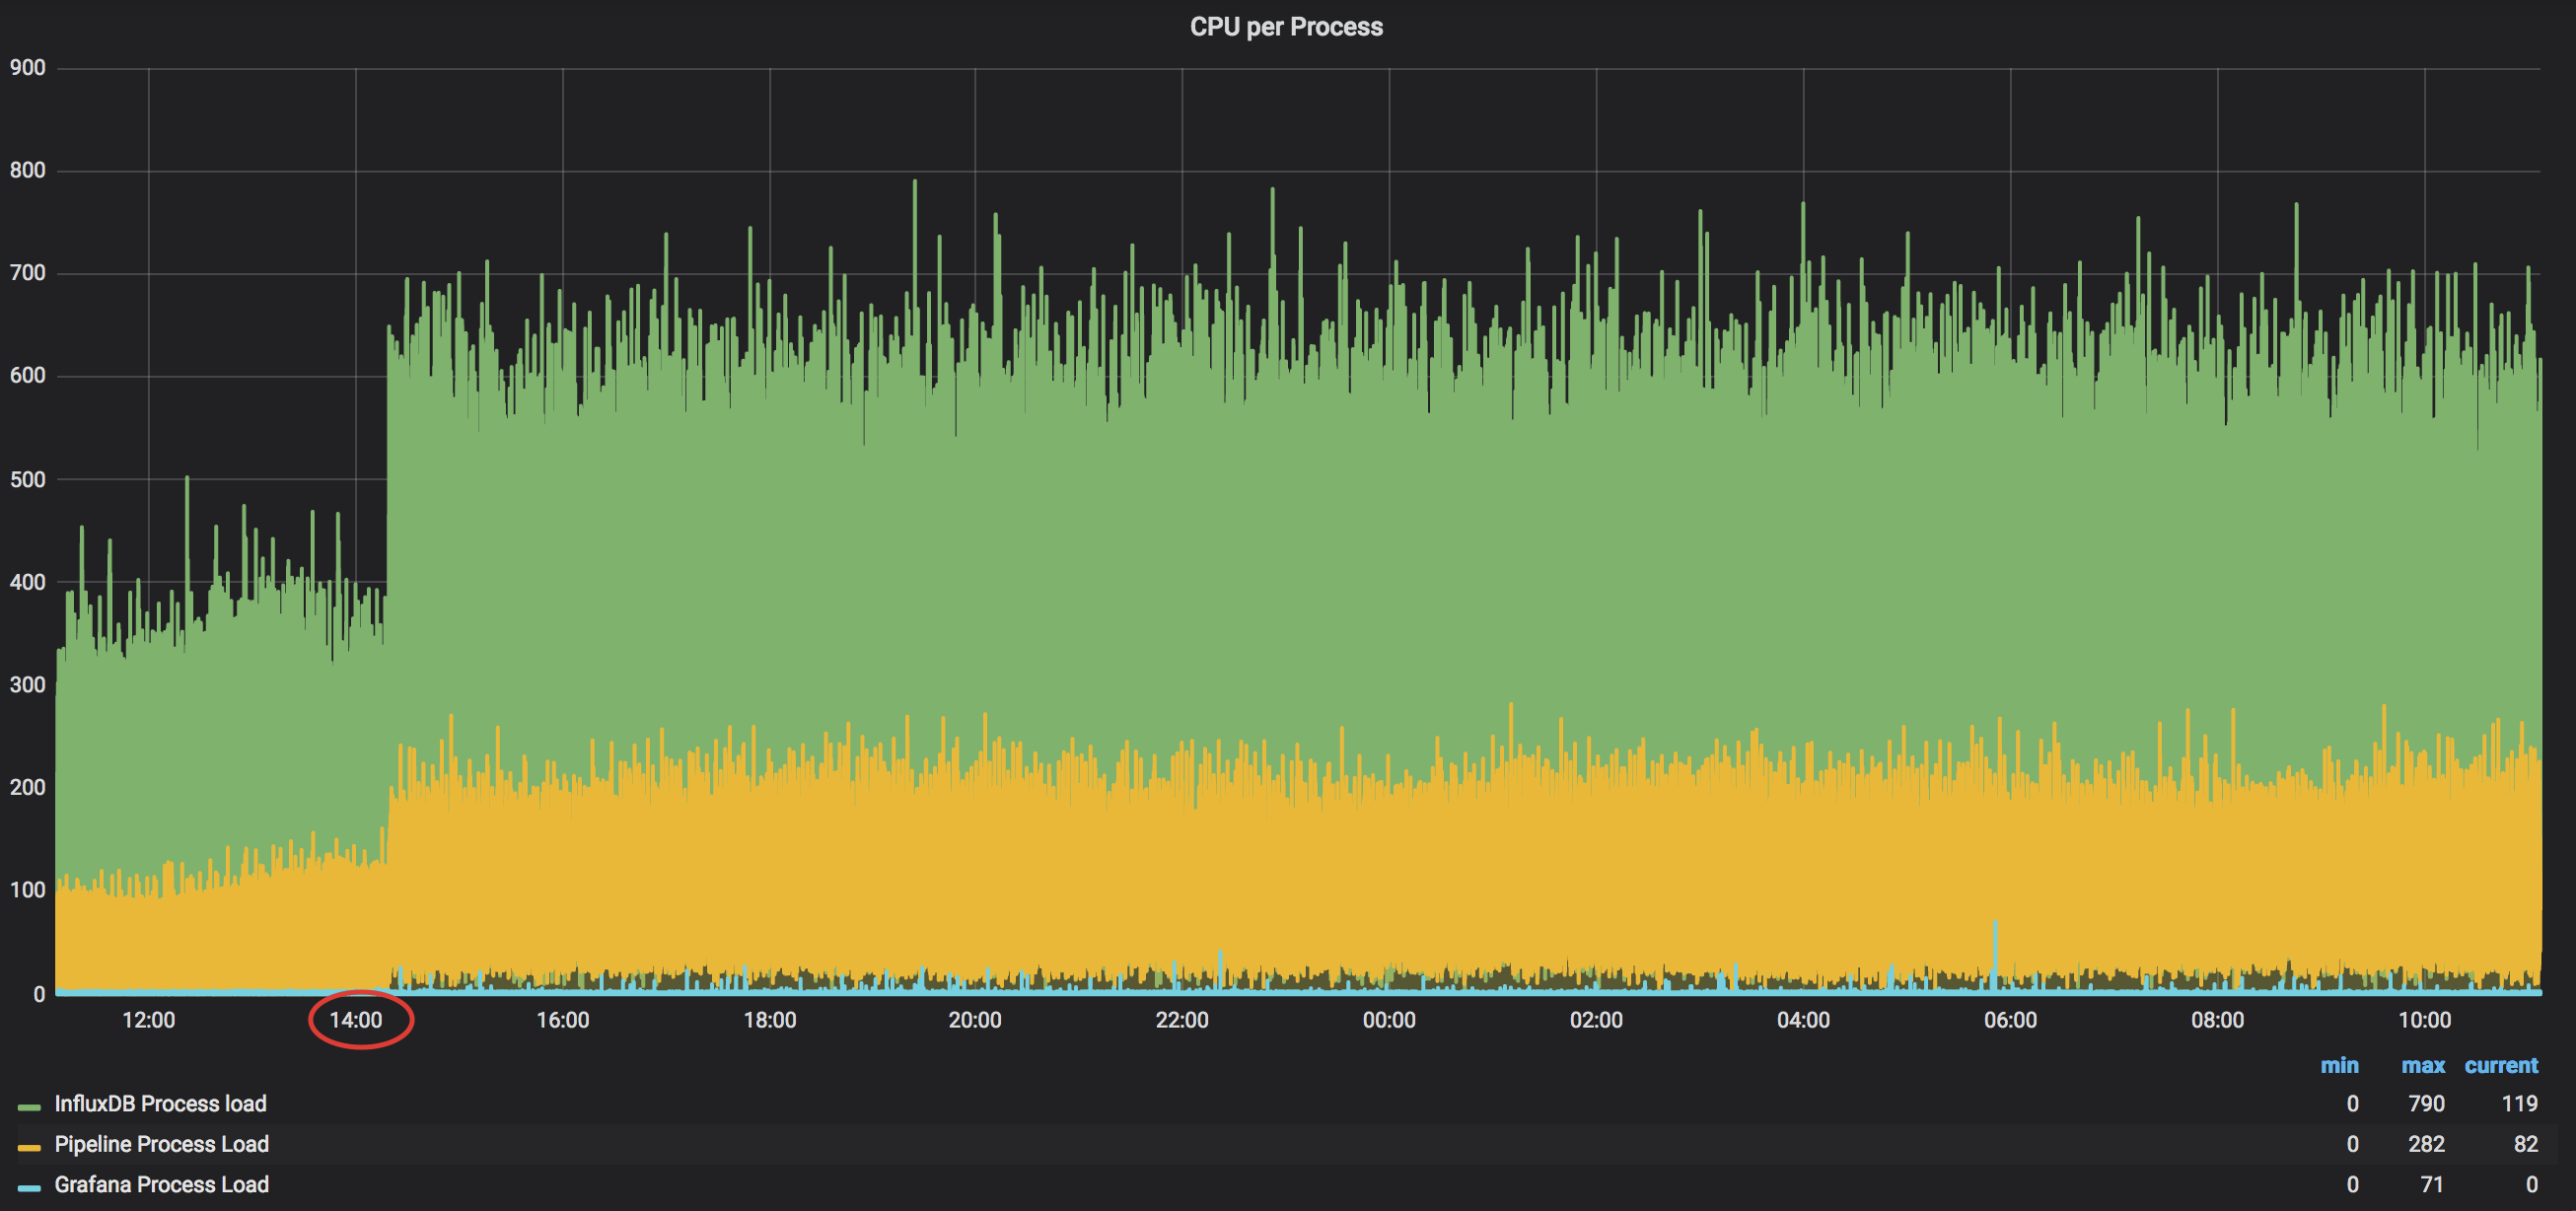
Here is a snapshot for the 24h of per-process load monitoring:

InfluxDB midpoint is really ~250% (with random spikes to ~350%-400%), while Pipeline stayed almost flat around 100%.
And the final check on the Linux itself:

A snapshot was done at one of the highest spikes, and it confirms that InfluxDB goes up to ~290%, with Pipeline close to ~100%.
DRAM Utilization
A single router took around 1.2GB of the DRAM from the server. Here is a snapshot of DRAM stats for 24 hours:

DRAM utilization moved from ~2.5GB to ~3.6GB-3.7GB after the second router was added. It is something about ~1,1GB-1.2GB increase for the new router (the value is consistent)
A quick check from the linux:
cisco@ubuntu:~$ free -mh
              total        used        free      shared  buff/cache   available
Mem:           9.8G        3.3G        739M         98M        6.1G        6.0G
Swap:            9G         35M          9G
The result is pretty close to what we see with Telegraf.
Hard Disk Space
To store information from the first router, ~4GB of the space was needed. Keep on using the same retention policy, here is a snapshot of the 2-day disk utilization monitoring after the second router was added:

The disk utilization is now around 8GB. It means that adding one more device with the similar scale adds right the same amount of disk utilization (4GB per a router).
And a quick check from Linux at a random moment:
cisco@ubuntu:~$ sudo du -sh /var/lib/influxdb/data/
7.5G	/var/lib/influxdb/data/
Hard Disk Write Speed
The write speed for the first router was ~60MBps-90MBps during the periods of counters coming to the server. This is a snapshot of the write speed with two routers:

There are many spikes up to ~600MBps, but the dense part is now ~200-250MBps. It looks like a new router needs at least ~90MBps of the write speed.
Here is one of the peaks caught from the Linux console:

IOTOP shows a smaller value, that is more relevant to the normal mode (not spikes).
Network Bandwidth
Whenever you add one more router you might have two possible situations:
- You will have their sample intervals aligned at start time
- You will not have their sample intervals aligned at start time
In the first case, you will see the max peak value multiplied by 2x. In the second case, you will see a profile with several peaks consistent in time (this case should happen more often).
In the tests, the second situation was observed:

With the first router, the peak value was ~72Mbps. Right now several collections are aligned in time. The peak value for several collections is ~90Mbps and the second peak around 80Mbps. (Again, the worst case scenario would be start time alignment and peak values up to ~150Mbps).
There is no need to show the long-term snapshot, as with streaming telemetry you will have a constant rate (unless there are drops, policing, etc. on its way!)
Pipeline Throughput
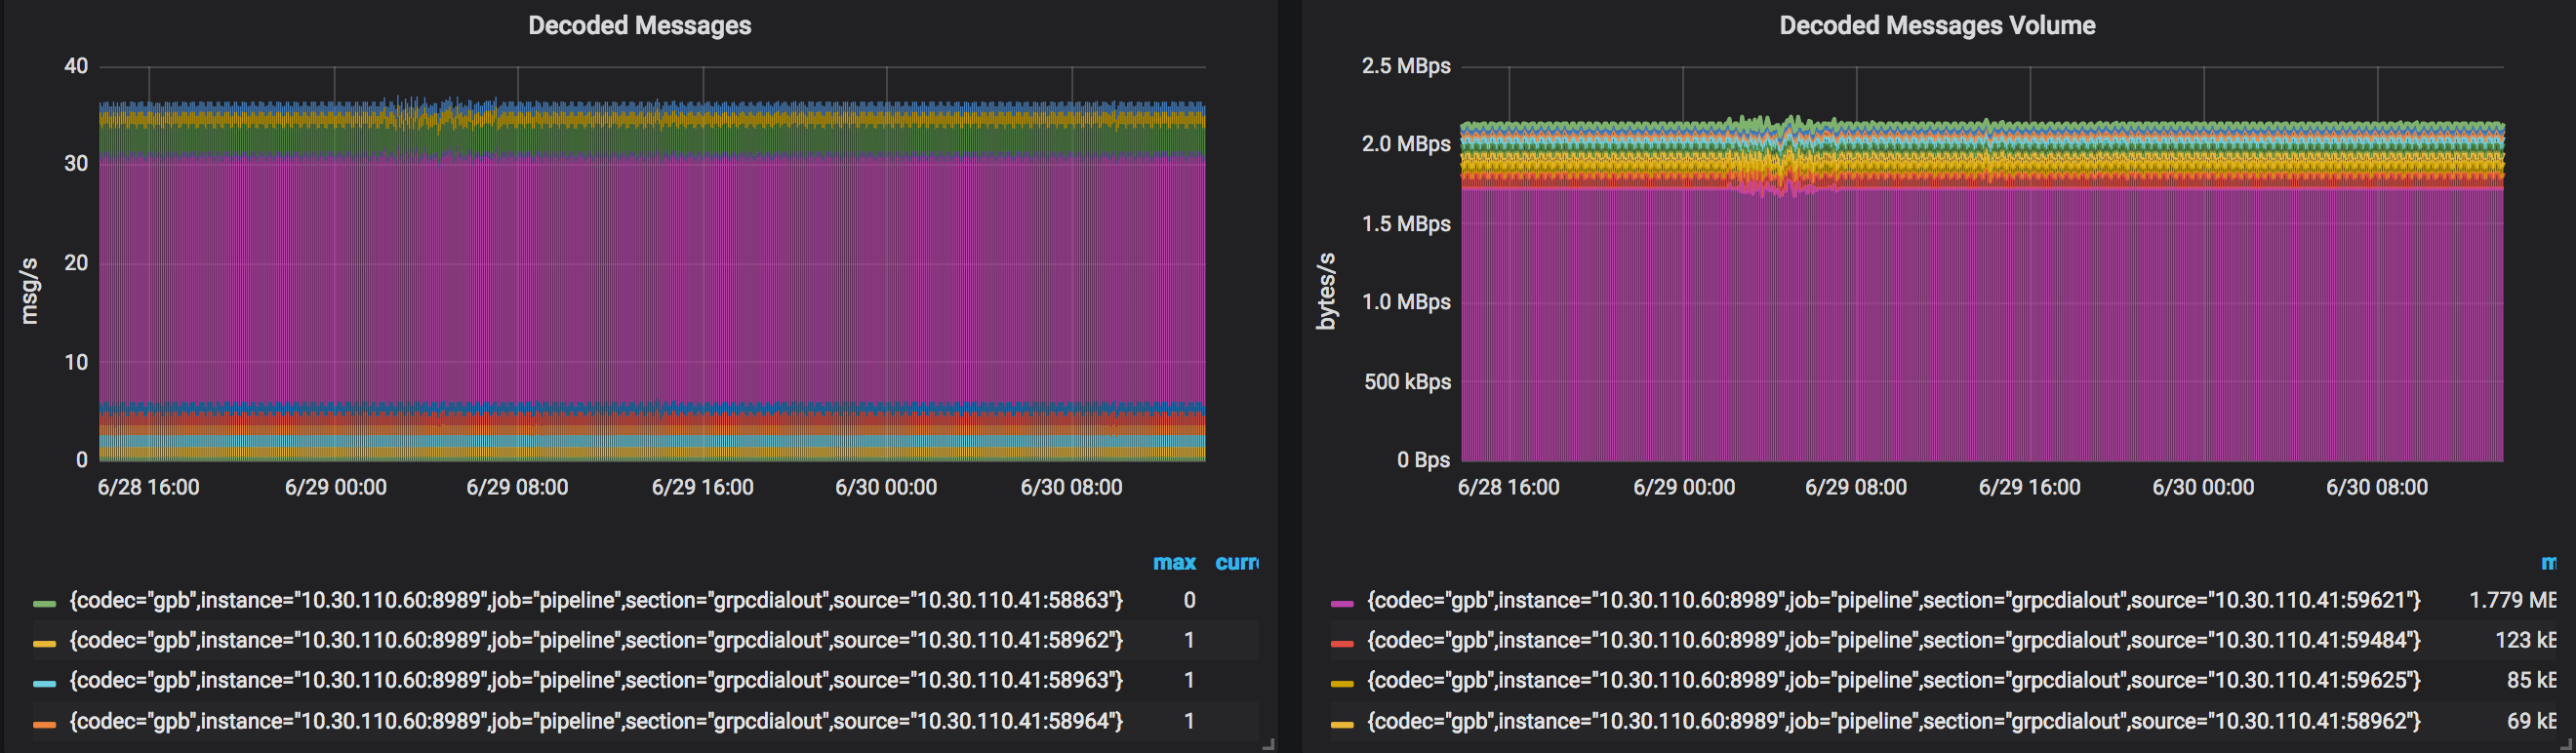
With the first router, we observed 2.2MBps of Pipeline throughput. Here is a snapshot with the load after adding the second one:

The volume of decoded messages grew up exactly two times! It means, every new similar router will need the same amount of processing power (~2.2MBps)
Step three: five routers
At this step, the plan is to check our findings while running five routers streaming almost the same amount of counters. Three more routers were added to the testbed. All were NCS5502 with 6.3.2 IOS XR release.
CPU Utilization
As before, let’s start with the total CPU load:

We observed the peak values ~25% and midpoint was ~15% with two routers. With five routers we can see ~22-25% as the midpoint, and peak values are up to 40%. This test confirms that all the processes are balanced almost equally across the cores, and we don’t see a linear increase on just a subset of cores. More details should be available in the per-process view.
Per Process Load
Let’s jump directly to the comparison of the per-process load with a long time of monitoring:
Based on this graph we can see that Pipeline now takes 250% and InfluxDB takes around 650%. This confirms our previous thoughts that Pipeline needs approximately 50% (~0.5 vCPU) to process a single router with ~350k of counters every five seconds. InfluxDB needs something around 120-130% per a router (~1.3 vCPU)
DRAM Utilization
In our previous test, we saw that around ~1.1GB-1.2GB of the DRAM was needed to process streaming telemetry from a router. Let’s see the graph with the five routers:

We can see that the used DRAM moved from ~3.6GB to something ~7.2GB-7.3GB (midpoint). This test confirms that ~1.1GB-1.2GB of DRAM is needed to process a router with ~350k counters every five seconds.
Hard Disk Space
According to our previous tests, we needed ~4GB to store data from a single router and around ~8GB for two of them. Let’s see the disk utilization with five routers streaming telemetry data:

It looks like that the utilization is around 20-25GB and this confirms our assumption that ~4GB of the hard disk is needed to store all the data from five routers. The retention policy configured is 3h+1h. This tells us that, roughly, an hour of storage of ~350k counters pushed every five seconds takes ~1GB of the hard disk.
Hard Disk Write Speed
Here is the graph with the write speed on the hard disk:

As you can see, the dense part “moved” from ~200MBps to ~400MBps. The fact of the increase in the write speed is obvious, but you can’t jump over the max speed on your drive. That’s why the system will keep on writing till the data is still in internal memory (hence, you see a more dense area). Please, remember, if you write speed is not good enough to handle immediately all the data coming, you might observe increasing of delays in Grafana’s graphs.
Network Bandwidth
As with two routers, you might meet different situations with five routers. Sample intervals can be aligned at start time or not. Here is the graph from the tests:

Several routers were aligned in their intervals, that’s why you’re able to see spikes up to ~185Mbps. The result here is that the total bandwidth will depend on the number of simultaneous pushes and a single router can take ~72Mbps.
Pipeline Throughput
The final piece to look at is Pipeline. Here is a snapshot:

Again, no surprise here. Every new router added ~2MBps of the load for the tool. You can also see that most of the processing was taken by just a single subscription from every router. This graph, actually, confirms that the number of counters of every router was almost the same!
So, What Is The Summary?
Based on the tests, you can refer to these numbers for your infrastructure designs.
For a router pushing ~350k counters every five seconds you need:
- DRAM: ~1.2GB (DDR4 / 2133Mhz)
- Hard disk space: ~1GB per hour
- Hard disk write speed: ~90MBps, but may grow non-linear (SM1625 800GB 6G 2.5” SAS SSD)
- InfluxDB process: ~1.5 vCPU (CPU E5-2697 v3 @ 2.60GHz)
- Pipeline process: ~0.5 vCPU (CPU E5-2697 v3 @ 2.60GHz)
- Pipeline throughput: ~2.2MBps
- Network bandwidth: ~75Mbps
Update this for your needs, and you’re good to go!
Before moving to the conclusion, let me please show you the difference in bandwidth needs between all the encodings/transport protocols. All other resources needs will roughly stay the same.
Peak bandwidth needs for ~350k counters:
- gRPC/KV-GPB: ~72.5 Mbps
- gRPC/GPB: ~9.6 Mbps
- gRPC/JSON: ~84.4 Mbps
- TCP/KV-GPB: ~72.6 Mbps
- TCP/GPB: ~9.6 Mbps
- TCP/JSON: ~84.5 Mbps
- UDP/KV-GPB: ~76.7 Mbps
- UDP/GPB: ~9.8 Mbps
- UDP/JSON: ~88.2 Mbps
Please, use these values as your general reference, paying attention that your number might be slightly different.
Conclusion
The IOS XR Telemetry Collection Stack gives you a possibility to start collecting telemetry data from your routers. But before doing this, you need to go through the proper planning of your infrastructure. You don’t want to meet a situation when everything is working fine, but you don’t have enough space to keep the data, or your server is just not powerful enough. There are many recommendations exist from the owners of the components used in the Stack (e.g. InfluxDB), but I hope that the results here will help you to get a better understanding of the needs, how to check utilization and move fast!
Leave a Comment