
Monitoring BNG with Model-Driven Telemetry
A Modern Way To Monitor A Venerable Technology
Broadband Network Gateway (BNG) is a well-established technology for establishing and managing subscriber sessions, thus enabling service providers to offer differentiated services for their customers. But even mature technologies can learn new tricks! In this blog, I will describe the sensor-paths that allow you to monitor BNG with model-driven telemetry
Active Sessions
When monitoring a BNG device, one of simplest but most important KPIs is the number of activated sessions. In IOS XR, you can use this CLI to get that information:
RP/0/RSP0/CPU0:R1#show subscriber session all summary
Wed Jul 27 19:19:09.440 UTC

Session Summary Information for all nodes

                Type            PPPoE           IPSub           IPSub
                                                (DHCP)          (PKT)
                ====            =====           ======          =====

Session Counts by State:
        initializing            0               0               0
          connecting            0               0               0
           connected            0               0               0
           activated            0               121             0
                idle            0               0               0
       disconnecting            0               0               0
                 end            0               0               0
              Total:            0               121             0


Session Counts by Address-Family/LAC:
         in progress            0               0               0
           ipv4-only            0               121             0
           ipv6-only            0               0               0
     dual-partial-up            0               0               0
             dual-up            0               0               0
                 lac            0               0               0
              Total:            0               121             0
RP/0/RSP0/CPU0:R1#
The CLI returns the number of session counts organized by state or address-family, then by subscriber type (PPPoE, DHCP or IP packet). As you can see from this output, the device current has 121 Activated IPv4 DHCP sessions.
The Data Model for Subscriber Summary Data
This same data can be retrieved from the Cisco-IOS-XR-iedge4710-oper.yang data model. Here is the relevant part of the model in tree format:
pyang -f tree Cisco-IOS-XR-iedge4710-oper.yang --tree-path subscriber/session/nodes/node/summary

module: Cisco-IOS-XR-iedge4710-oper
  +--ro subscriber
     +--ro session
        +--ro nodes
           +--ro node* [node-name]
              +--ro summary
                 +--ro state-xr
                 |  +--ro pppoe
                 |  |  +--ro initialized-sessions?     uint32
                 |  |  +--ro connecting-sessions?      uint32
                 |  |  +--ro connected-sessions?       uint32
                 |  |  +--ro activated-sessions?       uint32
                 |  |  +--ro idle-sessions?            uint32
                 |  |  +--ro disconnecting-sessions?   uint32
                 |  |  +--ro end-sessions?             uint32
                 |  +--ro ip-subscriber-dhcp
                 |  |  +--ro initialized-sessions?     uint32
                 |  |  +--ro connecting-sessions?      uint32
                 |  |  +--ro connected-sessions?       uint32
                 |  |  +--ro activated-sessions?       uint32
                 |  |  +--ro idle-sessions?            uint32
                 |  |  +--ro disconnecting-sessions?   uint32
                 |  |  +--ro end-sessions?             uint32
                 |  +--ro ip-subscriber-packet
                 |     +--ro initialized-sessions?     uint32
                 |     +--ro connecting-sessions?      uint32
                 |     +--ro connected-sessions?       uint32
                 |     +--ro activated-sessions?       uint32
                 |     +--ro idle-sessions?            uint32
                 |     +--ro disconnecting-sessions?   uint32
                 |     +--ro end-sessions?             uint32
                 +--ro address-family-xr
                    +--ro pppoe
                    |  +--ro in-progress-sessions?    uint32
                    |  +--ro ipv4-only-sessions?      uint32
                    |  +--ro ipv6-only-sessions?      uint32
                    |  +--ro dual-part-up-sessions?   uint32
                    |  +--ro dual-up-sessions?        uint32
                    |  +--ro lac-sessions?            uint32
                    +--ro ip-subscriber-dhcp
                    |  +--ro in-progress-sessions?    uint32
                    |  +--ro ipv4-only-sessions?      uint32
                    |  +--ro ipv6-only-sessions?      uint32
                    |  +--ro dual-part-up-sessions?   uint32
                    |  +--ro dual-up-sessions?        uint32
                    |  +--ro lac-sessions?            uint32
                    +--ro ip-subscriber-packet
                       +--ro in-progress-sessions?    uint32
                       +--ro ipv4-only-sessions?      uint32
                       +--ro ipv6-only-sessions?      uint32
                       +--ro dual-part-up-sessions?   uint32
                       +--ro dual-up-sessions?        uint32
                       +--ro lac-sessions?            uint32
If you squint at this for a while, you’ll see that this particular YANG model follows the CLI pretty closely, grouping the session counters by state and address-family and then dividing them out by subscriber type.
The Config for Subscriber Summary Data
Here is an example of an IOS XR configuration to stream the subscriber session summary at 10 second intervals:
telemetry model-driven
 destination-group TELEGRAF
  address-family ipv4 172.24.78.221 port 57000
   encoding self-describing-gpb
   protocol tcp
  !
 !
 sensor-group TEST_GROUP1
  sensor-path Cisco-IOS-XR-iedge4710-oper:subscriber/session/nodes/node/summary
 !
 subscription TEST_SUB
  sensor-group-id TEST_GROUP1 sample-interval 10000
  destination-id TELEGRAF
Displaying Subscriber Summary Data
What you do with the data when you get it will depend on your collection infrastructure. In my lab, I’m using a simple, open-source collection stack of Telegraf, InfluxDB and Grafana. Just as an example, here is the Flux query I configured in Grafana to retrieve just the activated IPv4 DHCP sessions from InfluxDB:
from(bucket: "mybucket")
  |> range(start: v.timeRangeStart, stop:v.timeRangeStop)
  |> filter(fn: (r) =>
    r._measurement == "Cisco-IOS-XR-iedge4710-oper:subscriber/session/nodes/node/summary" and
    r._field == "address_family_xr/ip_subscriber_dhcp/ipv4_only_sessions"
  )
And that is enough to get me my first BNG monitoring panel: 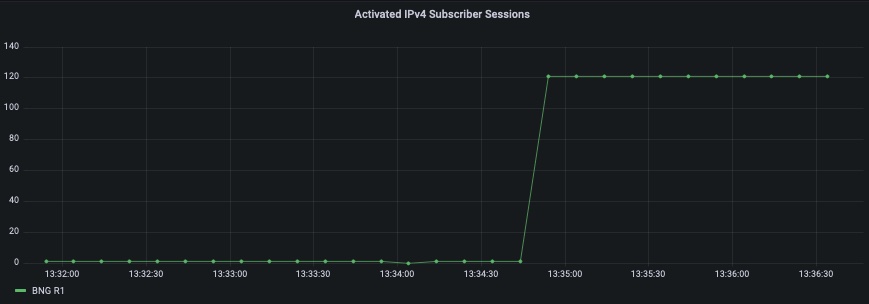
DHCP KPIs
You may also be interested in keeping track of DHCP statistics. That data is reported in different models for IPv4 and IPv6.
DHCPv4
For information on IPv4 DHCP such as you’d see with the CLI command show dhcp ipv4 server binding summary, use this sensor-path:
sensor-path Cisco-IOS-XR-ipv4-dhcpd-oper:ipv4-dhcpd/nodes/node/server/binding/summary
If you’d like to stream the data equivalent to show dhcp ipv4 server statistics detail, use this one instead:
sensor-path Cisco-IOS-XR-ipv4-dhcpd-oper:ipv4-dhcpd/nodes/node/server/stats
DHCPv6
For DHCPv6 Solicits, Advertises, Requests and Replies use this sensor path:
Cisco-IOS-XR-ipv6-new-dhcpv6d-oper.yang:dhcpv6/nodes/node/server/stats
DHCP Proxy
For details on DHCP Proxy Binding, use this sensor path:
Cisco-IOS-XR-ipv4-dhcpd-oper:ipv4-dhcpd/nodes/node/proxy/binding/summary
RADIUS
For RADIUS authentication data similar to what you’d see in show radius authentication, use this sensor path:
Cisco-IOS-XR-aaa-protocol-radius-oper:radius/nodes/node/authentication
For COA-specific data, use:
Cisco-IOS-XR-aaa-protocol-radius-oper:radius/nodes/node/dynamic-authorization
For Gy-data, use:
Cisco-IOS-XR-aaa-diameter-oper:aaa:diameter/gx-statistics
For NASRAQ data, use:
Cisco-IOS-XR-aaa-diameter-oper:aaa:diameter/nas-summary
Process Health
Another common monitoring task involves tracking the health of BNG-related processes. The list of relevant processes includes iedged and radiusd
Process CPU
Per-process CPU data can be found in the Cisco-IOS-XR-wdsysmon-fd-proc-oper.yang model. You will need to specify the node name and the process-name in the sensor-path. Here is an example of how to measure the CPU utilization of the iedge process on the RSP:
Cisco-IOS-XR-wdsysmon-fd-proc-oper:process-monitoring/nodes/node[node-name=0/RSP0/CPU0]/process-name/proc-cpu-utilizations/proc-cpu-utilization[process-name=iedged]
Process Memory
Per-process memory data can be found in the Cisco-IOS-XR-procmem-oper.yang model. Since this model is indexed by process-id (not process name), you’ll first have to identify the process-id (PID) of the process you want to monitor. So, for example, to find the PID of the radiusd process, I could use this CLI:
RP/0/RSP0/CPU0:R1#show processes radiusd | include PID
                     PID: 14904
Once I know that radiusd has PID 14904, I can use that to stream specific memory data for the radiusd process with:
sensor-path Cisco-IOS-XR-procmem-oper:processes-memory/nodes/node/process-ids/process-id[process-id=14904]
Telegraf Bonus: Process Memory by Process Name
There are a couple reasons that I don’t love the fact that Cisco-IOS-XR-procmem-oper.yang model forces you to use a PID to select a process for streaming memory statistics. First, you have to perform an out-of-band process to determine the PID for the process of interest (e.g. the CLI command I showed above). Second, PIDs can change on reload, so you might find yourself having to repeat the process after an outage or upgrade. Fortunately, Telegraf users can use processors to make this data easier to use.
As a refresher, here’s the relevant part of the data model:
> pyang -f tree Cisco-IOS-XR-procmem-oper.yang --tree-path processes-memory/nodes/node/process-ids/process-id
module: Cisco-IOS-XR-procmem-oper
  +--ro processes-memory
     +--ro nodes
        +--ro node* [node-name]
           +--ro process-ids
              +--ro process-id* [process-id]
                 +--ro process-id        Proc-mem-pid-range
                 +--ro name?             string
                 +--ro jid?              uint32
                 +--ro pid?              uint32
                 +--ro text-seg-size?    uint32
                 +--ro data-seg-size?    uint32
                 +--ro stack-seg-size?   uint32
                 +--ro malloc-size?      uint32
                 +--ro dyn-limit?        uint32
                 +--ro shared-mem?       uint32
                 +--ro physical-mem?     uint32
As you can see the process name (“name”) is in the data model, it’s just not the key to the list. This is where the Telegraf converter processor comes in handy. By adding the following to your telegraf.conf file, you can get Telegraf to convert “name” from a field to a tag:
[[processors.converter]]
    [processors.converter.fields]
        tag = [ "name" ]
When Telegraf adds this tag, InfluxDB can filter the memory stats based on process name.
It’s a good idea to refine this a little further since Telegraf may be inputting data from many models and sources and we may not always want a “name” field converted to a tag, so we can add a “namepass” statement to the config to restrict this conversion to just the procmem model:
[[processors.converter]]
    namepass = [ "Cisco-IOS-XR-procmem-oper:processes-memory/nodes/node*" ]
    [processors.converter.fields]
        tag = [ "name" ]
To make this even better, I can use the rename processor to rename “name” to “process_name” so that it matches the key name for per-process CPU from Cisco-IOS-XR-wdsysmon-fd-proc-oper.yang. If I do that, I also need to specify an order for the processors so I convert “name” to a tag first, then rename the “name” tag to “process_name.” So the final processor config in telegraf.conf would look like this:
[[processors.converter]]
    order = 1
    namepass = [ "Cisco-IOS-XR-procmem-oper:processes-memory/nodes/node*" ]
    [processors.converter.fields]
        tag = [ "name" ]

[[processors.rename]]
    order = 2
    namepass = [ "Cisco-IOS-XR-procmem-oper:processes-memory/nodes/node*" ]
    [[processors.rename.replace]]
        tag = "name"
        dest = "process_name"
If you go this route, make sure you modify the sensor-path config so the router sends the data for all the processes (not just the one PID):
sensor-path Cisco-IOS-XR-procmem-oper:processes-memory/nodes/node/process-ids
Super-Geek Starlark Bonus
Just for fun, I experimented with doing the same thing (tag conversion and renaming) using the starlark processor instead of converter and rename. Starlark is probably overkill for this application but just for your reference, here’s a working example:
[[processors.starlark]]
 source = '''
renames = {
   'name': 'process_name',
}
def apply(metric):
 # k stands for key, v for value
   if metric.name == "Cisco-IOS-XR-procmem-oper:processes-memory/nodes/node/process-ids/process-id":
      for k, v in metric.fields.items():
         if k in renames:
            metric.tags[renames[k]] = v
            metric.fields.pop(k)
   return metric
'''
Interface Statistics
There’s nothing special or unique to BNG when it comes to interface statistics. So if you’re wanting to stream basic interface statistics from access and/or core-facing interfaces, use the sensor paths described in this tutorial.
Monitoring QoS
Just like interface statistics, QoS statistics are not unique to BNG. If you want to stream up-to-date information about the QoS policies applied to your BNG interfaces, look no further than the usual QoS sensor-paths:
Cisco-IOS-XR-qos-ma-oper:qos/interface-table/interface/input/service-policy-names/service-policy-instance/statistics
Cisco-IOS-XR-qos-ma-oper:qos/interface-table/interface/output/service-policy-names/service-policy-instance/statistics
Final Thoughts
If you’re already monitoring BNG with CLI, then the shift to a model-based approach is relatively straight-forward since most of the relevant models follow the CLI output in a straight-forward way. By streaming your BNG KPIs with model-based telemetry, you’ll get all the benefits of highly efficient, structured data delivered right to your collection stack.
Acknowledgements
Many thanks to Gurpreet for contributing his BNG expertise to this tutorial. Check out more of the BNG team’s content at https://xrdocs.io/cnbng/.
Leave a Comment