
IOS-XR power consumption monitoring: an ephemeral telemetry stack use case
Introduction
Power efficiency is a big topic as it can literally help customers save millions. Recently there has been several announcements about Cisco’s Silicon One and how it compares to a previous generation of chip on this specific point.
This post will describe how a docker-based ephemeral telemetry stack has been built to monitor Cisco IOS-XR device power consumption.
Context
As part of an upcoming CPOC (Customer Proof Of Concept) engagement, one of our customers wants to benchmark routers power consumption. Most of time, TCO (Total Cost of Ownership) calculations are made based on estimations. Cisco do provide such numbers through Cisco Power Calculator tool. However, they may vary based on several factors like ambient temperature, traffic load and pattern, optics, etc. For a fully loaded ASR 9906 with latest generation of RSP and linecards, there can be a 50% difference between the typical scenario (27C ambient temperature with 50% linerate IMIX traffic) and the worst-case scenario (50/55C)!
For this multi-vendor assessment, apples to apples comparison is required. A power meter or a smart PDU could be setup, but they require additional hardware to be purchased and installed on the premises. Instead we decided to use Model Driven Telemetry to monitor in real time Cisco’s device power consumption: it’s already available, free and we only need extra configuration. The last missing piece is a collector.
Docker-compose telemetry stack
To receive and consume power data from our routers, I decided to build an ephemeral telemetry stack which can be brought on-demand on a server or a laptop. As CPOC will be delivered over a one-week period, there is no need to build a full-blown and permanent solution. Purpose here is demonstration only.
I reused the same popular components: Telegraf, InfluxDB and Grafana. This time I decided to add Chronograf to quickly see the data stored in InfluxDB. I also leveraged Docker to build this stack and especially Docker Compose. As described in Docker’s documentation:
Compose is a tool for defining and running multi-container Docker applications. With Compose, you use a YAML file to configure your application’s services. Then, with a single command, you create and start all the services from your configuration.
There was some work done by Jeff Kehres available on GitHub. I reused it to add Telegraf and I removed the docker volumes: as this stack is ephemeral, persistent storage is not required. Full code and documentation can be found here. Here is the raw docker-compose.yaml file:
version: "2"
services:
  grafana:
    image: grafana/grafana:latest
    container_name: grafana
    restart: always
    ports:
      - '3000:3000'
    volumes:
      - ./grafana-provisioning/:/etc/grafana/provisioning
    depends_on:
      - influxdb
    environment:
      - GF_SECURITY_ADMIN_USER=admin
      - GF_SECURITY_ADMIN_PASSWORD=admin
  influxdb:
    image: influxdb:1.8
    container_name: influxdb
    restart: always
    ports:
      - '8086:8086'
    environment:
      - INFLUXDB_DB=telemetry
      - INFLUXDB_USER=admin
      - INFLUXDB_PASSWORD=admin
      - INFLUXDB_ADMIN_ENABLED=true

      - INFLUXDB_ADMIN_USER=admin
      - INFLUXDB_ADMIN_PASSWORD=admin
  chronograf:
    image: chronograf:latest
    container_name: chronograf
    ports:
      - '127.0.0.1:8888:8888'
    depends_on:
      - influxdb
    environment:
      - INFLUXDB_URL=http://influxdb:8086
      - INFLUXDB_USERNAME=admin
      - INFLUXDB_PASSWORD=admin
  telegraf:
    image: telegraf
    container_name: telegraf
    restart: always
    ports:
      - '57100:57100'
      - '57500:57500'
    environment:
      HOST_PROC: /rootfs/proc
      HOST_SYS: /rootfs/sys
      HOST_ETC: /rootfs/etc
    volumes:
     - ./telegraf.conf:/etc/telegraf/telegraf.conf:ro
     - /var/run/docker.sock:/var/run/docker.sock:ro
     - /sys:/rootfs/sys:ro
     - /proc:/rootfs/proc:ro
     - /etc:/rootfs/etc:ro
To bring up the stack, simply run:
` docker-compose up -d `
This will spawn our 4 containers to create the ephemeral telemetry stack:
{21/12/20 11:58}fcuillers-MacBook-Pro:~/Dev/telemetry fcuiller% docker-compose up -d
Creating network "telemetry_default" with the default driver
Creating telegraf   ... done
Creating influxdb ... done
Creating chronograf ... done
Creating grafana    ... done
With current configuration, following ports are exposed:
| Host Port | Service |
|---|---|
| 3000 | Grafana |
| 8086 | InfluxDB |
| 57100, 57500 | Telegraf |
| 127.0.0.1:8888 | Chronograf |
Port 57100 is used for TCP transport while 57500 is used for gRPC dial-out. telegraf.conf file can be updated to fit your configuration and environment.
Once stack is started, we can check containers are up:
{21/12/20 15:27}fcuillers-MacBook-Pro:~/Dev/telemetry fcuiller% docker ps
CONTAINER ID   IMAGE                    COMMAND                  CREATED         STATUS         PORTS                                                                              NAMES
fa0fa0f61c54   grafana/grafana:latest   "/run.sh"                3 seconds ago   Up 2 seconds   0.0.0.0:3000->3000/tcp                                                             grafana
88f308900623   chronograf:latest        "/entrypoint.sh chro…"   3 seconds ago   Up 2 seconds   0.0.0.0:8888->8888/tcp                                                             chronograf
032555f2ac94   telegraf                 "/entrypoint.sh tele…"   4 seconds ago   Up 3 seconds   8092/udp, 0.0.0.0:57100->57100/tcp, 8125/udp, 8094/tcp, 0.0.0.0:57500->57500/tcp   telegraf
320d88dbfcf3   influxdb                 "/entrypoint.sh infl…"   4 seconds ago   Up 3 seconds   0.0.0.0:8086->8086/tcp                                                             influxdb
When tests are done, you can bring down the stack with the following command:
` docker-compose down `
All metrics stored in InfluxDB and all dashboards created in Grafana will be lost.
IOS-XR models
Power statistics and counters are exposed through different Yang models.
On NCS 5500 and ASR 9000 running IOS-XR 64bit, this is achieved with Cisco-IOS-XR-sysadmin-envmon-ui:environment/oper sensor. This sensor contains information about temperatures, voltages, FAN and also power: all data you can usually find in ‘admin show environment’ command.
Here is a sample output taken from a NCS 5500 router:
RP/0/RP0/CPU0:NCS-5500#admin sh env power
Tue Dec 22 12:28:01.758 CET
================================================================================
CHASSIS LEVEL POWER INFO: 0
================================================================================
   Total output power capacity (Group 0 + Group 1) :    9000W +       0W
   Total output power required                     :    7748W
   Total power input                               :    2143W
   Total power output                              :    2003W

Power Group 0:
================================================================================
   Power       Supply     ------Input----   ------Output---      Status
   Module      Type        Volts     Amps    Volts     Amps
================================================================================
   0/PM0       3kW-AC      229.9      3.1     12.0     56.3    OK
   0/PM1       3kW-AC      231.4      3.3     12.0     58.1    OK
   0/PM2       3kW-AC      229.9      2.9     12.0     52.5    OK

Total of Power Group 0:       2143W/  9.3A      2003W/166.9A

================================================================================
   Location     Card Type            Power       Power       Status
                                     Allocated   Used
                                     Watts       Watts
================================================================================
   0/0          NC55-18H18F            456         273       ON
   0/1          NC55-24X100G-SE        940         486       ON
   0/2                 -               902           -       RESERVED
   0/3                 -                25           -       RESERVED
   0/4          NC55-36X100G-A-SE     1050         546       ON
   0/5                 -                25           -       RESERVED
   0/6                 -                25           -       RESERVED
   0/7                 -                25           -       RESERVED
   0/RP0        NC55-RP                 90          33       ON
   0/RP1               -                90           -       RESERVED
  0/FC0               -               250           -       RESERVED
   0/FC1        NC55-5508-FC2          475         191       ON
   0/FC2               -               250           -       RESERVED
   0/FC3               -               250           -       RESERVED
   0/FC4               -               250           -       RESERVED
   0/FC5               -               250           -       RESERVED
   0/FT0        NC55-5508-FAN2         775          84       ON
   0/FT1        NC55-5508-FAN2         775          83       ON
   0/FT2        NC55-5508-FAN2         775          83       ON
   0/SC0        NC55-SC                 35          15       ON
   0/SC1               -                35           -       RESERVED
RP/0/RP0/CPU0:NCS-5500#
What we are interested in is overall chassis power consumption, especially power input and power output. We would also like to get information on particular locations to monitor specific linecards.
On Cisco 8000, the sensor is different and power counters can be accessed with Cisco-IOS-XR-envmon-oper:power-management Yang model:
RP/0/RP0/CPU0:Cisco-8000#sh telemetry model-driven sensor-group POWER internal
Mon Dec 21 16:00:51.929 CET
  Sensor Group Id:POWER
    Sensor Path:        Cisco-IOS-XR-envmon-oper:power-management
    Sensor Path State:  Resolved
      Sysdb Path:       /oper/spi/gl/pwrmgmt/rack/\<spi_pwrmgmt_oper_Rack_rack\>/producers\<spi_pwrmgmt_oper_ProducerNode_nodeid\>
       Yang Path:       Cisco-IOS-XR-envmon-oper:power-management/rack/producers/producer-nodes/producer-node
      Sysdb Path:       /oper/spi/gl/pwrmgmt/rack/\<spi_pwrmgmt_oper_Rack_rack\>chassis
       Yang Path:       Cisco-IOS-XR-envmon-oper:power-management/rack/chassis
      Sysdb Path:       /oper/spi/gl/pwrmgmt/rack/\<spi_pwrmgmt_oper_Rack_rack\>/consumers\<spi_pwrmgmt_oper_ConsumerNode_nodeid\>
       Yang Path:       Cisco-IOS-XR-envmon-oper:power-management/rack/consumers/consumer-nodes/consumer-node
Router configuration
On Cisco IOS-XR telemetry is configured in 3 main blocks: sensors, subscription and destination. This time I decided to use gRPC as transport and I will export environment data every 30s from my ASR 9000 and NCS 5500:
telemetry model-driven
 destination-group DEST-GROUP
  !
  address-family ipv4 10.209.198.44 port 57500
   encoding self-describing-gpb
   protocol grpc no-tls

sensor-group ENV-COUNTERS
  sensor-path Cisco-IOS-XR-sysadmin-envmon-ui:environment/oper

subscription SUB
  sensor-group-id ENV-COUNTERS sample-interval 30000
  destination-id DEST-GROUP
As I configure gRPC export through the out of band management port, I need additional TPA configuration:
tpa
 vrf default
  address-family ipv4
   default-route mgmt
   update-source dataports MgmtEth0/RP0/CPU0/0
If TPA routing table is not updated, gRPC session will not come up and following errors in telemetry traces will appear:
RP/0/RP0/CPU0:NCS5500#sh telemetry model-driven trace all | i 10.209.198.44
Dec 21 15:56:08.925 m2m/mdt/go-info 0/RP0/CPU0 t8076  1122925 [mdt_go_trace_info]: emsMdtConnEstablish:333 Dialer type 1, request of '10.209.198.44:57500'
Dec 21 15:56:08.925 m2m/mdt/go-info 0/RP0/CPU0 t14463  1122942 [mdt_go_trace_info]: mdtConnEstablish:171 1: Dialing out to 10.209.198.44:57500, req 503
Dec 21 15:56:08.925 m2m/mdt/go-info 0/RP0/CPU0 t14463  1122944 [mdt_go_trace_info]: mdtConnEstablish:240 dial: target 10.209.198.44:57500
Dec 21 15:56:08.925 m2m/mdt/go-info 0/RP0/CPU0 t14463  1122945 [mdt_go_trace_info]: mdtDialer:243 1: namespace /var/run/netns/global-vrf, args 10.209.198.44:57500
Dec 21 15:56:13.925 m2m/mdt/go-info 0/RP0/CPU0 t21431  1129419 [mdt_go_trace_info]: mdtDialer:243 1: namespace /var/run/netns/global-vrf, args 10.209.198.44:57500
Dec 21 15:56:18.929 m2m/mdt/go-info 0/RP0/CPU0 t21627  1136268 [mdt_go_trace_error]: mdtConnEstablish:267 1: grpc service call failed, ReqId 503, 10.209.198.44:57500, rpc error: code = Unavailable desc = all SubConns are in TransientFailure
As soon as TPA is updated, gRPC session is established to the ephemeral collector:
RP/0/RP0/CPU0:ASR9000#sh telemetry model-driven destination DEST-GROUP
Tue Dec 22 10:30:03.660 CET
  Destination Group:  DEST-GROUP
  -----------------
    Destination IP:       10.209.198.44
    Destination Port:     57500
    Subscription:         SUB
    State:                Active
    Encoding:             self-describing-gpb
    Transport:            grpc
    No TLS
    Total bytes sent:     212209
    Total packets sent:   6
    Last Sent time:       2020-12-22 10:30:02.941129092 +0100

    Collection Groups:
    ------------------
      Id: 2
      Sample Interval:      30000 ms
    Encoding:             self-describing-gpb
      Num of collection:    1553
      Collection time:      Min:   744 ms Max:  8162 ms
      Total time:           Min:   651 ms Max:  8205 ms Avg:  3958 ms
      Total Deferred:       0
      Total Send Errors:    107
      Total Send Drops:     0
      Total Other Errors:   0
    No data Instances:    8697
      Last Collection Start:2020-12-22 10:29:59.938084092 +0100
      Last Collection End:  2020-12-22 10:29:00.879691092 +0100
      Sensor Path:          Cisco-IOS-XR-sysadmin-envmon-ui:environment/oper

RP/0/RP0/CPU0:ASR9000#
This is also reflected in the telemetry traces:
RP/0/RP0/CPU0:NCS5500#sh telemetry model-driven trace all | i 10.209.198.44
Dec 21 15:57:08.921 m2m/mdt/go-info 0/RP0/CPU0 t8076  1201871 [mdt_go_trace_info]: emsMdtConnEstablish:333 Dialer type 1, request of '10.209.198.44:57500'
Dec 21 15:57:08.921 m2m/mdt/go-info 0/RP0/CPU0 t14463  1201888 [mdt_go_trace_info]: mdtConnEstablish:171 1: Dialing out to 10.209.198.44:57500, req 503
Dec 21 15:57:08.921 m2m/mdt/go-info 0/RP0/CPU0 t14463  1201890 [mdt_go_trace_info]: mdtConnEstablish:240 dial: target 10.209.198.44:57500
Dec 21 15:57:08.921 m2m/mdt/go-info 0/RP0/CPU0 t14463  1201891 [mdt_go_trace_info]: mdtDialer:243 1: namespace /var/run/netns/global-vrf, args 10.209.198.44:57500
Dec 21 15:57:09.088 m2m/mdt/go-info 0/RP0/CPU0 t14463  1201949 [mdt_go_trace_info]: mdtConnEstablish:287 1: 10.209.198.44:57500, chanstat buffered num 4000, gHardlimit 13000
Dec 21 15:57:09.088 m2m/mdt/go-info 0/RP0/CPU0 t14463  1201959 [mdt_go_trace_info]: mdtConnEstablish:299 1: Ready for mdt dialout data, req 503, chan 1, 10.209.198.44:57500
Dec 21 15:57:09.090 m2m/mdt/subdb 0/RP0/CPU0 t8074  1201964 [mdt_conn_process_establish]: Got resp from ipv4 10.209.198.44, port 57500
gRPC and TPA have been covered by Viktor and Shelly in previous articles.
I’ve got the power!
Counters are stored in the ‘telemetry’ database. We can check fields directly in influxDB:
{22/12/20 12:05}fcuillers-MacBook-Pro:~/Dev/telemetry fcuiller% docker exec -it influxdb sh
# influx
Connected to http://localhost:8086 version 1.8.3
InfluxDB shell version: 1.8.3
> show databases
name: databases
name
----
telemetry
_internal
> use telemetry
Using database telemetry
> show field keys
-- snip --
name: Cisco-IOS-XR-sysadmin-envmon-ui:environment/oper/power/location/pem_attributes_grpc
fieldKey                           fieldType
--------                           ---------
card_type/value                    string
confgd_power_redundancy_mode/value string
input_current/value                string
input_current_to_ps/value          string
input_power_to_ps                  integer
input_voltage/value                string
output_current/value               string
output_current_from_ps/value       string
output_footer                      integer
output_header                      integer
output_power_from_ps               integer
output_voltage/value               string
pem_id/value                       string
power_allocated                    integer
power_consumed/value               string
power_level                        integer
power_resrv_and_alloc              integer
power_status/value                 string
protection_power_capacity          integer
ps_sum_footer                      integer
ps_type/value                      string
shelf_num                          integer
status/value                       string
supply_type/value                  string
system_power_input                 integer
system_power_used                  integer
usable_power_capacity              integer
Chassis power consumption is located in system_power_input and system_power_used. For each location, IOS-XR will allocate a power budget stored in power_allocated. Last, current power utilization per location can be found in power_consumed/value.
As seen above, some of the reported values are stored as ‘string’. Extra processing might be required to transform those keys as integer. On telegraf, this can be achieved using a convertor processor. Here is a sample example for ASR 9000 where following configuration must be added to telegraf.conf:
[[processors.converter]]
  #apply only to specified measurement
  namepass = ["Cisco-IOS-XR-sysadmin-asr9k-envmon-ui:environment/oper/power/location/pem_attributes"]
  #convert value from string to int for grafana to be happy :)
  [processors.converter.fields]
    integer = ["power_consumed/value"]
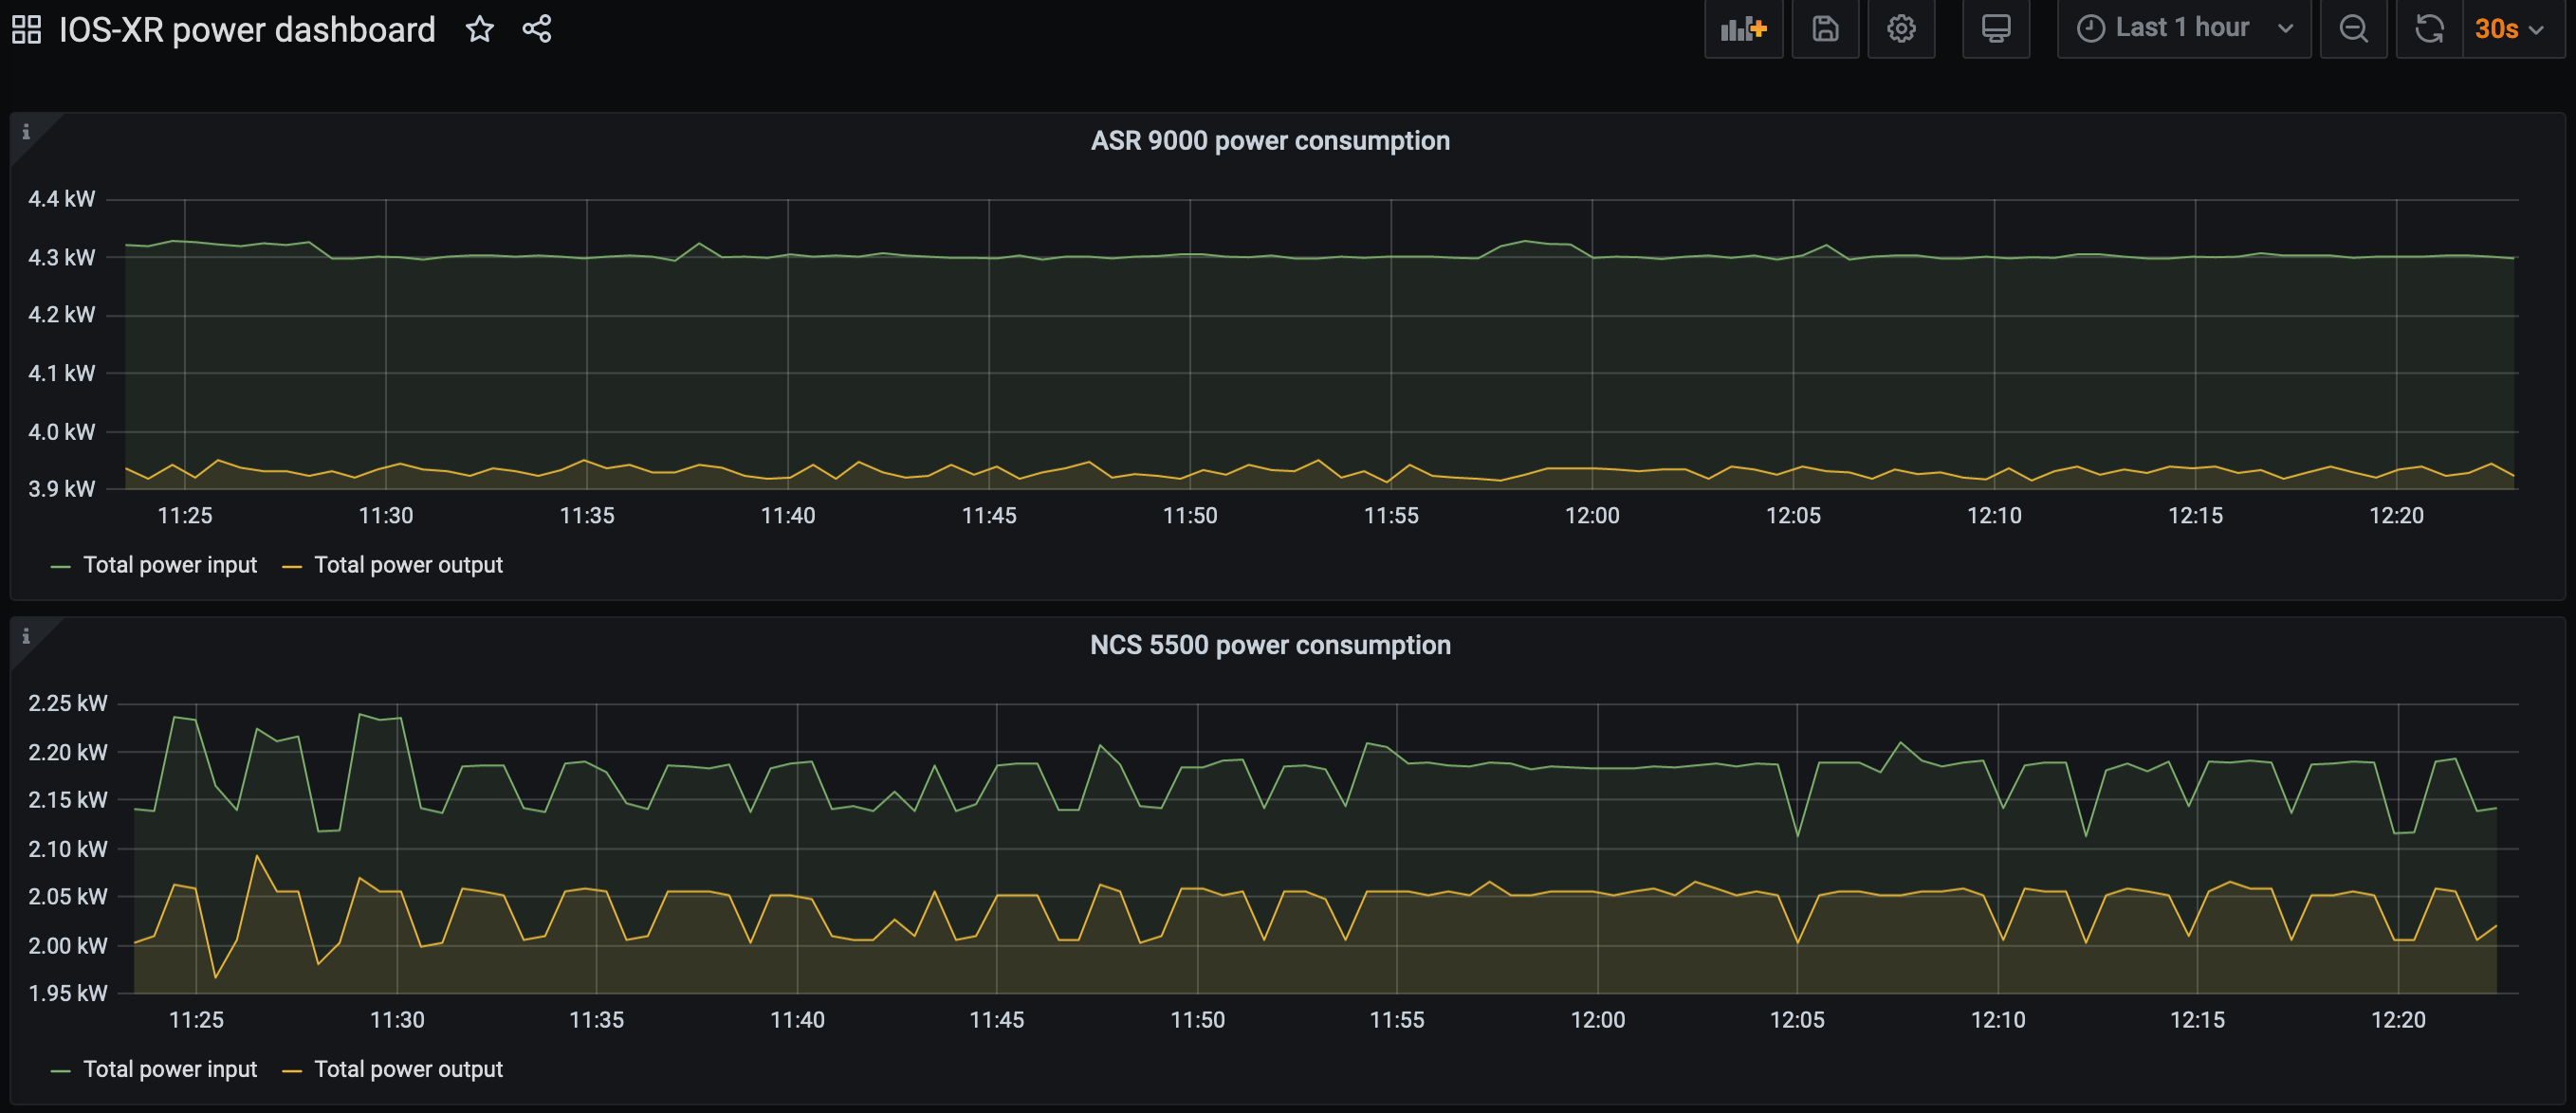
Visualization has been tested on device located in Brussels IOS-XR TAC lab. A first simple overall power consumption dashboard has been built for an ASR 9000 and a NCS 5500:
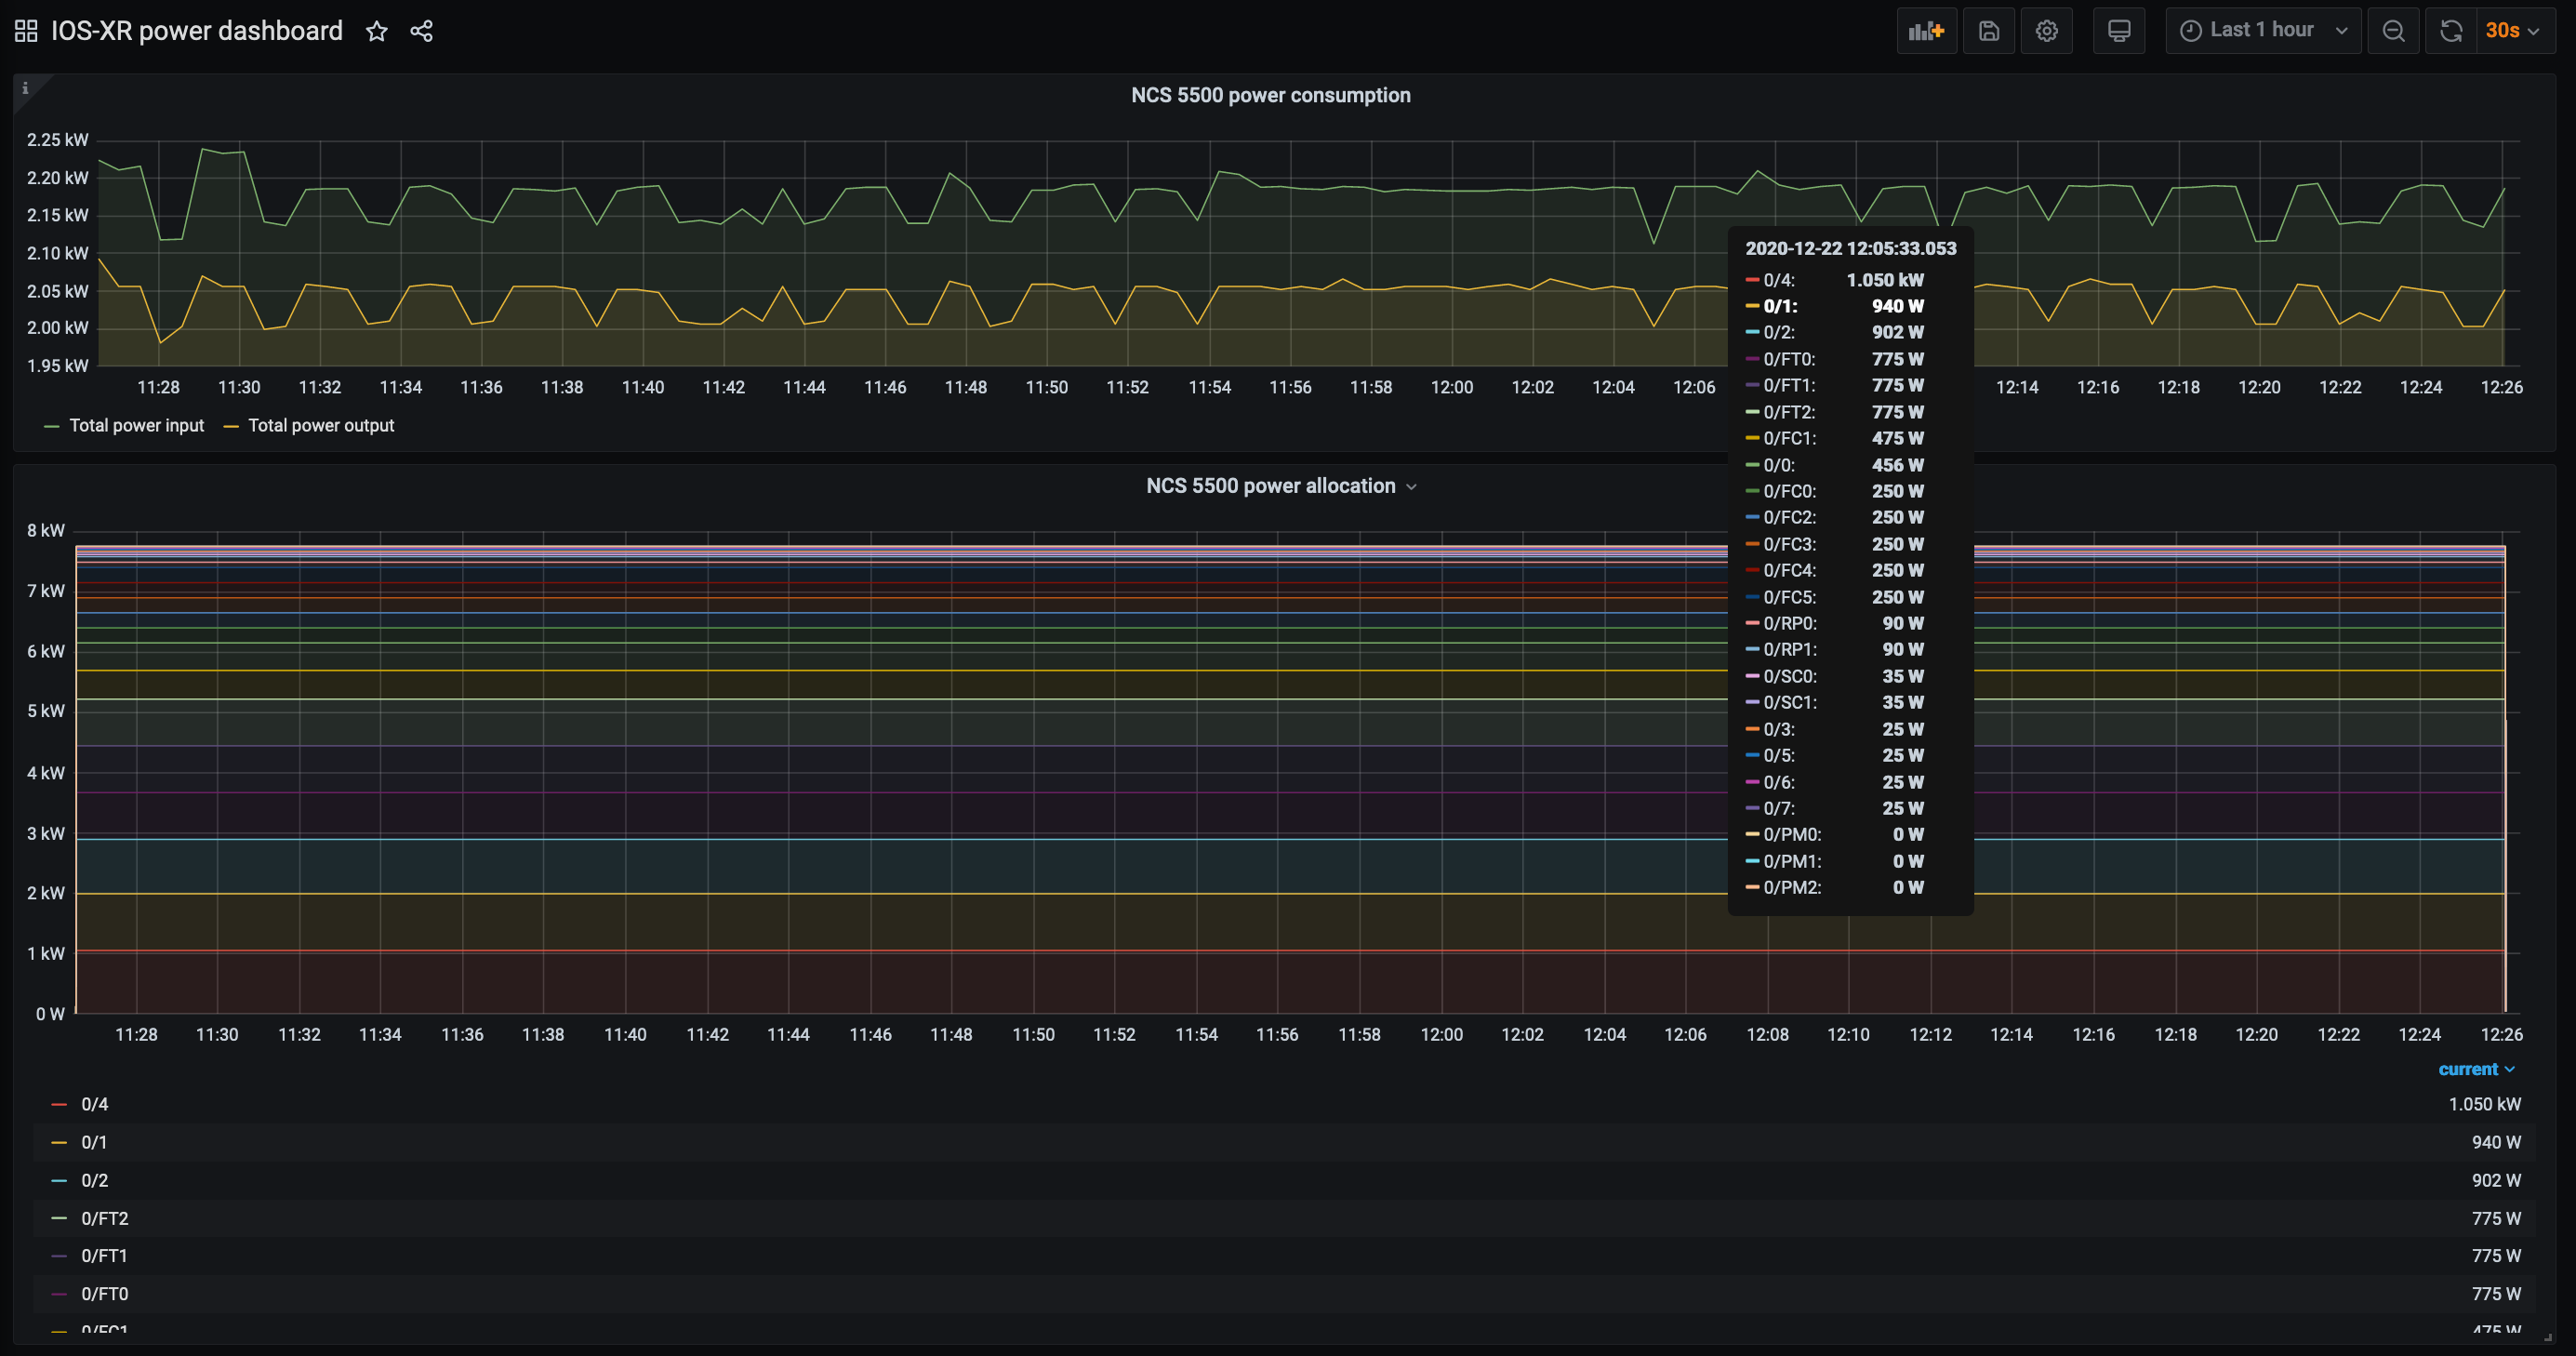
If we focus on one device, it’s interesting to compare the power budget provisioned by the router (worst case scenario) versus the ongoing power consumption. On this NCS 5500, while 7.7kW is provisioned only 2.2kW is drawn from power supplies:
Last but not least, we can also monitor power consumption per location (i.e. linecard, RP, fabric, FAN, etc.):
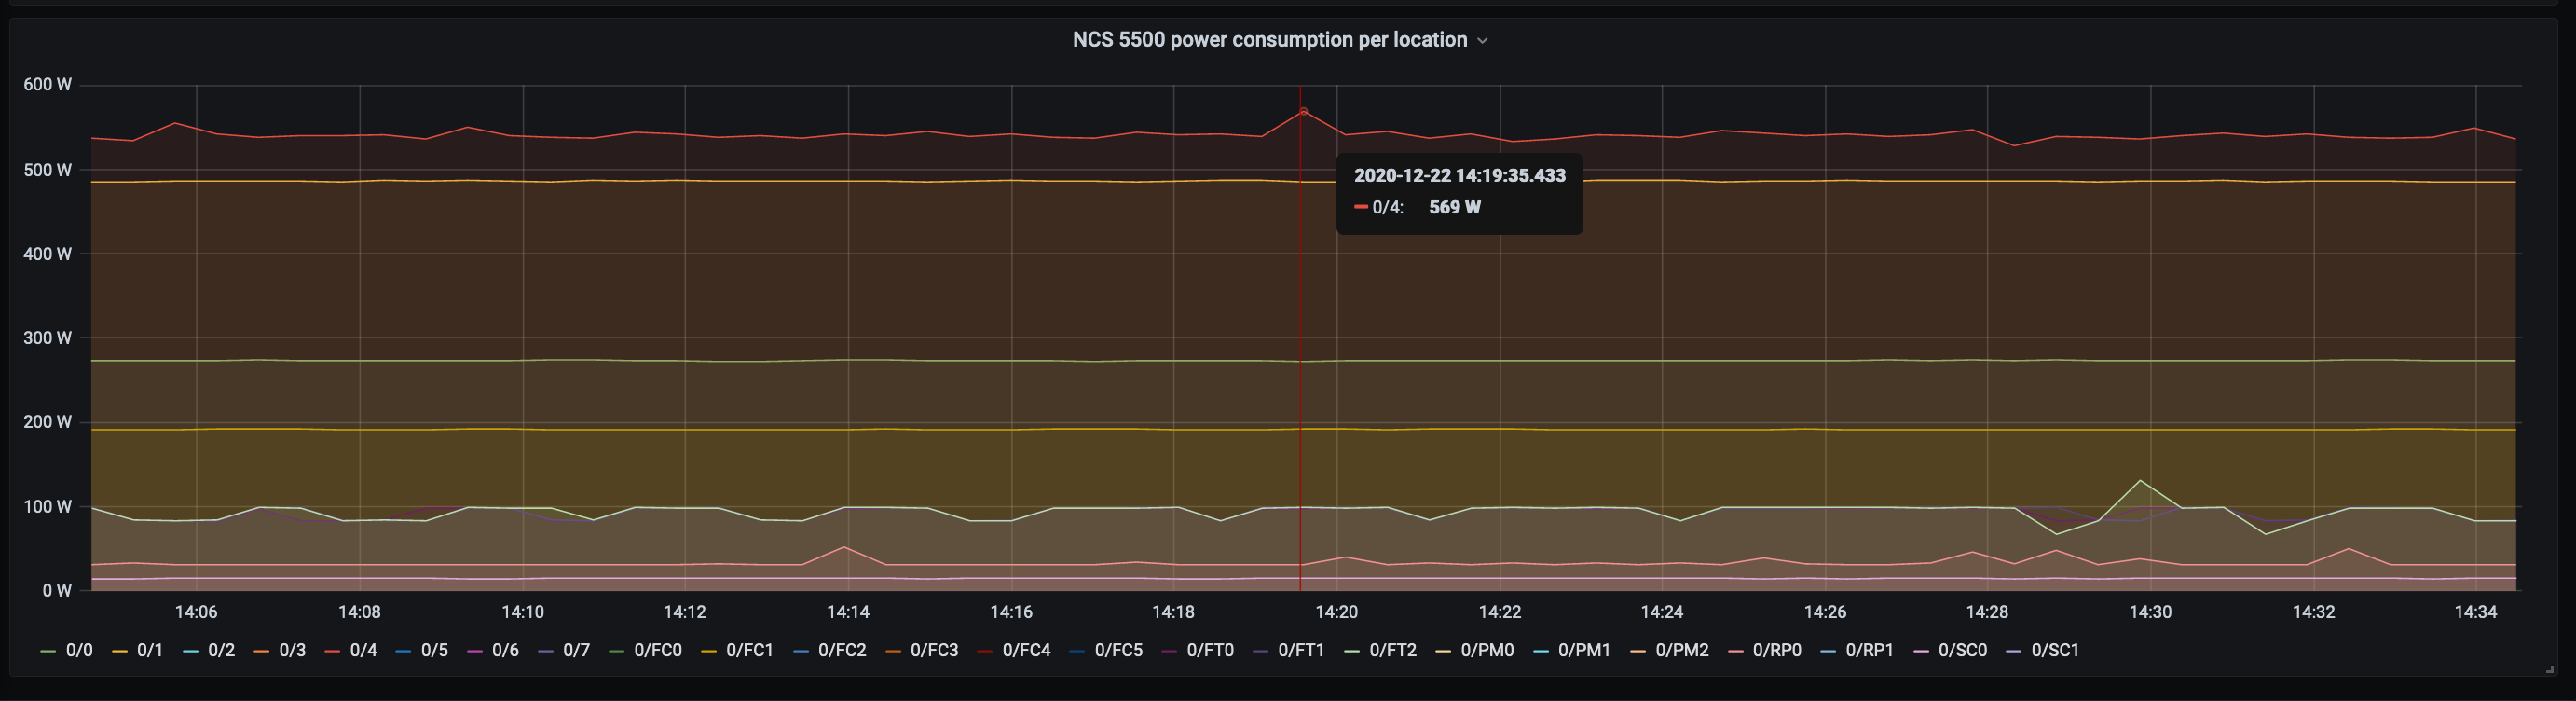
This last metric will help our customer to benchmark linecards and check the impact of different factors such traffic load, packet size, transceivers, etc.
FInally here is a configuration extract of this dashboard so you can build your own:
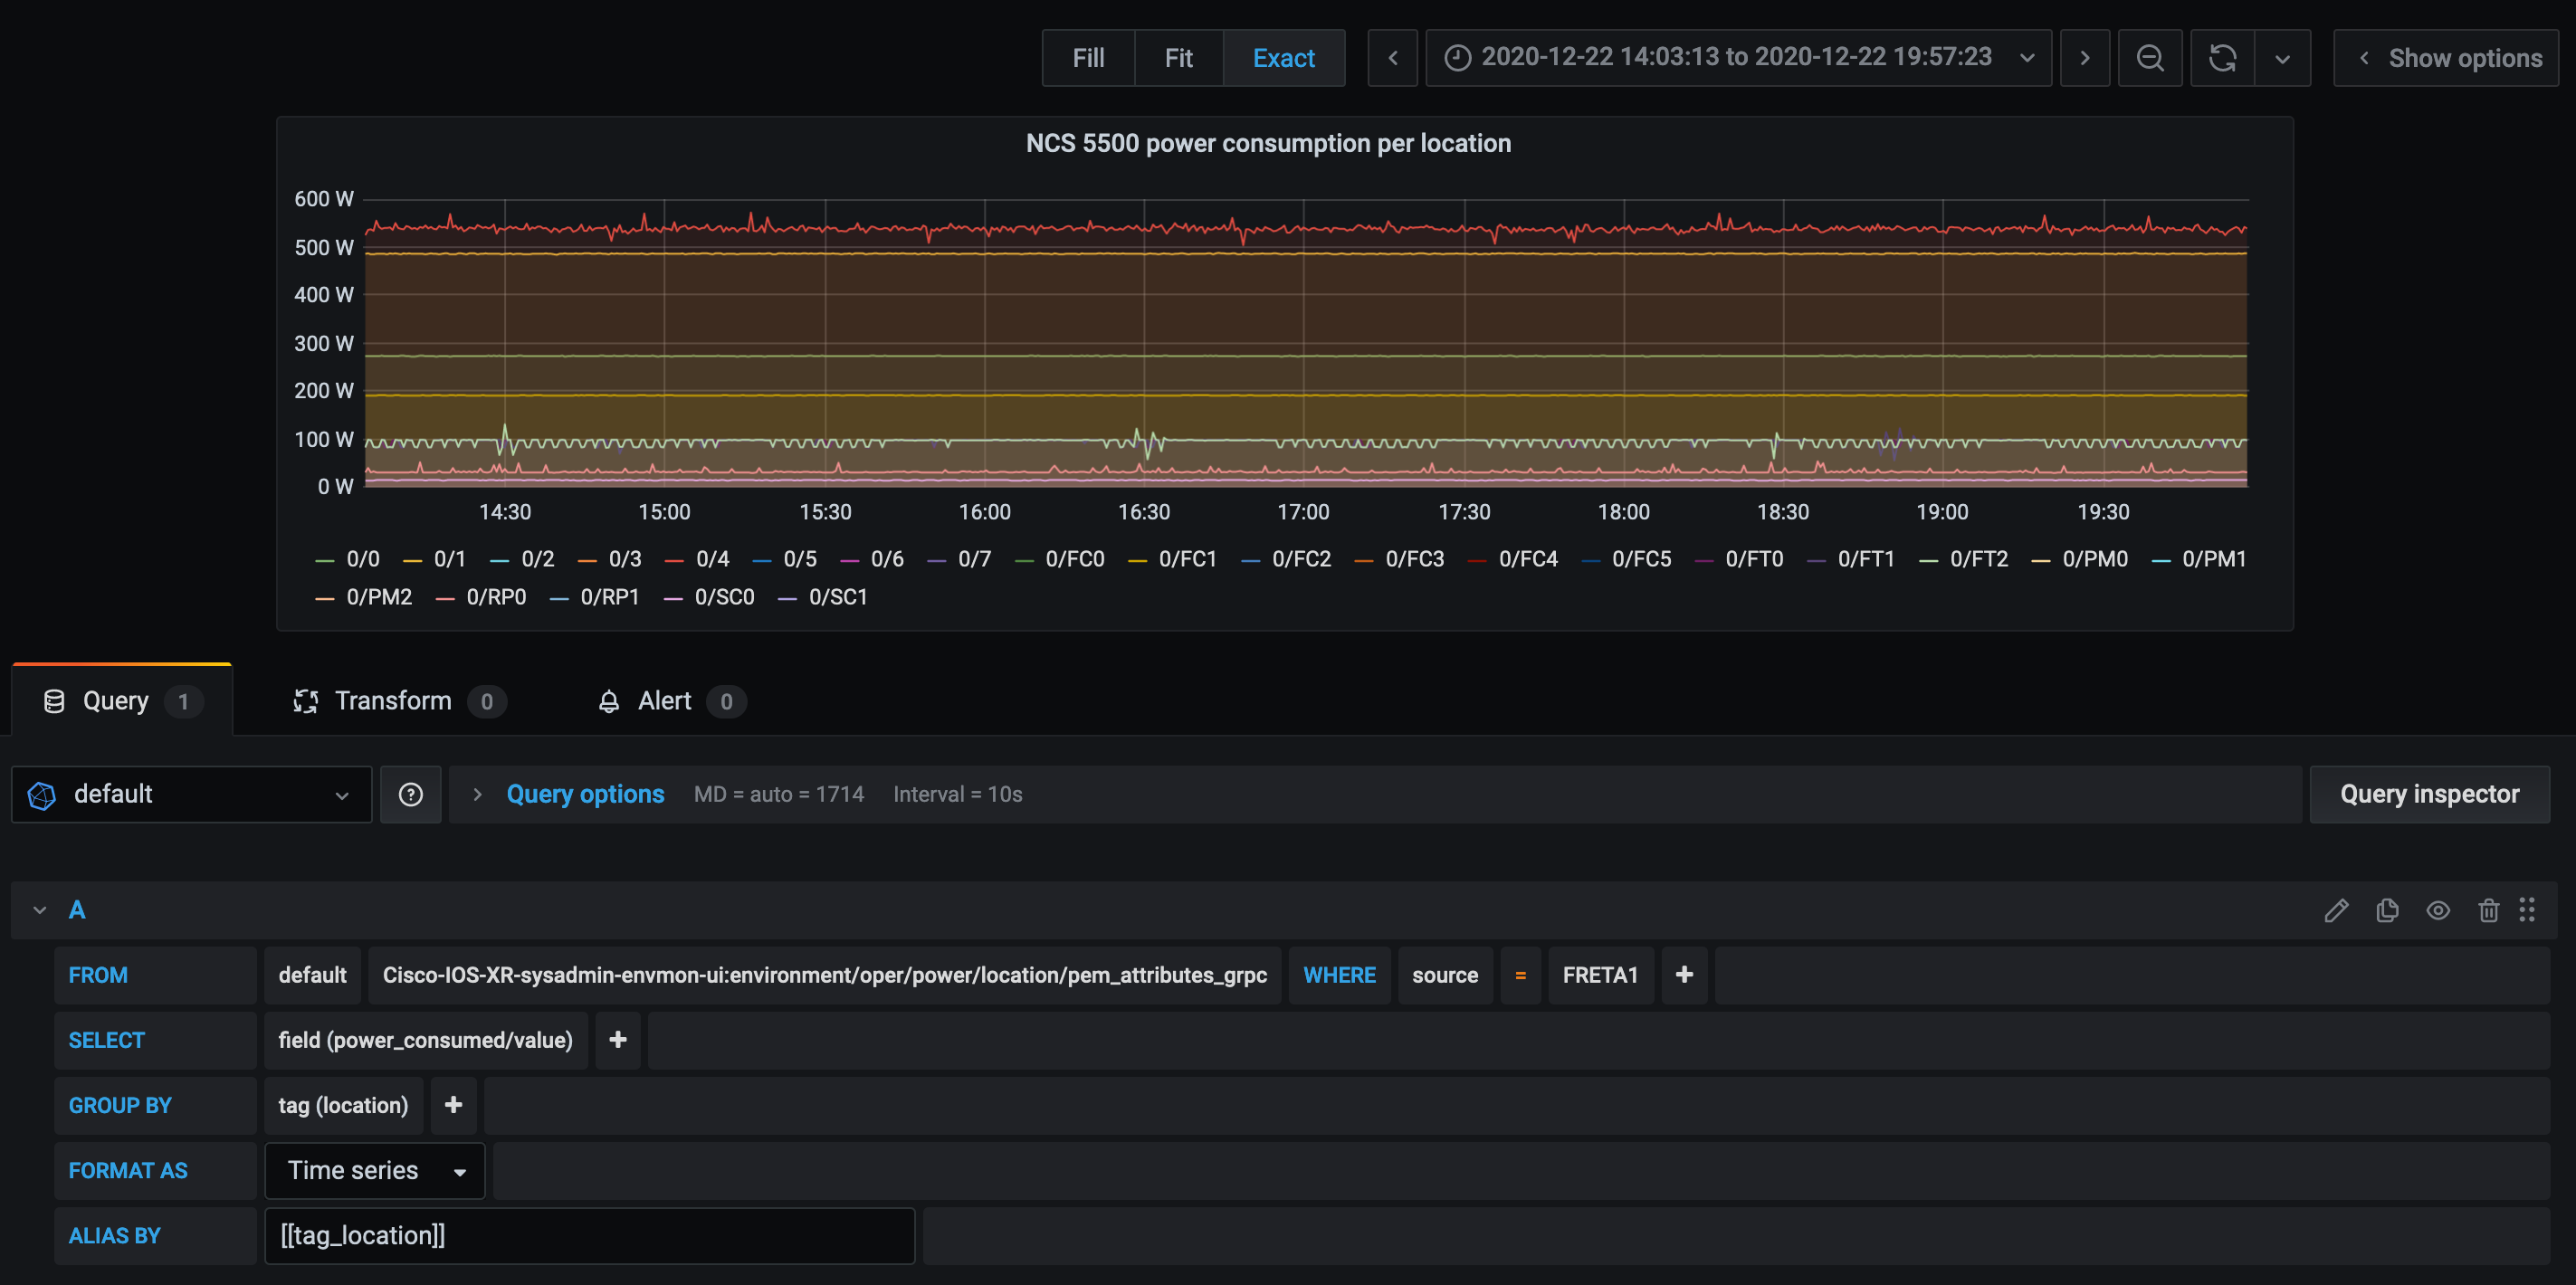
I use the location tag as an alias to dynamically display locations in the legend.
Conclusion
This was another simple and practical use case of telemetry, and we could imagine monitoring other KPI with Cisco IOS-XR environmental model like temperature, fan speed or voltages. Docker compose is a very flexible and agile solution when it comes to bring up an application stack. Combining both allows to quickly gain useful information and insights from the infrastructure.
Leave a Comment