
Root Cause Packet Drop Through Model Driven Telemetry Deployment
Introduction
As part of Cisco Customer Experience group, we are often involved in critical and very technical customer escalations. This blog post aims to describe how Model Driven Telemetry was used to identify and root cause packet drop in a large service provider production environment.
Context
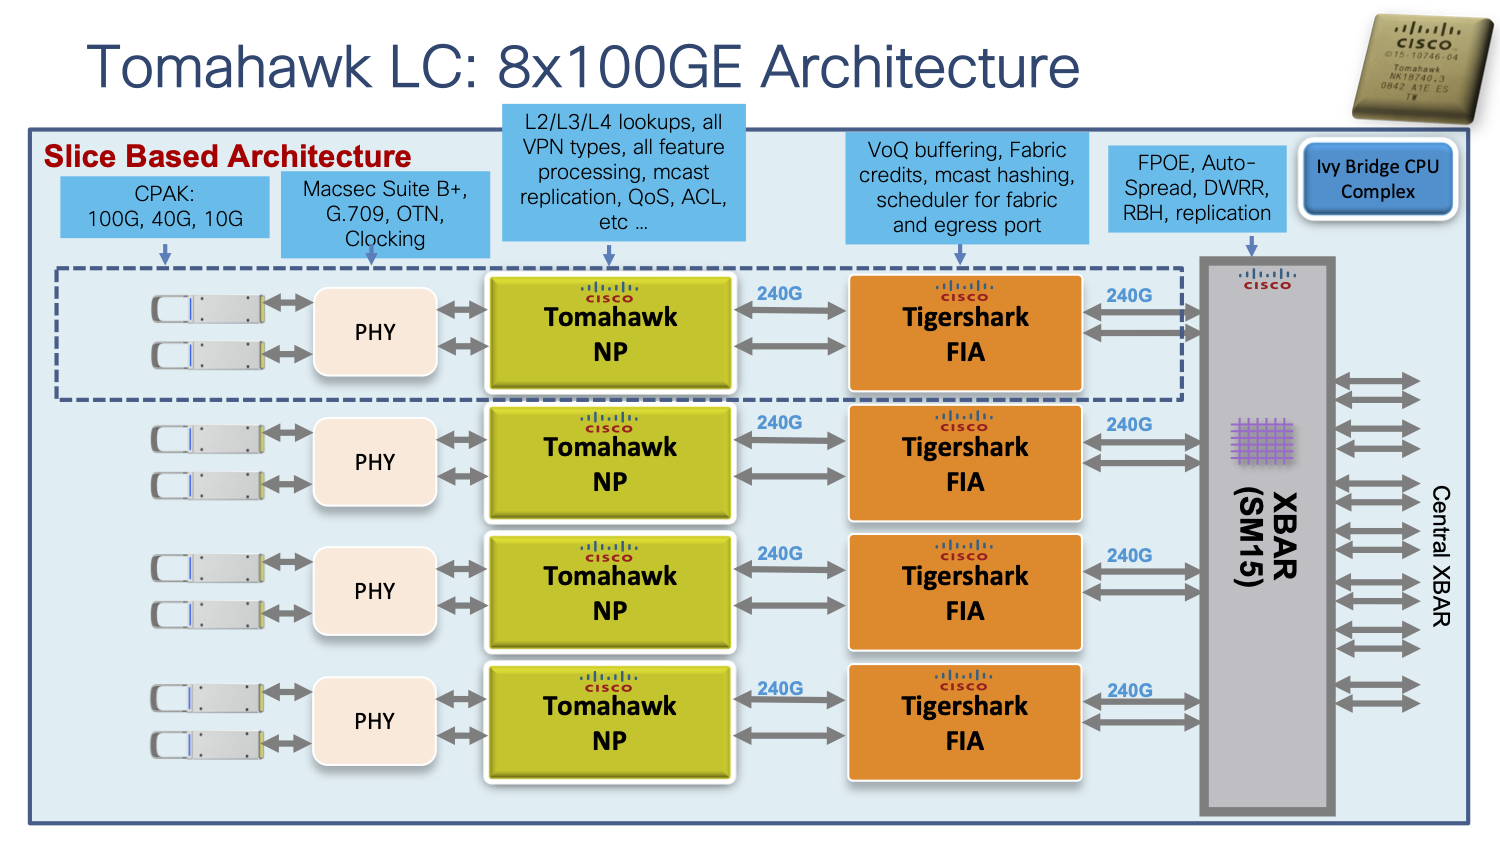
Earlier this year Cisco TAC was contacted by one of our customers to report transient packet loss, ultimately impacting their IPTV service during peak hour. Packet loss was narrowed down to ASR 9000 routers and dropped packets were identified as Early Fast Discard (EFD) at Network Processor (NP) level. This is a high-level representation view of a Cisco ASR9000 3rd generation linecard in a 8x100G configuration:
If we zoom inside a Network Processor, we can see EFD can happen in very early stages in ingress:
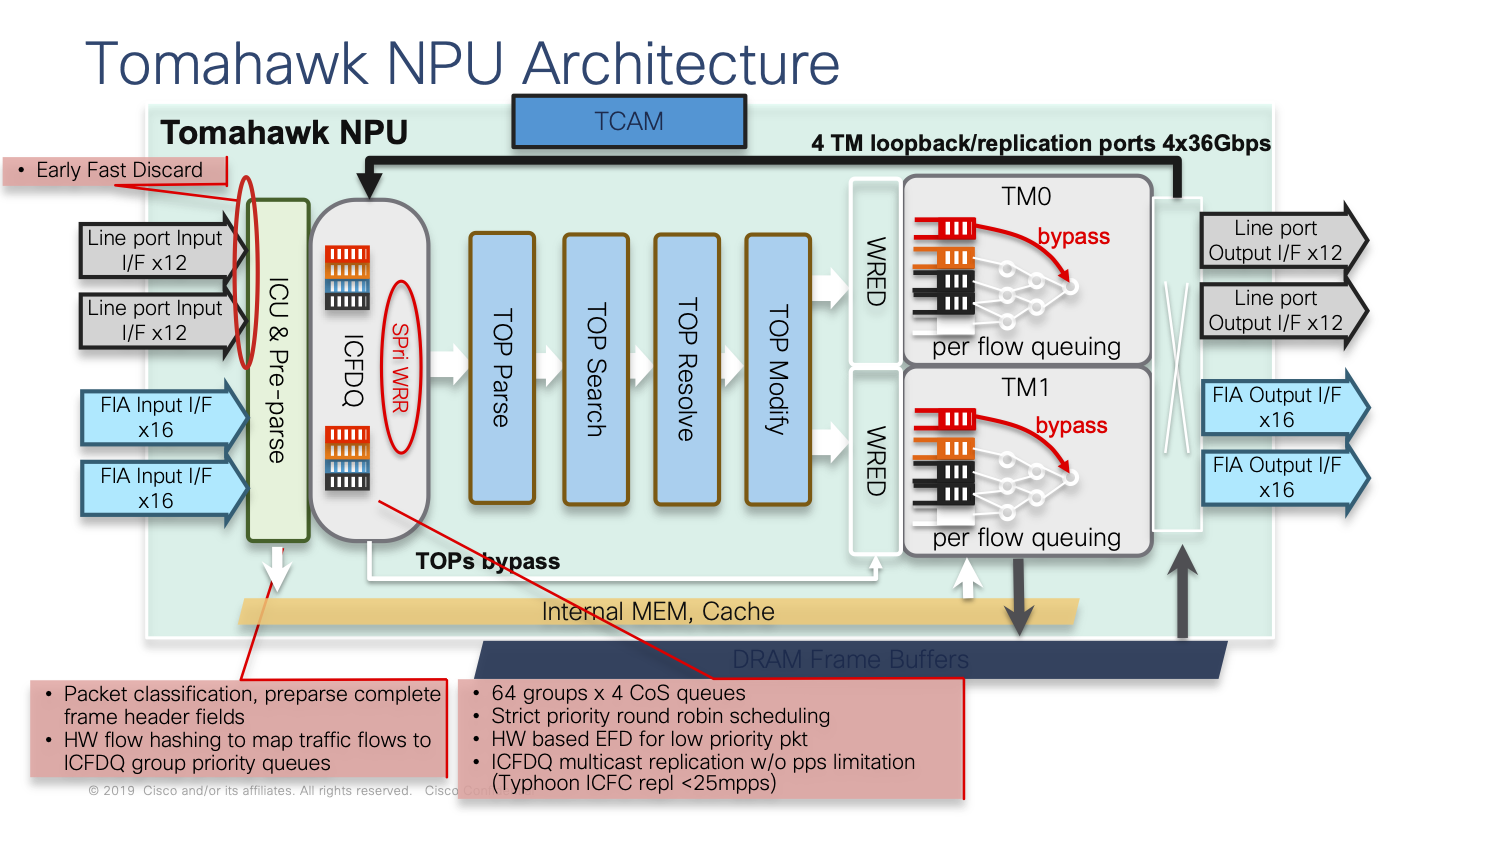
More information about ASR 9000 Early Fast Discard (EFD) can be found in BRKSPG-2904 Cisco Live presentation.
RP/0/RP0/CPU0:ASR9000#sh controllers np fast-drop all location 0/10/CPU0
Fri Feb 14 18:00:06.419 FRANCE
		Node: 0/10/CPU0:
----------------------------------------------------------------
 snip
 -------------------------------------------------------------
All fast drop counters for NP 1:
 HundredGigE0/10/0/3:[Priority1]               0
 HundredGigE0/10/0/3:[Priority2]               0
 HundredGigE0/10/0/3:[Priority3]               247
 HundredGigE0/10/0/2:[Priority1]               0
 HundredGigE0/10/0/2:[Priority2]               0
 HundredGigE0/10/0/2:[Priority3]               23451515
 -------------------------------------------------------------
Source of EFD was unknown and could be caused by several factors. An engineering Cisco IOS-XR SMU was developed to manually monitor and record average and peak RFD (Receive Frame Descriptor) utilization. As ratio between average and peak values was big (x12), we were able to demonstrate existence of bursts in this network.
Leveraging Model Driven Telemetry in production
While a manual and offline analysis through enhanced np_perf SMU was handy to prove bursts presence, this was not enough to identify when exactly they appeared, how big they were and how often they would repeat. Those events were very short and intense and could not be caught with traditional monitoring techniques which often provide 5min resolution. Moreover, we were missing critical information not available through regular SNMP MIB which would help us identify the source of those bursts.
For all those reasons and after several weeks without progress, we decided to leverage Model Driven Telemetry.
Bringing up a cloud-hosted telemetry stack
To collect and digest telemetry data from routers at scale, infrastructure is required. As we had to move fast, it was decided to implement a telemetry collection stack in a secured cloud environment. We decided to use the popular Telegraf – InfluxDB – Grafana stack. This topic has already been covered and I will only focus on key implementation details:
- IPv6 only: cloud-hosted telemetry stack is reachable via IPv6 only.
- Export is done through TCP. It was not possible to use gRPC given IOS-XR software release used in this environment.
- /etc/telegraf/telegraf.conf file is updated to add tags and avoid some values being overwritten
[[inputs.cisco_telemetry_mdt]]

# # Cisco model-driven telemetry (MDT) input plugin for IOS XR, IOS XE and NX-OS platforms
[[inputs.cisco_telemetry_mdt]]
#  ## Telemetry transport can be "tcp" or "grpc".  TLS is only supported when
#  ## using the grpc transport.
transport = "tcp"
#  ## Address and port to host telemetry listener
service_address = ":57500"

#  ## Define (for certain nested telemetry measurements with embedded tags) which fields are tags
embedded_tags = ["Cisco-IOS-XR-asr9k-np-oper:hardware-module-np/nodes/node/nps/np/counters/np_counters/counter-index", "Cisco-IOS-XR-qos-ma-oper:qos/interface-table/interface/input/service-policy-names/service-policy-instance/statistics/class-stats/class-name", "Cisco-IOS-XR-qos-ma-oper:qos/interface-table/interface/output/service-policy-names/service-policy-instance/statistics/class-stats/class-name", "Cisco-IOS-XR-asr9k-np-oper:hardware-module-np/nodes/node/nps/np/fast-drop/np_fast_drop/interface-name", "Cisco-IOS-XR-asr9k-np-oper:hardware-module-np/nodes/node/nps/np/counters/np-counter/counter-name", "Cisco-IOS-XR-asr9k-fsi-oper:fabric-stats/nodes/node/statses/stats/stats-table/fsi_stats/counter-name", "Cisco-IOS-XR-clns-isis-oper:isis/instances/instance/statistics-global/per_area_data/per_topology_data/id/af-name"]
name_suffix = "_tcp"
- Collector has been hardened through nftable filters implementation and fail2ban installation.
- Grafana interface has been secured with Let’s Encrypt certificate.
- InfluxDB data retention policy has been initially configured to 3 days and later on extended to 5 days. We were not interested in getting full history as routers were monitored in real time and a review was performed on a daily basis.
Router configuration
Model Driven Telemetry configuration is done in 3 steps.
First, we need to declare what we want to export through sensor-group. We were interested in collecting low level router KPI (NP counters, fabric counters), traffic KPI (QoS counters, interface statistics, etc.) and also some control plan statistics (ISIS, OSPF, PIM, RIB). Those counters will be used to make data correlation.
telemetry model-driven
sensor-group NP-COUNTERS
  sensor-path Cisco-IOS-XR-asr9k-np-oper:hardware-module-np/nodes/node/nps/np/fast-drop
  sensor-path Cisco-IOS-XR-asr9k-np-oper:hardware-module-np/nodes/node/nps/np/load-utilization
  sensor-path Cisco-IOS-XR-asr9k-np-oper:hardware-module-np/nodes/node/nps/np/counters/np-counter
 !
 sensor-group PIM-COUNTERS
  sensor-path Cisco-IOS-XR-ipv4-pim-oper:pim/active/default-context/traffic-counters
 !
 sensor-group QOS-COUNTERS
  sensor-path Cisco-IOS-XR-qos-ma-oper:qos/interface-table/interface/input/service-policy-names/service-policy-instance/statistics
  sensor-path Cisco-IOS-XR-qos-ma-oper:qos/interface-table/interface/output/service-policy-names/service-policy-instance/statistics
 !
 sensor-group RIB-COUNTERS
  sensor-path Cisco-IOS-XR-ip-rib-ipv4-oper:rib/rib-stats
 !
 sensor-group ISIS-COUNTERS
  sensor-path Cisco-IOS-XR-clns-isis-oper:isis/instances/instance/statistics-global
 !
 sensor-group OSPF-COUNTERS
  sensor-path Cisco-IOS-XR-ipv4-ospf-oper:ospf/processes/process/default-vrf/process-information/process-areas/process-area
 !
 sensor-group FABRIC-COUNTERS
  sensor-path Cisco-IOS-XR-asr9k-fsi-oper:fabric-stats/nodes/node
  sensor-path Cisco-IOS-XR-asr9k-xbar-oper:cross-bar-stats/nodes/node/cross-bar-table
 !
 sensor-group ETHERNET-COUNTERS
  sensor-path Cisco-IOS-XR-drivers-media-eth-oper:ethernet-interface/statistics/statistic
Then we need to define how often counters are collected. As we were troubleshooting traffic bursts, data had to be streamed at very high frequency. We decided to use 10s resolution for control-plan and interface statistics, 30s for NP and fabric counters as number of counters was huge.
telemetry model-driven
subscription SUB_MDT
  sensor-group-id NP-COUNTERS sample-interval 30000
  sensor-group-id PIM-COUNTERS sample-interval 10000
  sensor-group-id QOS-COUNTERS sample-interval 30000
  sensor-group-id RIB-COUNTERS sample-interval 10000
  sensor-group-id ISIS-COUNTERS sample-interval 10000
  sensor-group-id OSPF-COUNTERS sample-interval 10000
  sensor-group-id FABRIC-COUNTERS sample-interval 30000
  sensor-group-id ETHERNET-COUNTERS sample-interval 10000
Last, we need to describe how counters are streamed. TCP was used instead of gRPC as monitored device did not support this last one. Encoding is GPB-KV (self-describing-gpb) to accommodate Telegraf Cisco Model-Driven Telemetry (MDT) input plugin.
telemetry model-driven
 destination-group CISCO-MDT
  address-family ipv6 2001:db8::1337 port 57500
   encoding self-describing-gpb
   protocol tcp
subscription SUB_MDT
  destination-id CISCO-MDT
  source-interface Loopback6
Sensors must be in resolved state:
RP/0/RP0/CPU0:ASR9000#sh telemetry model-driven subscription SUB_MDT
Mon Sep 21 17:00:22.930 CEST
Subscription:  SUB_MDT
-------------
  State:       ACTIVE
  Source Interface:       Loopback6(Up 0x60000000)
  Sensor groups:
  Id: NP-COUNTERS
    Sample Interval:      30000 ms
    Sensor Path:          Cisco-IOS-XR-asr9k-np-oper:hardware-module-np/nodes/node/nps/np/fast-drop
    Sensor Path State:    Resolved
    Sensor Path:          Cisco-IOS-XR-asr9k-np-oper:hardware-module-np/nodes/node/nps/np/load-utilization
    Sensor Path State:    Resolved
    Sensor Path:          Cisco-IOS-XR-asr9k-np-oper:hardware-module-np/nodes/node/nps/np/counters/np-counter
    Sensor Path State:    Resolved
...
Routers will establish TCP session with the collector and start streaming telemetry:
RP/0/RP0/CPU0:ASR9000#sh telemetry model-driven destination CISCO-MDT
Mon Sep 21 17:01:29.610 CEST
  Destination Group:  CISCO-MDT
  -----------------
    Destination IP:       2001:db8::1337
    Destination Port:     57500
    Subscription:         SUB_MDT
    State:                Active
    Encoding:             self-describing-gpb
    Transport:            tcp
    No TLS
    Total bytes sent:     183646872388
    Total packets sent:   2767164
    Last Sent time:       2020-09-21 17:01:27.536123923 +0200

    Collection Groups:
    ------------------
      Id: 78
      Sample Interval:      10000 ms
    Encoding:             self-describing-gpb
      Num of collection:    285252
      Collection time:      Min:    70 ms Max:  9046 ms
      Total time:           Min:  1683 ms Max: 1084745 ms Avg:  2087 ms
      Total Deferred:       0
      Total Send Errors:    0
      Total Send Drops:     0
      Total Other Errors:   0
    No data Instances:    0
      Last Collection Start:2020-09-21 17:01:25.533967923 +0200
      Last Collection End:  2020-09-21 17:01:27.536164923 +0200
      Sensor Path:          Cisco-IOS-XR-drivers-media-eth-oper:ethernet-interface/statistics/statistic
First results
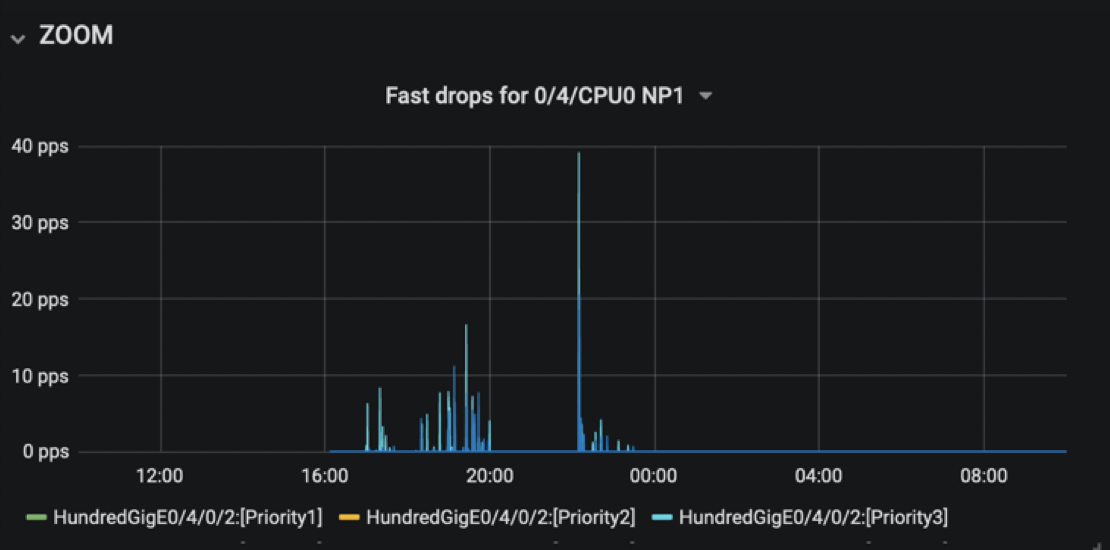
Model Driven Telemetry rapidly helped us gaining visibility into EFD, especially timestamps and volume:
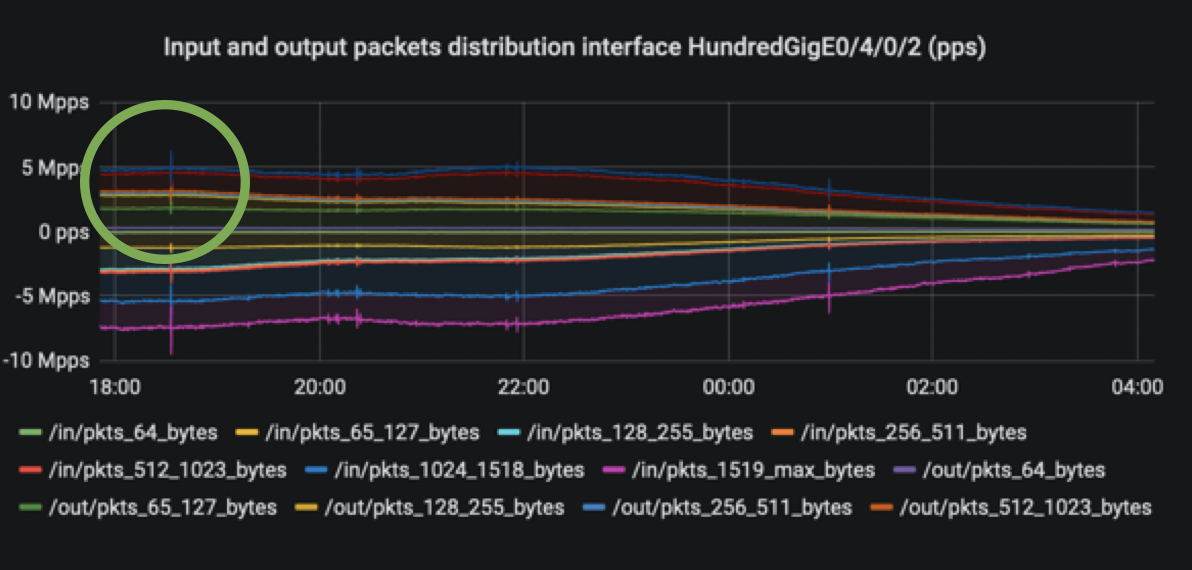
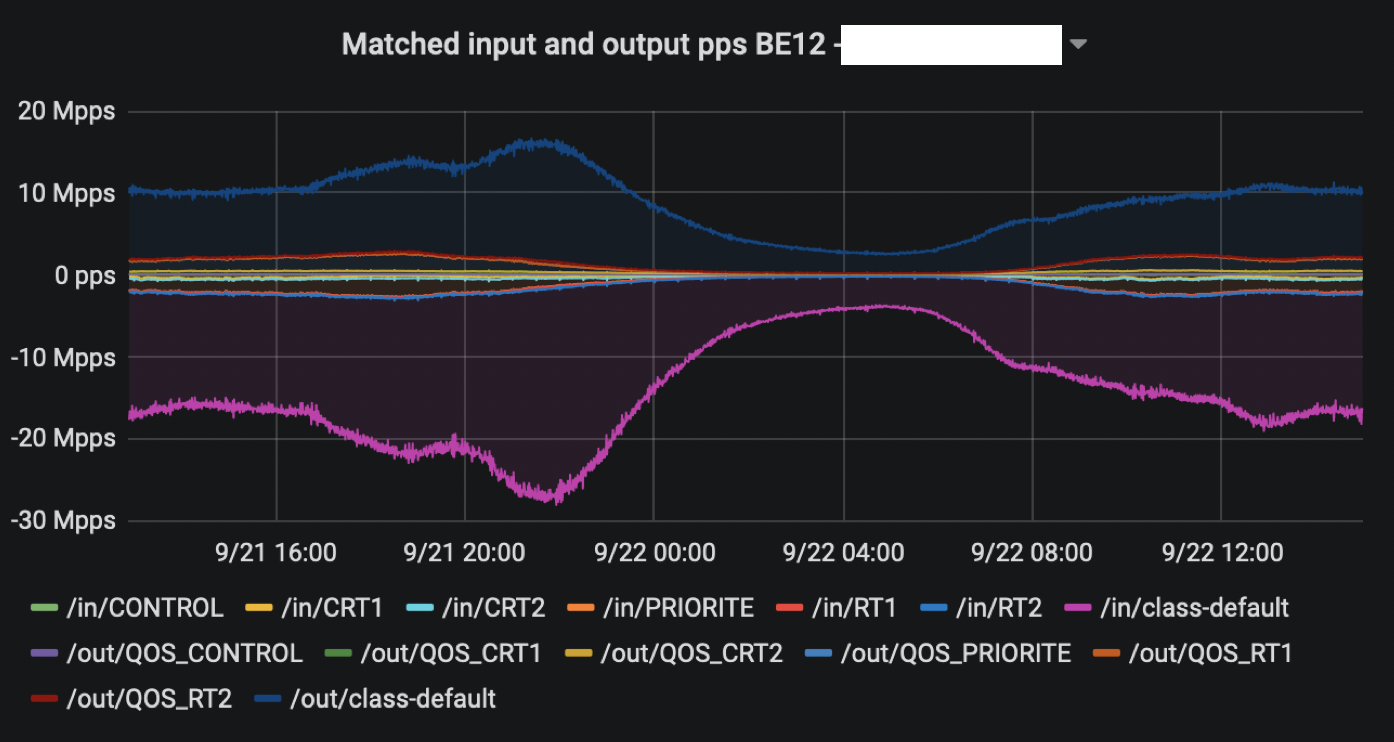
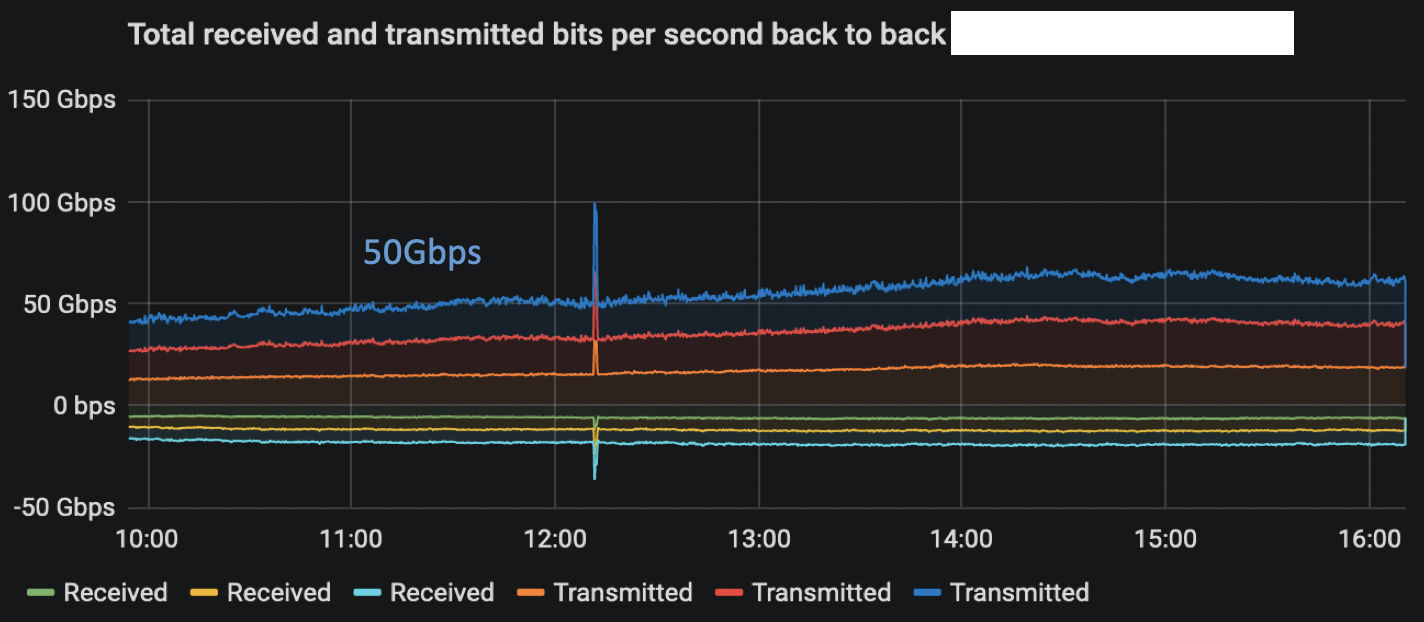
Early in our analysis we were also able to detect strange traffic pattern, like sudden traffic increase in both directions for all packet size:
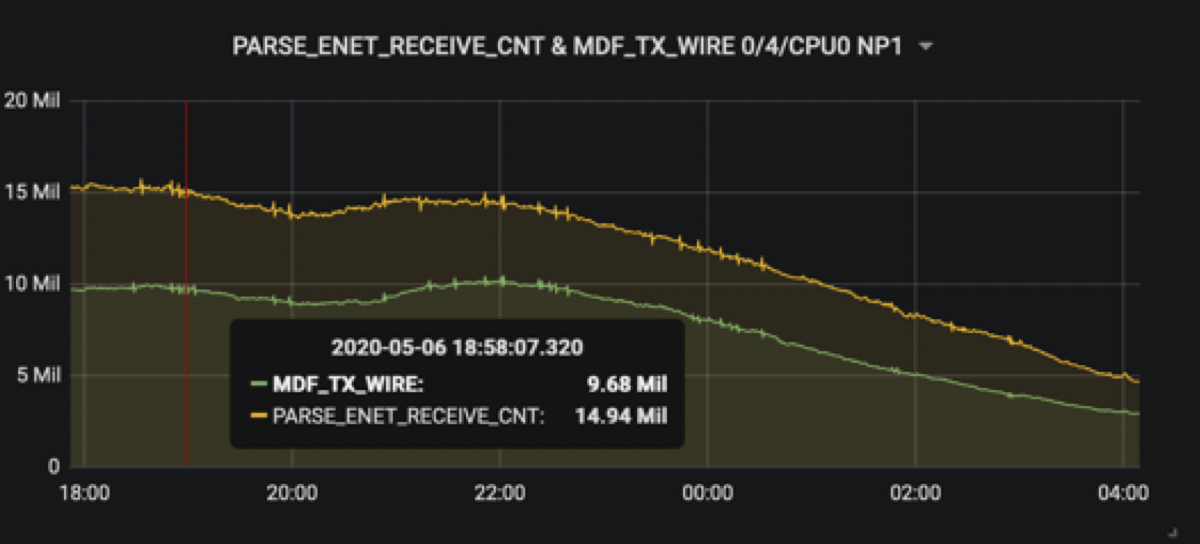
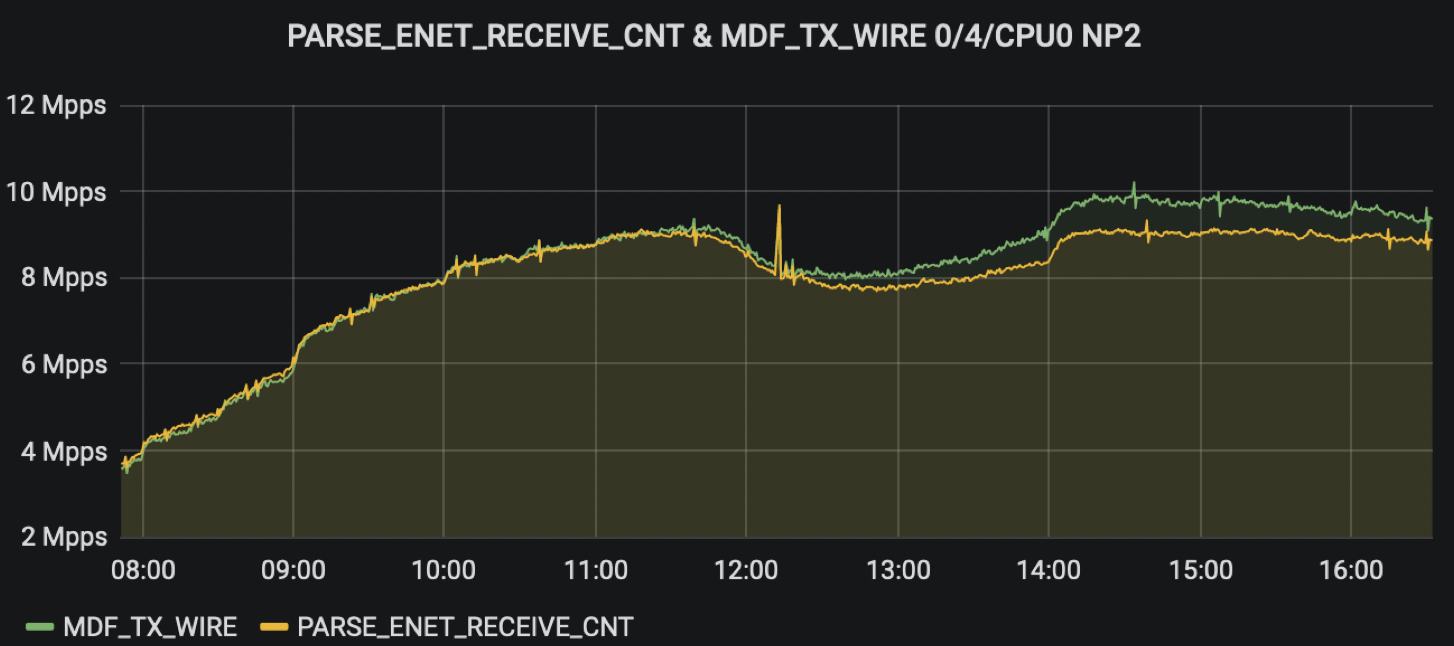
While NP load model might not be available in older software versions, it was possible to get an idea adding what was transmitted to the 100G wire and what was parsed from the ethernet port through specific NP counters monitoring:
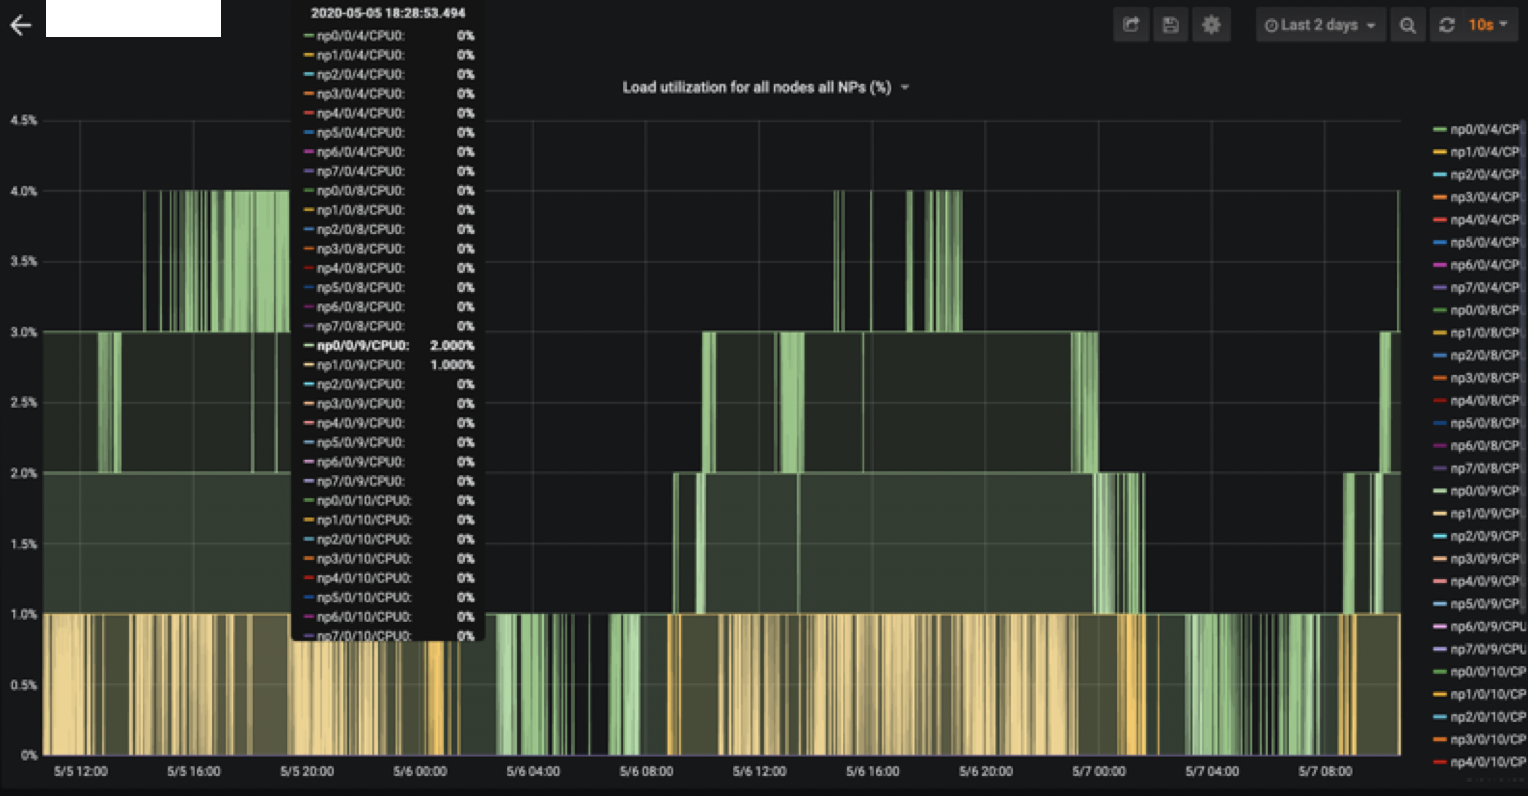
When NP load sensor was supported, we could have a real-time view of all ASR9000 NP load present in all linecards belonging to a chassis and see if capacity was exceeded:
Last, we leveraged QoS statistics to see if bursts were caused by a particular class of traffic:
Data analysis and correlation
Next phase of the project was to analyze the massive amount of data received. While Machine Learning and Artificial Intelligence are industry hot topics, I must admit all correlation has been done manually as we had to navigate through data and our many hypotheses. I will not spend time on dead end we faced and will go directly to the conclusion of this story. It turned out those bursts were caused by something we early suspected in our troubleshooting: microloops.
I will cover one occurrence we analyzed and the repeated pattern we could observe.
First, we had to catch fast-drops. This one at 12h12 was big and was caused by a 1.6Mpps burst:
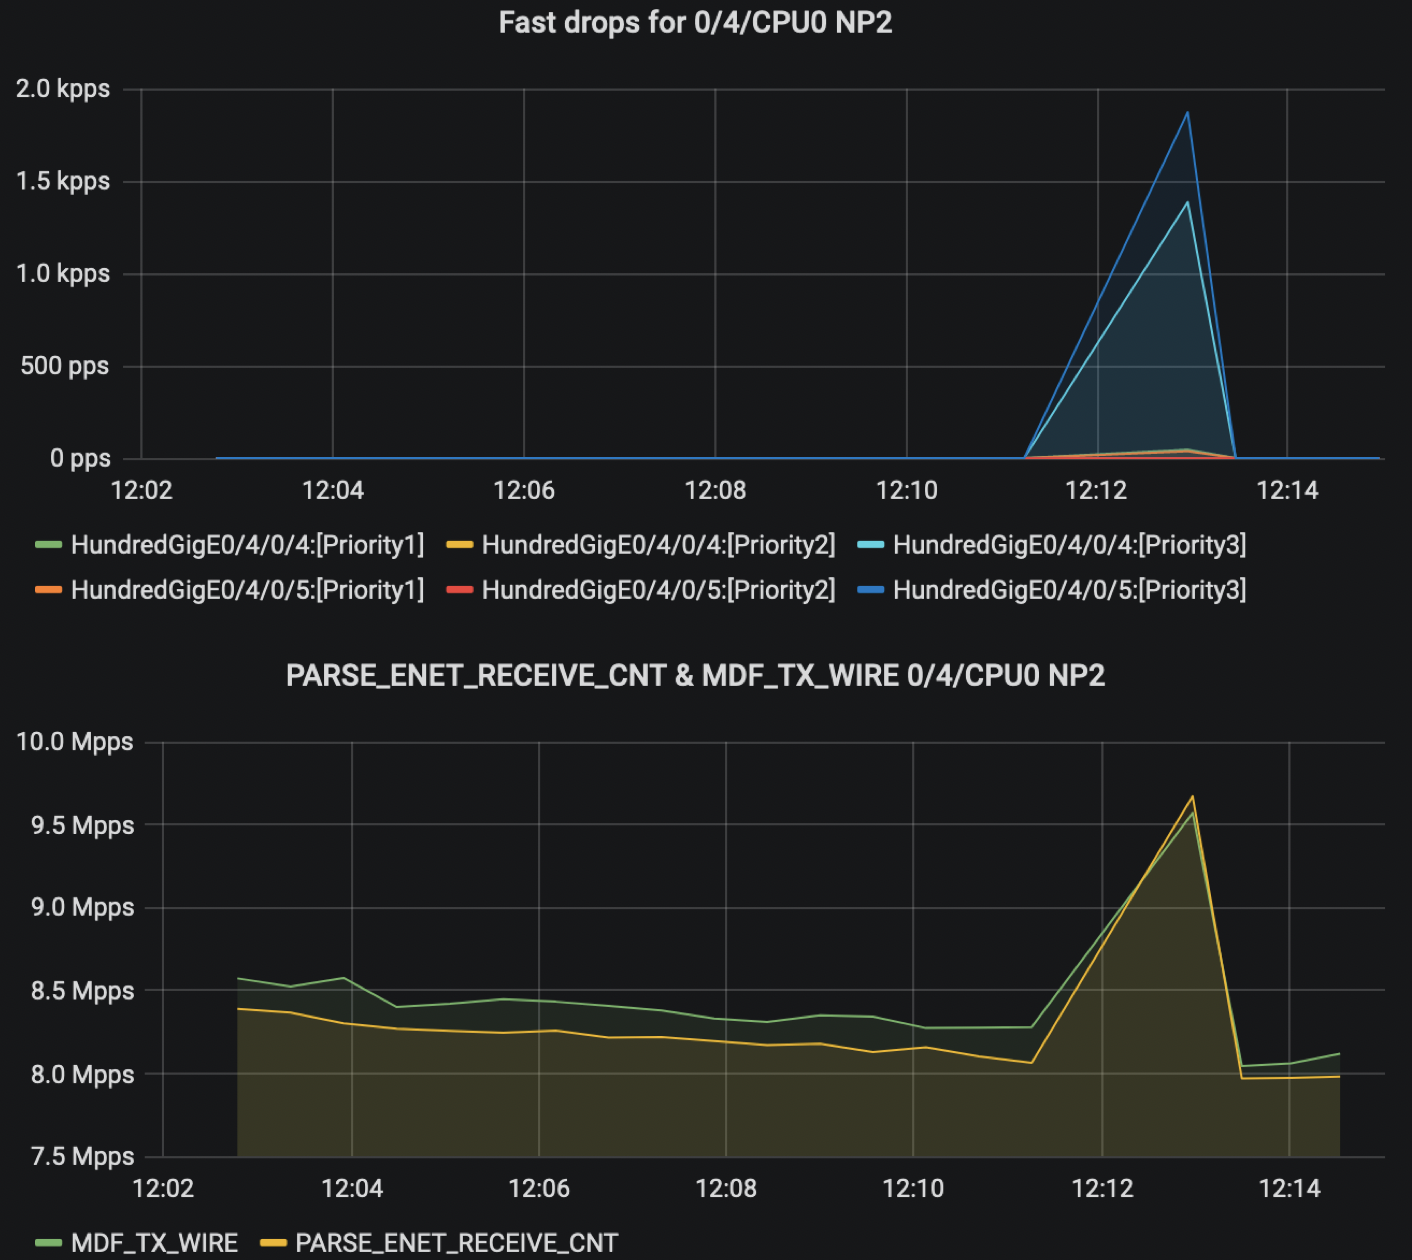
We can appreciate the peak in this graph:
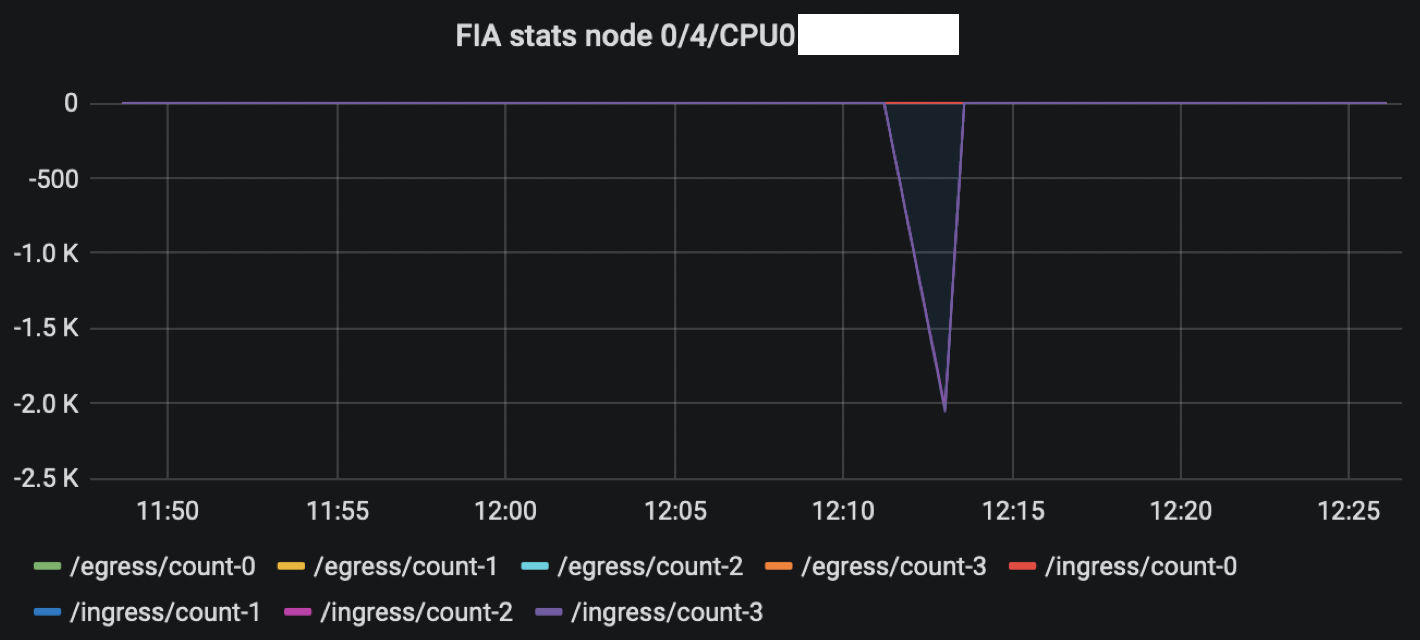
Burst was so big it ultimately triggered congestion on the egress port, causing back pressure at FIA level:
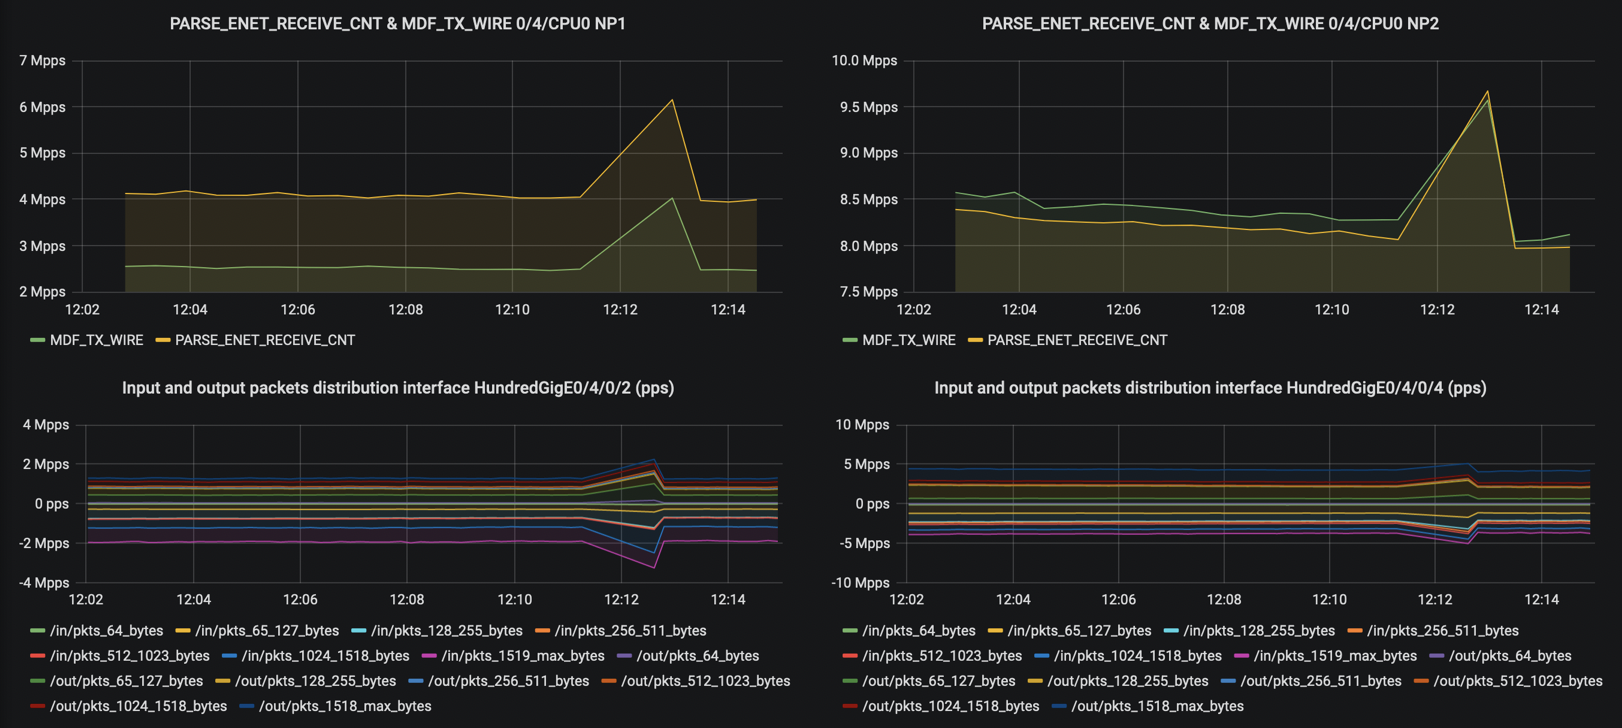
A first sign of a microloop is simultaneous traffic increase in both directions (ingress, egress) for all packet sizes, on adjacent routers:
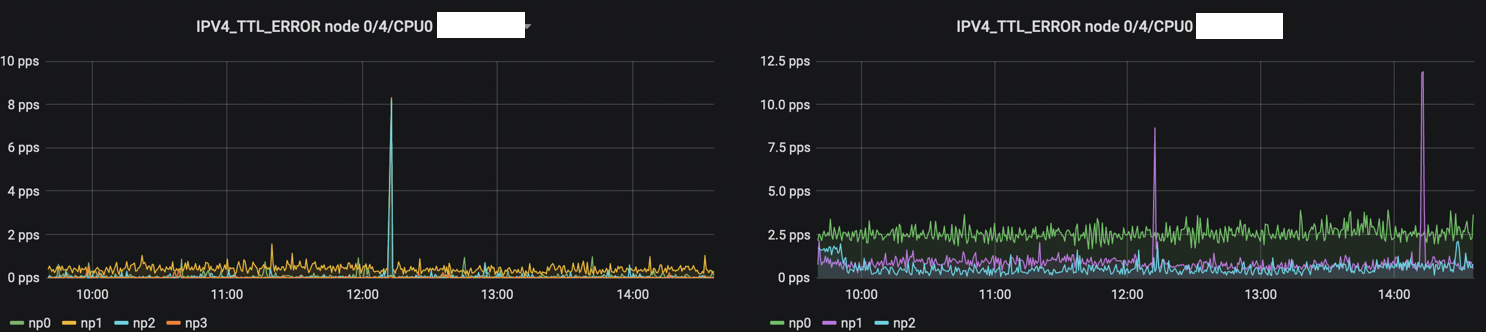
A second sign of a microloop is after certain amount of time, some packets will have their TTL expired. On ASR 9000, TTL expiration is handled by NP and there is a dedicated counter once it expires. We can also see a coinciding increase on adjacent routers here for IPv4 (same was observed for IPv6 and MPLS):
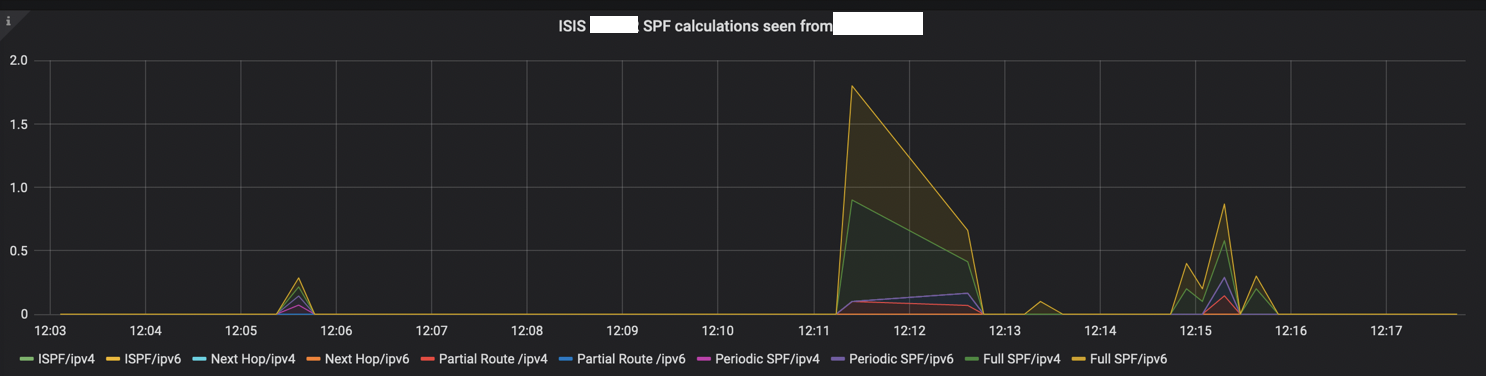
Last, this data-plane phenomenon is a reaction of a control-plane event. ISIS was put under monitoring and we were able to catch SPF calculation at this exact time:
Same pattern repeated over the day. The bigger link utilization was, the bigger was the burst caused by a microloop, the more chances EFD could appear.
Tracing loop origin
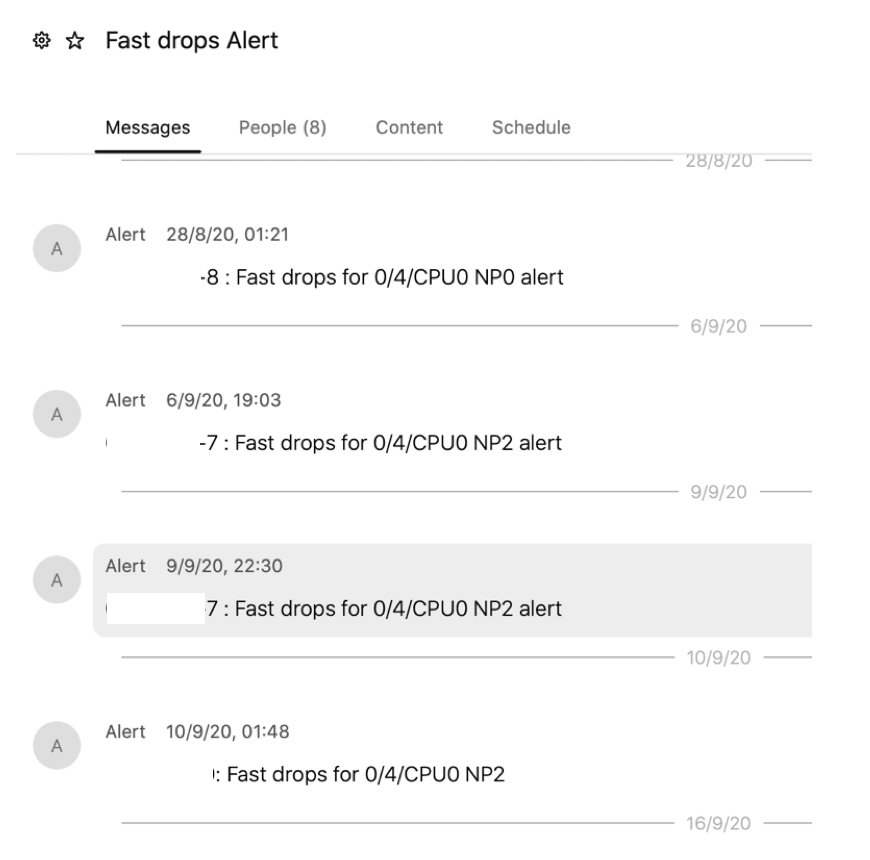
This one was harder as telemetry was little or limited help here. A first thing we did was getting alerted in real-time. For this, Sonia Ben Ayed developed a chat-bot and leveraged Cisco Webex Teams API and Grafana alerting webhook features. Every time a fast-drop was detected, a bot would send a message through a dedicated space.
We could then connect on a router in live and capture show isis spf-log to identify source of convergence:
RP/0/RSP0/CPU0:ASR9000#sh isis spf-log
Tue May  5 23:32:48.824 FRANCE
   IS-IS CORE Level 1 IPv4 Unicast Route Calculation Log
                    Time Total Trig.
Timestamp    Type   (ms) Nodes Count First Trigger LSP    Triggers
------------ ----- ----- ----- ----- -------------------- -----------------------
--- Tue May  5 2020 ---
22:51:15.978  FSPF     1   838     1      R1.00-00 LINKBAD
22:51:18.514  FSPF     1   838     1      R1.00-00 LINKGOOD
As those events could happen at any time, we decided to leverage an old Cisco IOS-XR feature called Route Convergence Monitoring and Diagnostics (RCMD). If we take CCO description this looked like a perfect tool for our use case:
Route Convergence Monitoring and Diagnostics (RCMD) is a mechanism to monitor OSPF and ISIS convergence events, gather details about the SPF runs and time taken to provision routes and LDP labels across all LCs on the router.
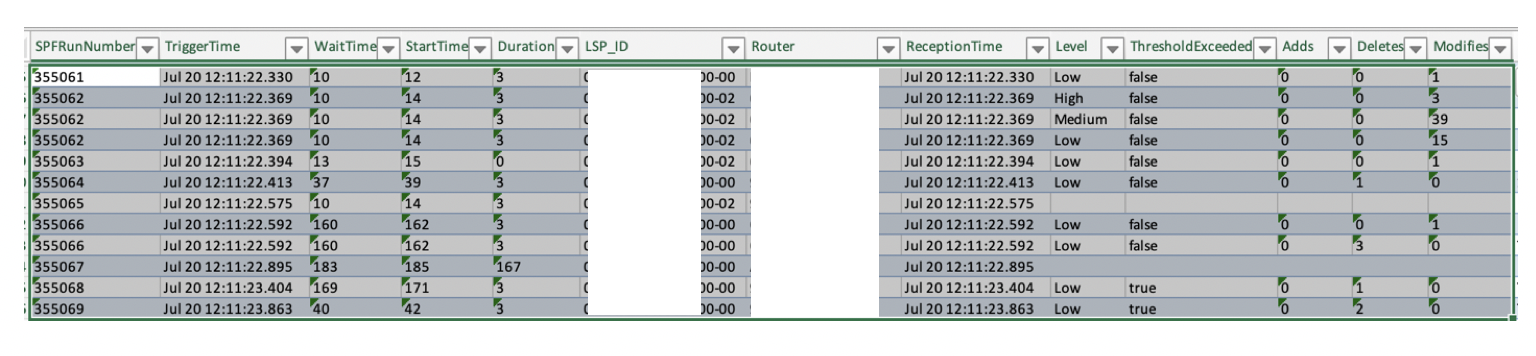
RCMD data export through Model Driven Telemetry was successfully tested in lab but customer did not want to pursue in this direction due to privacy reason. Instead, Sonia Ben Ayed developed a python script to parse, analyze and render RCMD results in a spreadsheet:
We could then focus our troubleshooting on specific nodes and identify source of convergence. Pareto Principle: 80% of convergence were caused by 20% of unstable interfaces.
RP/0/RSP0/CPU0:2020 Jul 15 21:44:38.080 : isis[1009]: %ROUTING-ISIS-5-ADJCHANGE : Adjacency to R1 (TenGigE100/0/0/29) (L1) Up, Restarted
RP/0/RSP1/CPU0:2020 Jul 15 21:44:38.085 : isis[1009]: %ROUTING-ISIS-5-ADJCHANGE : Adjacency to R1 (TenGigE100/0/0/29) (L1) Up, Restarted
RP/0/RSP1/CPU0:2020 Jul 15 21:44:44.752 : isis[1009]: %ROUTING-ISIS-5-ADJCHANGE : Adjacency to R1 (TenGigE100/0/0/29) (L1) Down, Neighbor forgot us
RP/0/RSP0/CPU0:2020 Jul 15 21:44:44.748 : isis[1009]: %ROUTING-ISIS-5-ADJCHANGE : Adjacency to R1 (TenGigE100/0/0/29) (L1) Down, Neighbor forgot us
RP/0/RSP1/CPU0:2020 Jul 15 21:45:51.135 : isis[1009]: %ROUTING-ISIS-5-ADJCHANGE : Adjacency to R1 (TenGigE100/0/0/29) (L1) Up, Restarted
RP/0/RSP0/CPU0:2020 Jul 15 21:45:51.131 : isis[1009]: %ROUTING-ISIS-5-ADJCHANGE : Adjacency to R1 (TenGigE100/0/0/29) (L1) Up, Restarted
RP/0/RSP1/CPU0:2020 Jul 15 21:45:58.752 : isis[1009]: %ROUTING-ISIS-5-ADJCHANGE : Adjacency to R1 (TenGigE100/0/0/29) (L1) Down, Neighbor forgot us
RP/0/RSP0/CPU0:2020 Jul 15 21:45:58.747 : isis[1009]: %ROUTING-ISIS-5-ADJCHANGE : Adjacency to R1 (TenGigE100/0/0/29) (L1) Down, Neighbor forgot us
When checking interface in detail:
RP/0/RSP0/CPU0:ASR9000#sh int TenGigE100/0/0/29
Thu Jul 16 15:26:56.683 CEST
TenGigE100/0/0/29 is up, line protocol is up
  Interface state transitions: 427
Lessons learnt, some numbers and next steps
Of course, we encountered few problems during this project and I will share them with you.
The first one was a bug present in IOS-XR 6.2.3 where router was picking the wrong IPv6 source address to initiate the TCP session toward the telemetry collector. As we had strict firewall rules filtering /128 loopbacks, we had to update them to whitelist customer’s infrastructure IPv6 block. Fix is included in IOS-XR 6.3.3 released in 2018.
Second challenge we faced was a bug in the Cisco-IOS-XR-qos-ma-oper yang model in 6.2.3. Statistics could not be collected and sensor-group was not resolved. This was corrected in IOS-XR 6.3.2.
Regarding this specific packet drop and EFD problem, few corrective actions are in progress. It was found ISIS SPF and LSP timers were very aggressive and not aligned on all routers. Unstable interfaces have been isolated and dampening will be deployed to avoid ISIS churn.
Another modification was performed on ASR9000 directly. Early Fast Discard classification has been updated on production routers to accommodate customer QoS marking and Cisco IOS-XR code was improved to allow RFD threshold increase on Cisco ASR9000 3rd generation linecards. With Segment Routing deployment in this specific network, Microloop Avoidance feature is being assessed.
After 23 weeks this cloud-hosted telemetry stack is still running without any problem. It received 20 Terabytes of counters so far. Few evolutions could be done:
- Use gRPC with TLS encryption instead of TCP. This can be done once routers are upgraded to IOS-XR 64bit
- Install on-premise telemetry stack. Cloud nature prevented us receiving and processing additional KPI which could have been useful for this troubleshooting (e.g Netflow, BGP BMP)
Acknowledgement
I would like to recognize Sonia Ben Ayed, Consulting Engineer at Cisco. Sonia made outstanding work over the last six months and helped me setting up this cloud-hosted telemetry stack which delivered strong results. Congratulations to her.
I would also like to thank many Cisco employees involved in this escalation: Service Provider Engineering teams CK Chao and Shawn Smith; Escalation team Aleksandar Vidakovic and Xander Thuijs; Customer Experience team JC Rode, Luc De Ghein, Mark Culverhouse, Stefan-Alexandru Manza, Olivier Keiser, Frederic Vanderbecq and many others for their technical support.
Last but not least, our customers for their trust.
Leave a Comment