
XR Embedded Packet Tracer
Introduction
IOS XR Embedded Packet Tracer is a framework that provides the user with a capability to trace custom flows through the router, for service validation or troubleshooting purposes.
IOS XR Embedded Packet Tracer is protocol agnostic, it works on any type of unicast or multicast packets.
This document is a user guide, with additional insight into the architecture of the XR Packet Tracer.
IOS XR Embedded Packet Tracer support starts with IOS XR release 7.1.2 and ASR 9000. Other XR product families will be supported in future. XR release 7.1.2 provides the very basic functionality that the packet tracer can deliver. Further development directions will depend much on your feedback.
Packet Tracer YouTube Demo Video
For a quick overview of what you can expect from the XR Embedded Packet Tracer, watch this short video:
XR Embedded Packet Tracer Framework Architecture
When packet tracing is enabled on an interface, the Network Processor (NP) checks whether received packets are matching the specified condition. If packet matches the condition, a flag is set in the internal packet header. This flag in the internal packet header allows for the tracing of this packet on all elements in the data-path and punt-path inside the router.
For more details on the packet tracer architecture, refer to Appendix 1.
In XR release 7.1.2 packet tracing is supported only in ASR9000 data-path. Support is available on 3rd, 4th and 5th generation line cards (aka Tomahawk, Lightspeed and Lightspeed Plus). Packet tracing support by processes participating in the punt/inject path will be available in future IS XR releases.
On ASR9000 network processor microcode (in case of Tomahawk) and packet processing engine code (in case of Lightspeed) participate in the packet tracer framework. HW ASICs (FIA, XBAR, PHY) do not have the capability to participate in the packet tracer framework. Therefore any actions performed by microcode are reported to the packet tracer infrastructure, but actions peformed by HW ASICs are not.
User Interaction
The main pillar of the XR Embedded Packet Tracer architecture is simplicity of user experience.
At this stage of XR Embedded Packet Tracer framework development, user interface is provided through a CLI.
User interaction with the packet tracer framework is entirely contained in the user mode. There is no need for any configuration changes to enable the packet tracer functionality.
The following diagram represents the packet tracer workflow:
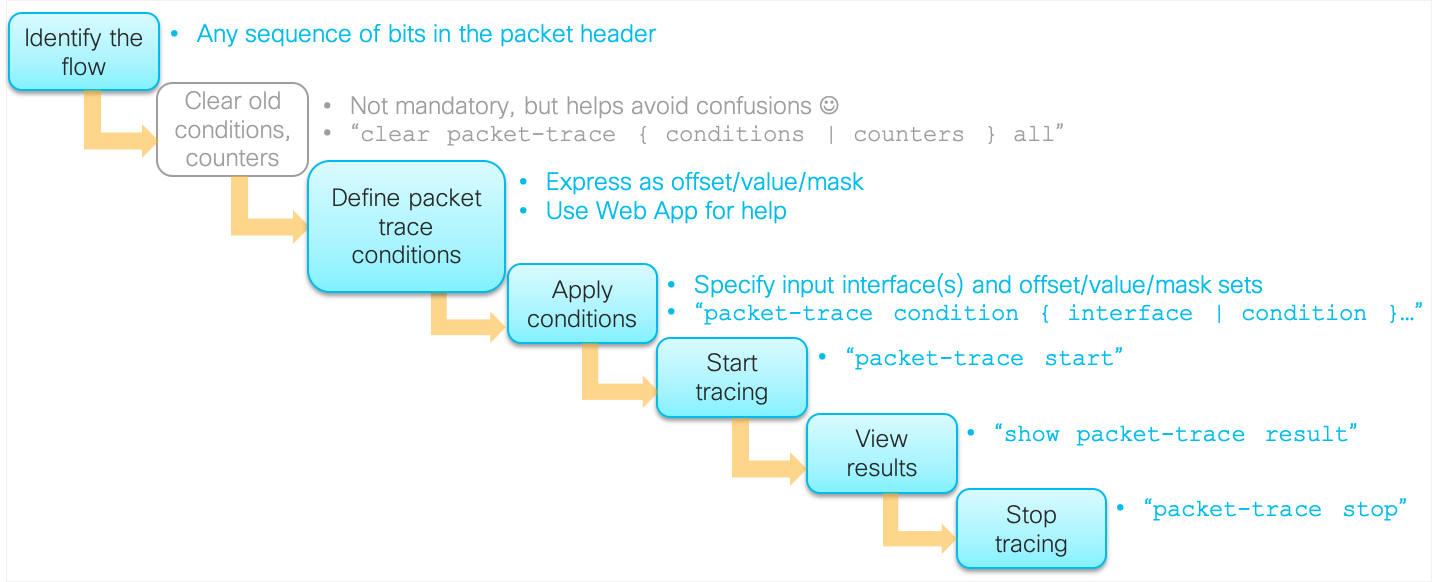
CLI Commands Summary
| Command Syntax | Description |
|---|---|
| clear packet-trace conditions all | Clears all buffered packet-trace conditions. Command is allowed only while packet tracing is inactive. |
| clear packet-trace counters all | Resets all packet-trace counters to zero. |
| packet-trace condition interface interface | Specify interfaces on which you expect to receive packets that you want to trace through the router. |
| packet-trace condition n offset offset value value mask mask | Specify set(s) of the Offset/Value/Mask that define the flow of interest. |
| packet-trace start | Start packet tracing. |
| packet-trace stop | Stop packet tracing. |
| show packet-trace description | See all counters registered with the packet tracer framework along with their descriptions. |
| show packet-trace status [detail] | See conditions buffered by the pkt_trace_master process running on the active RP and the packet tracer status (Active/Inactive). The detailed option of the command shows which processes are registered with the packet tracer framework on every card in the router. If packet tracer status is Active, output also shows which conditions were successfully programmed in data-path. |
| show packet-trace result | See the non-zero packet tracer counters. |
| show packet-trace result counter name [source source] [location location] | See the most recent 1023 increments of a specific packet-trace counter. |
Start/Stop Packet Tracing
Commands to start/stop packet tracer:
packet-trace start
packet-trace stop
Clear Packet Tracer Counters And Conditions
Command to clear packet tracer counters:
clear packet-trace counters all
Packet tracer counters can be cleared at any time.
Command to clear packet tracer counters:
clear packet-trace conditions all
By design, packet tracer conditions can be cleared only while packet tracing is inactive. Interpertation of packet tracer results would othewrise we be dubious.
Specify Packet Tracer Conditions
Packet tracer conditions comprise two entities:
- Physical interface(s) on which packets are expected to be received
- Offset/Value/Mask triplets that define a flow of interest
Packet Tracer Conditions - Interfaces
Specify the physical interface(s) on which packets are expected to be received.
packet-trace condition interface hu0/5/0/6
packet-trace condition interface hu0/5/0/7
packet-trace condition interface hu0/5/0/8
When tracing on sub-interfaces, the Offset/Value/Mask specification must take into account the dot1q or QinQ encapsulation.
Packet Tracer Conditions - Offset/Value/Mask
Defining a flow as a set of Offset/Value/Mask triplets allows the packet tracer framework to be completely protocol agnostic. The Offset/Value/Mask can represent any part of any header in the protocol stack and does not even have to end on the header boundary.
To address the usability aspect of this approach, we have developed the “XR Packet Tracer Condition Generator Web App”.
Source code and installation instructions of this Web App are available on GitHub: XR Embedded Packet Tracer - Condition Generator.
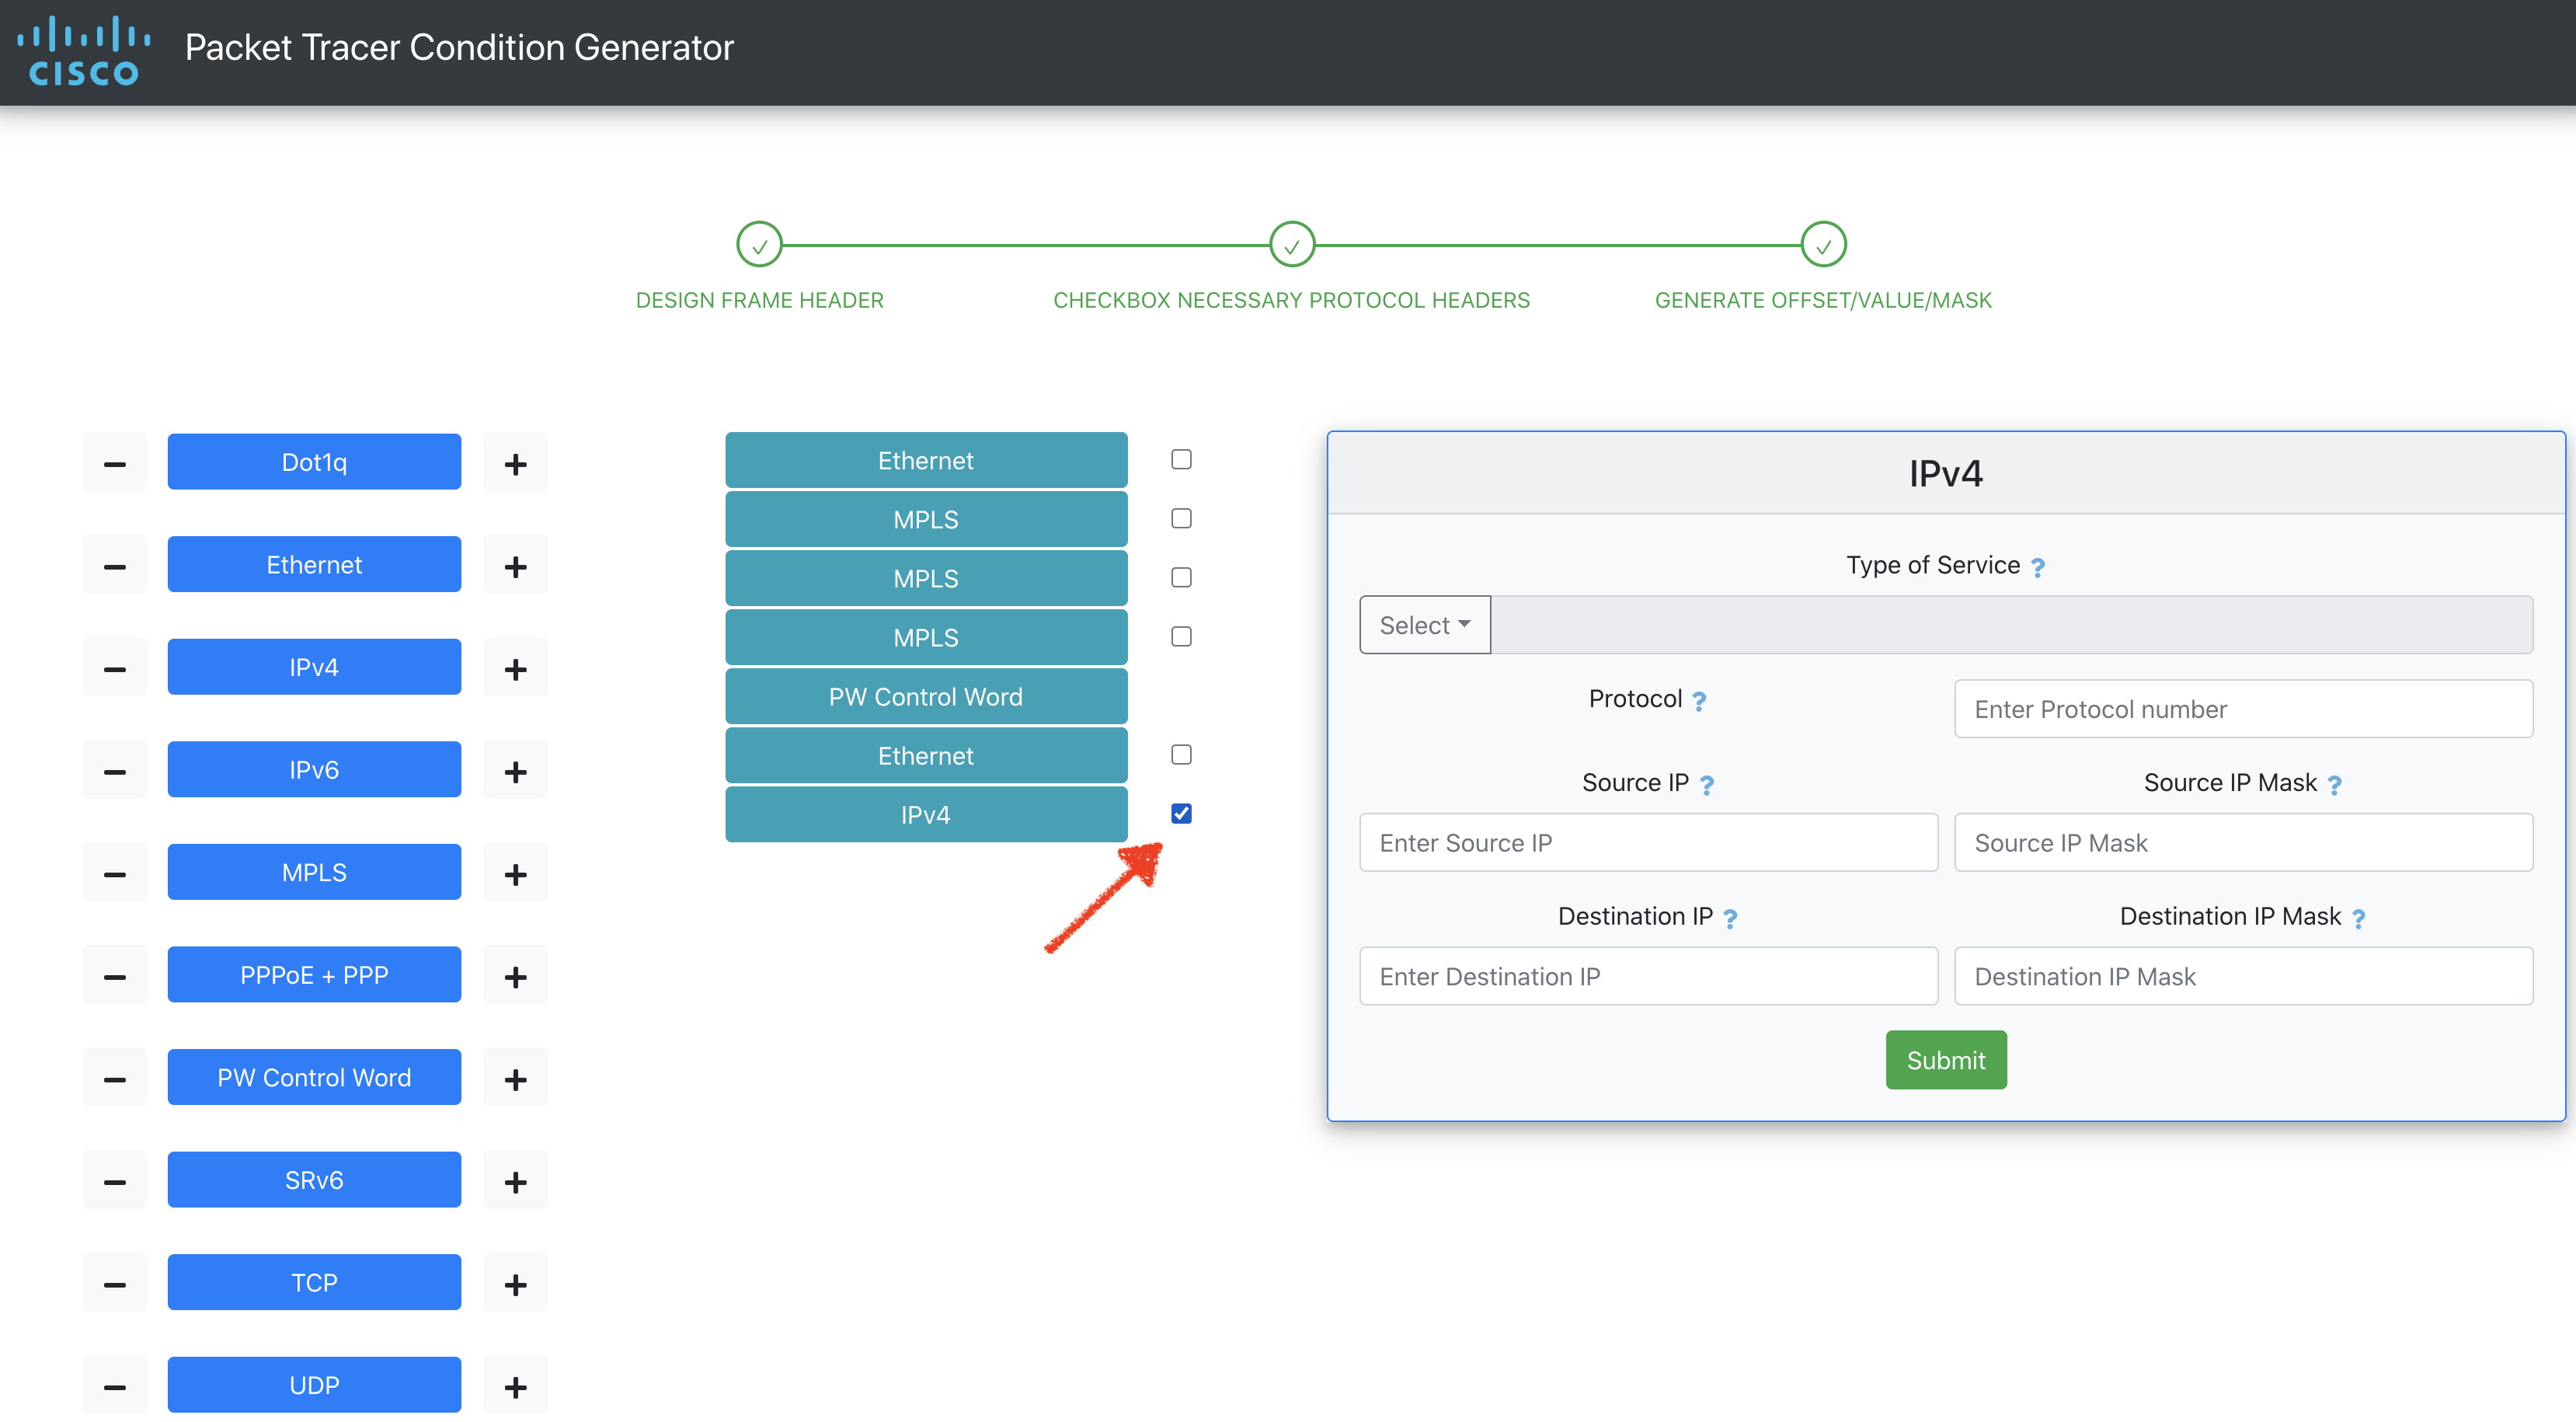
This Web App allows you to draw the protocol stack in your frame of interest, specify which of them are of interest for defining the condition and finally enter the values (with optional masks) that define your flow of interest.
Starting page of the Web App shows the supported protocol headers.
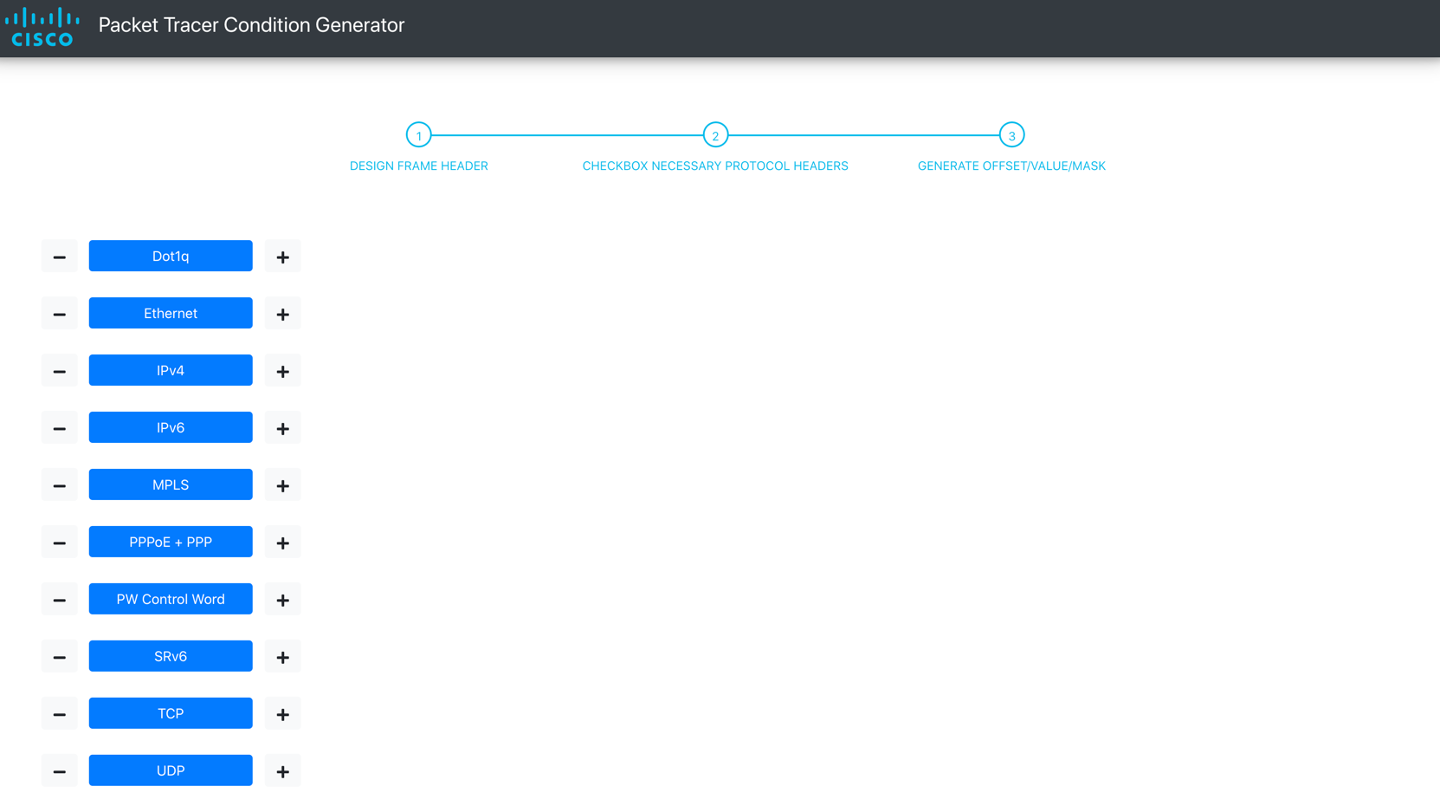
Click on the + sign to add a header to the stack in the desired order. Clicking on the - sign removes from the stack the last header of that type. If you want to reset the stack completely, just reload the page.
Make sure you add all the headers before the one on which you want to match the traffic because the offset calculation depends on it. Don’t forget the PW control word if it’s in use. ;)
The outermost header should be the first one you select. Then click on the other headers to draw the protocol stack until the innermost header that you want to match on. For example:
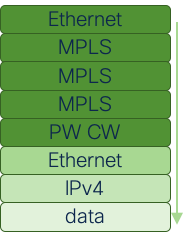
In the Web App, it would look like this:
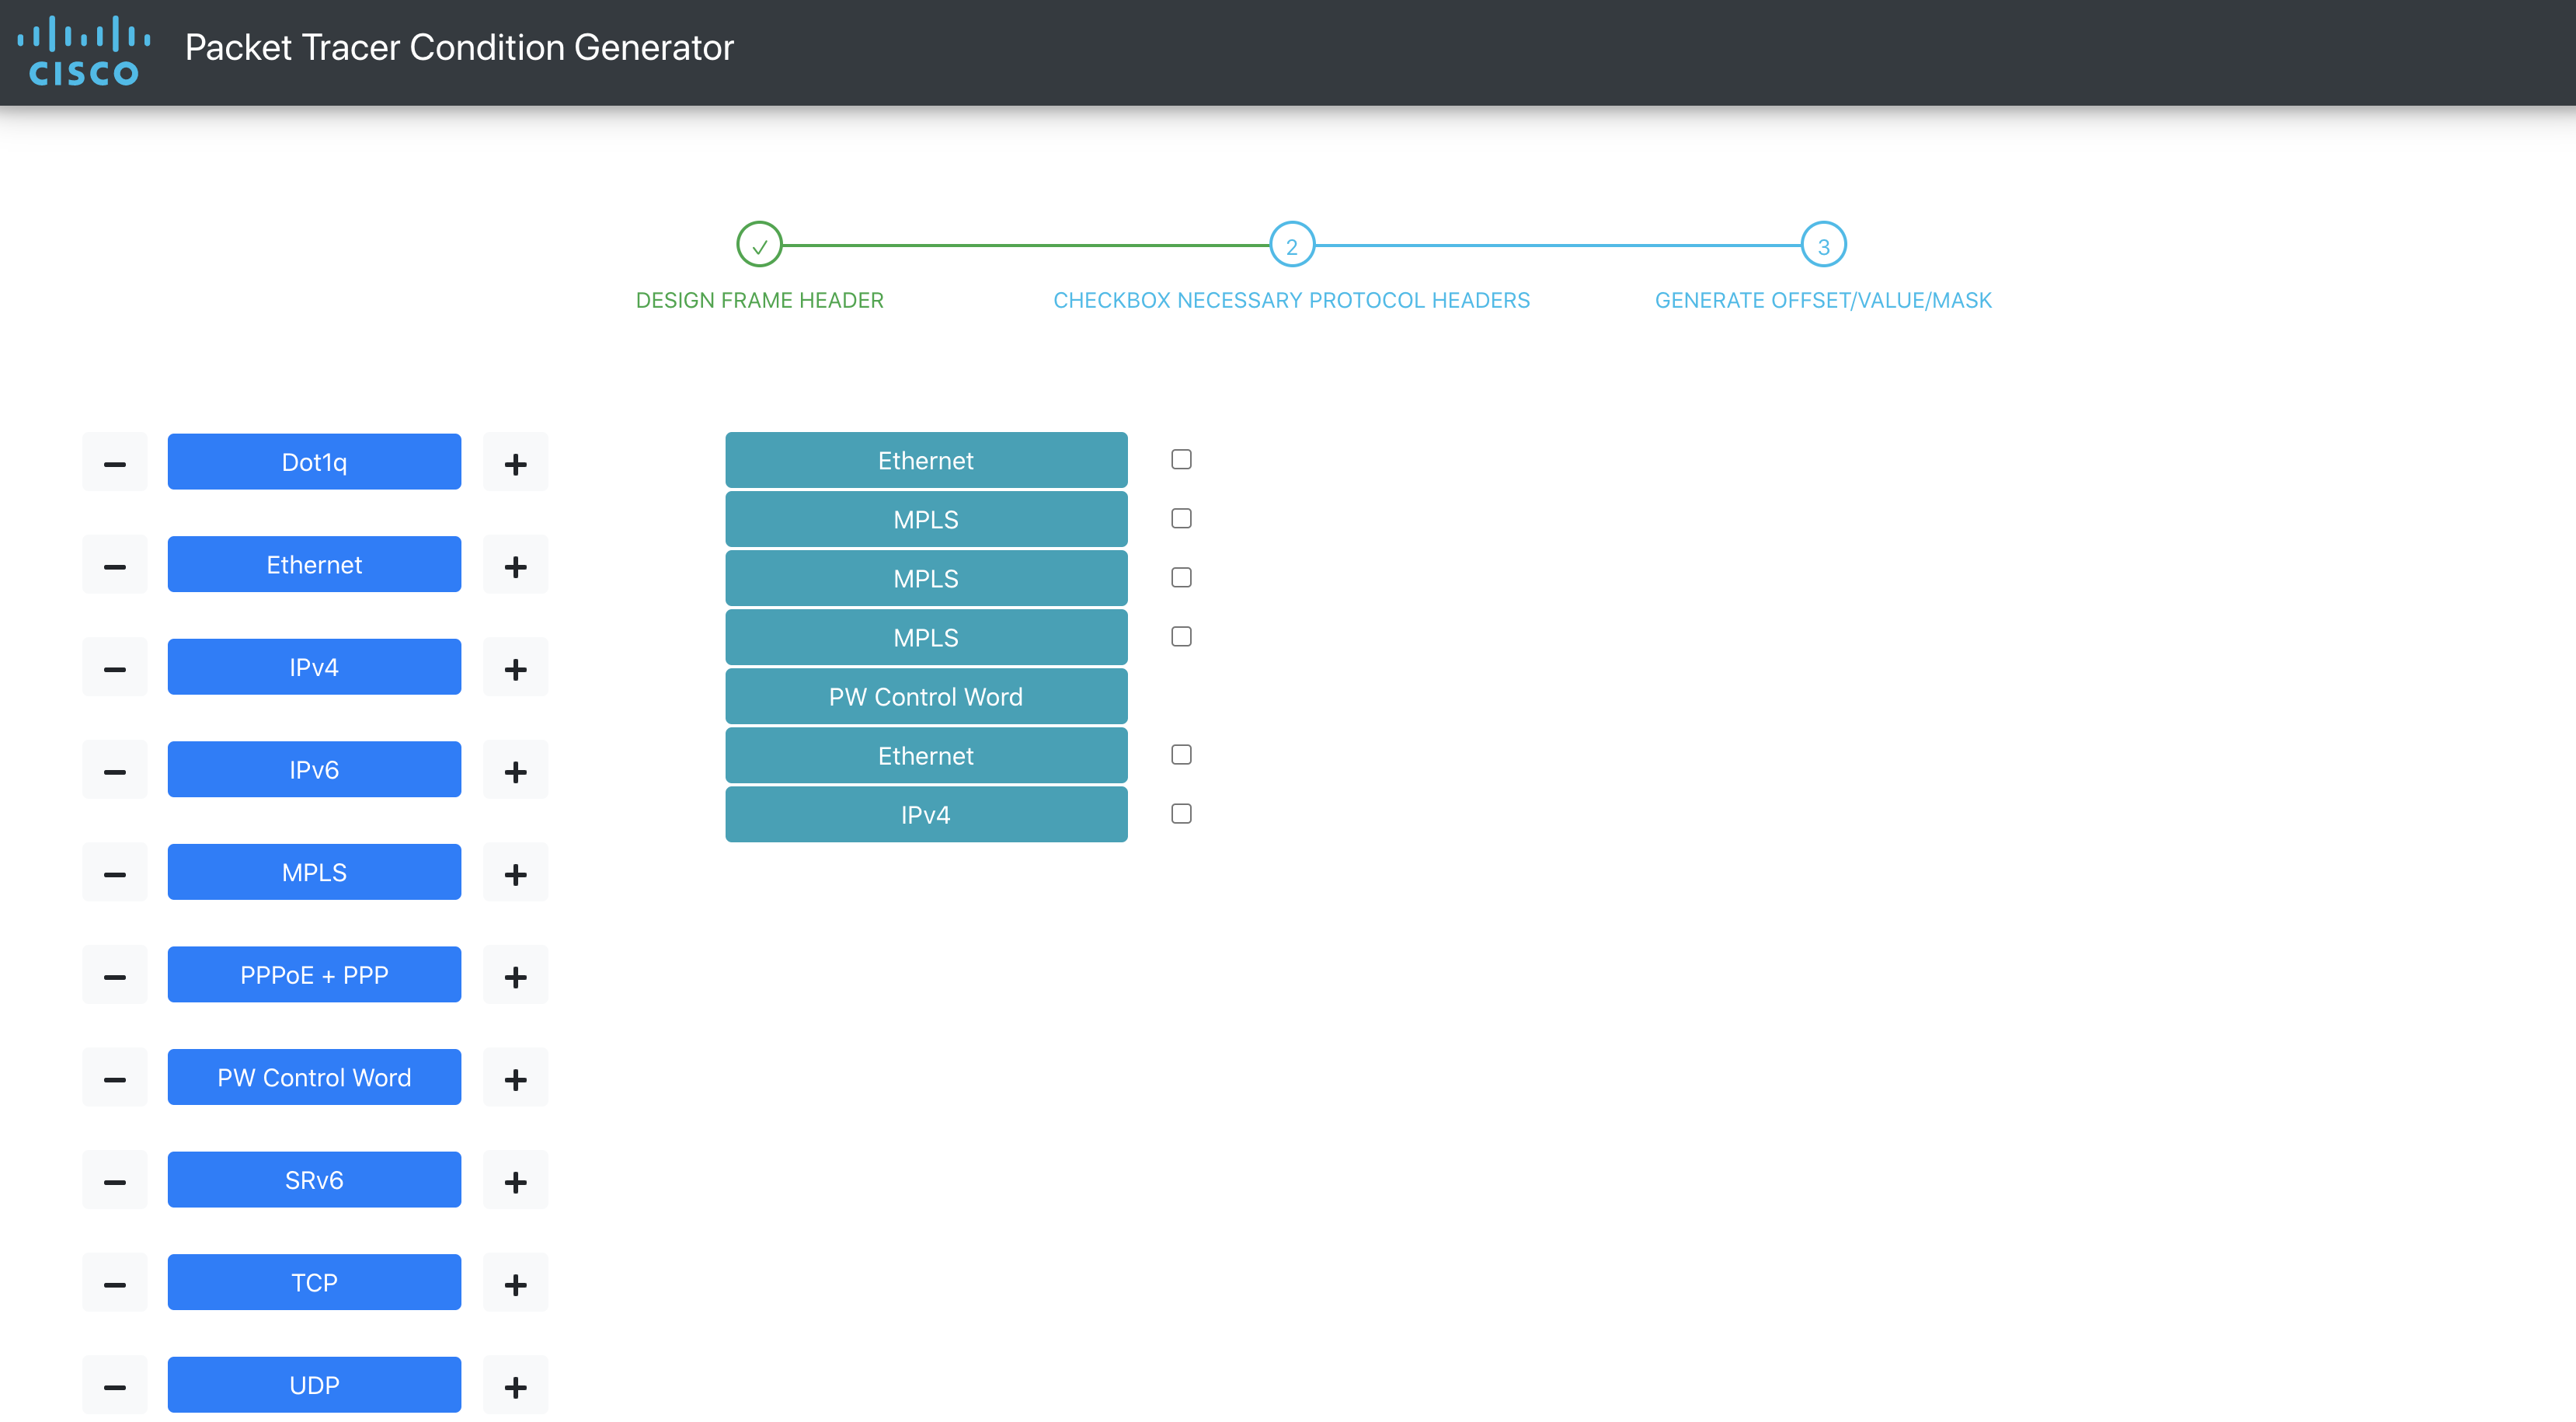
Click on the checkbox next to the headers on which you want to match. You can click on more than one. A frame for each selected header will apper to the right. Enter the value/mask of your choice and click on Submit button in the frame.
Click on the Copy icon to copy the Offset/Value/Mask to clipboard.
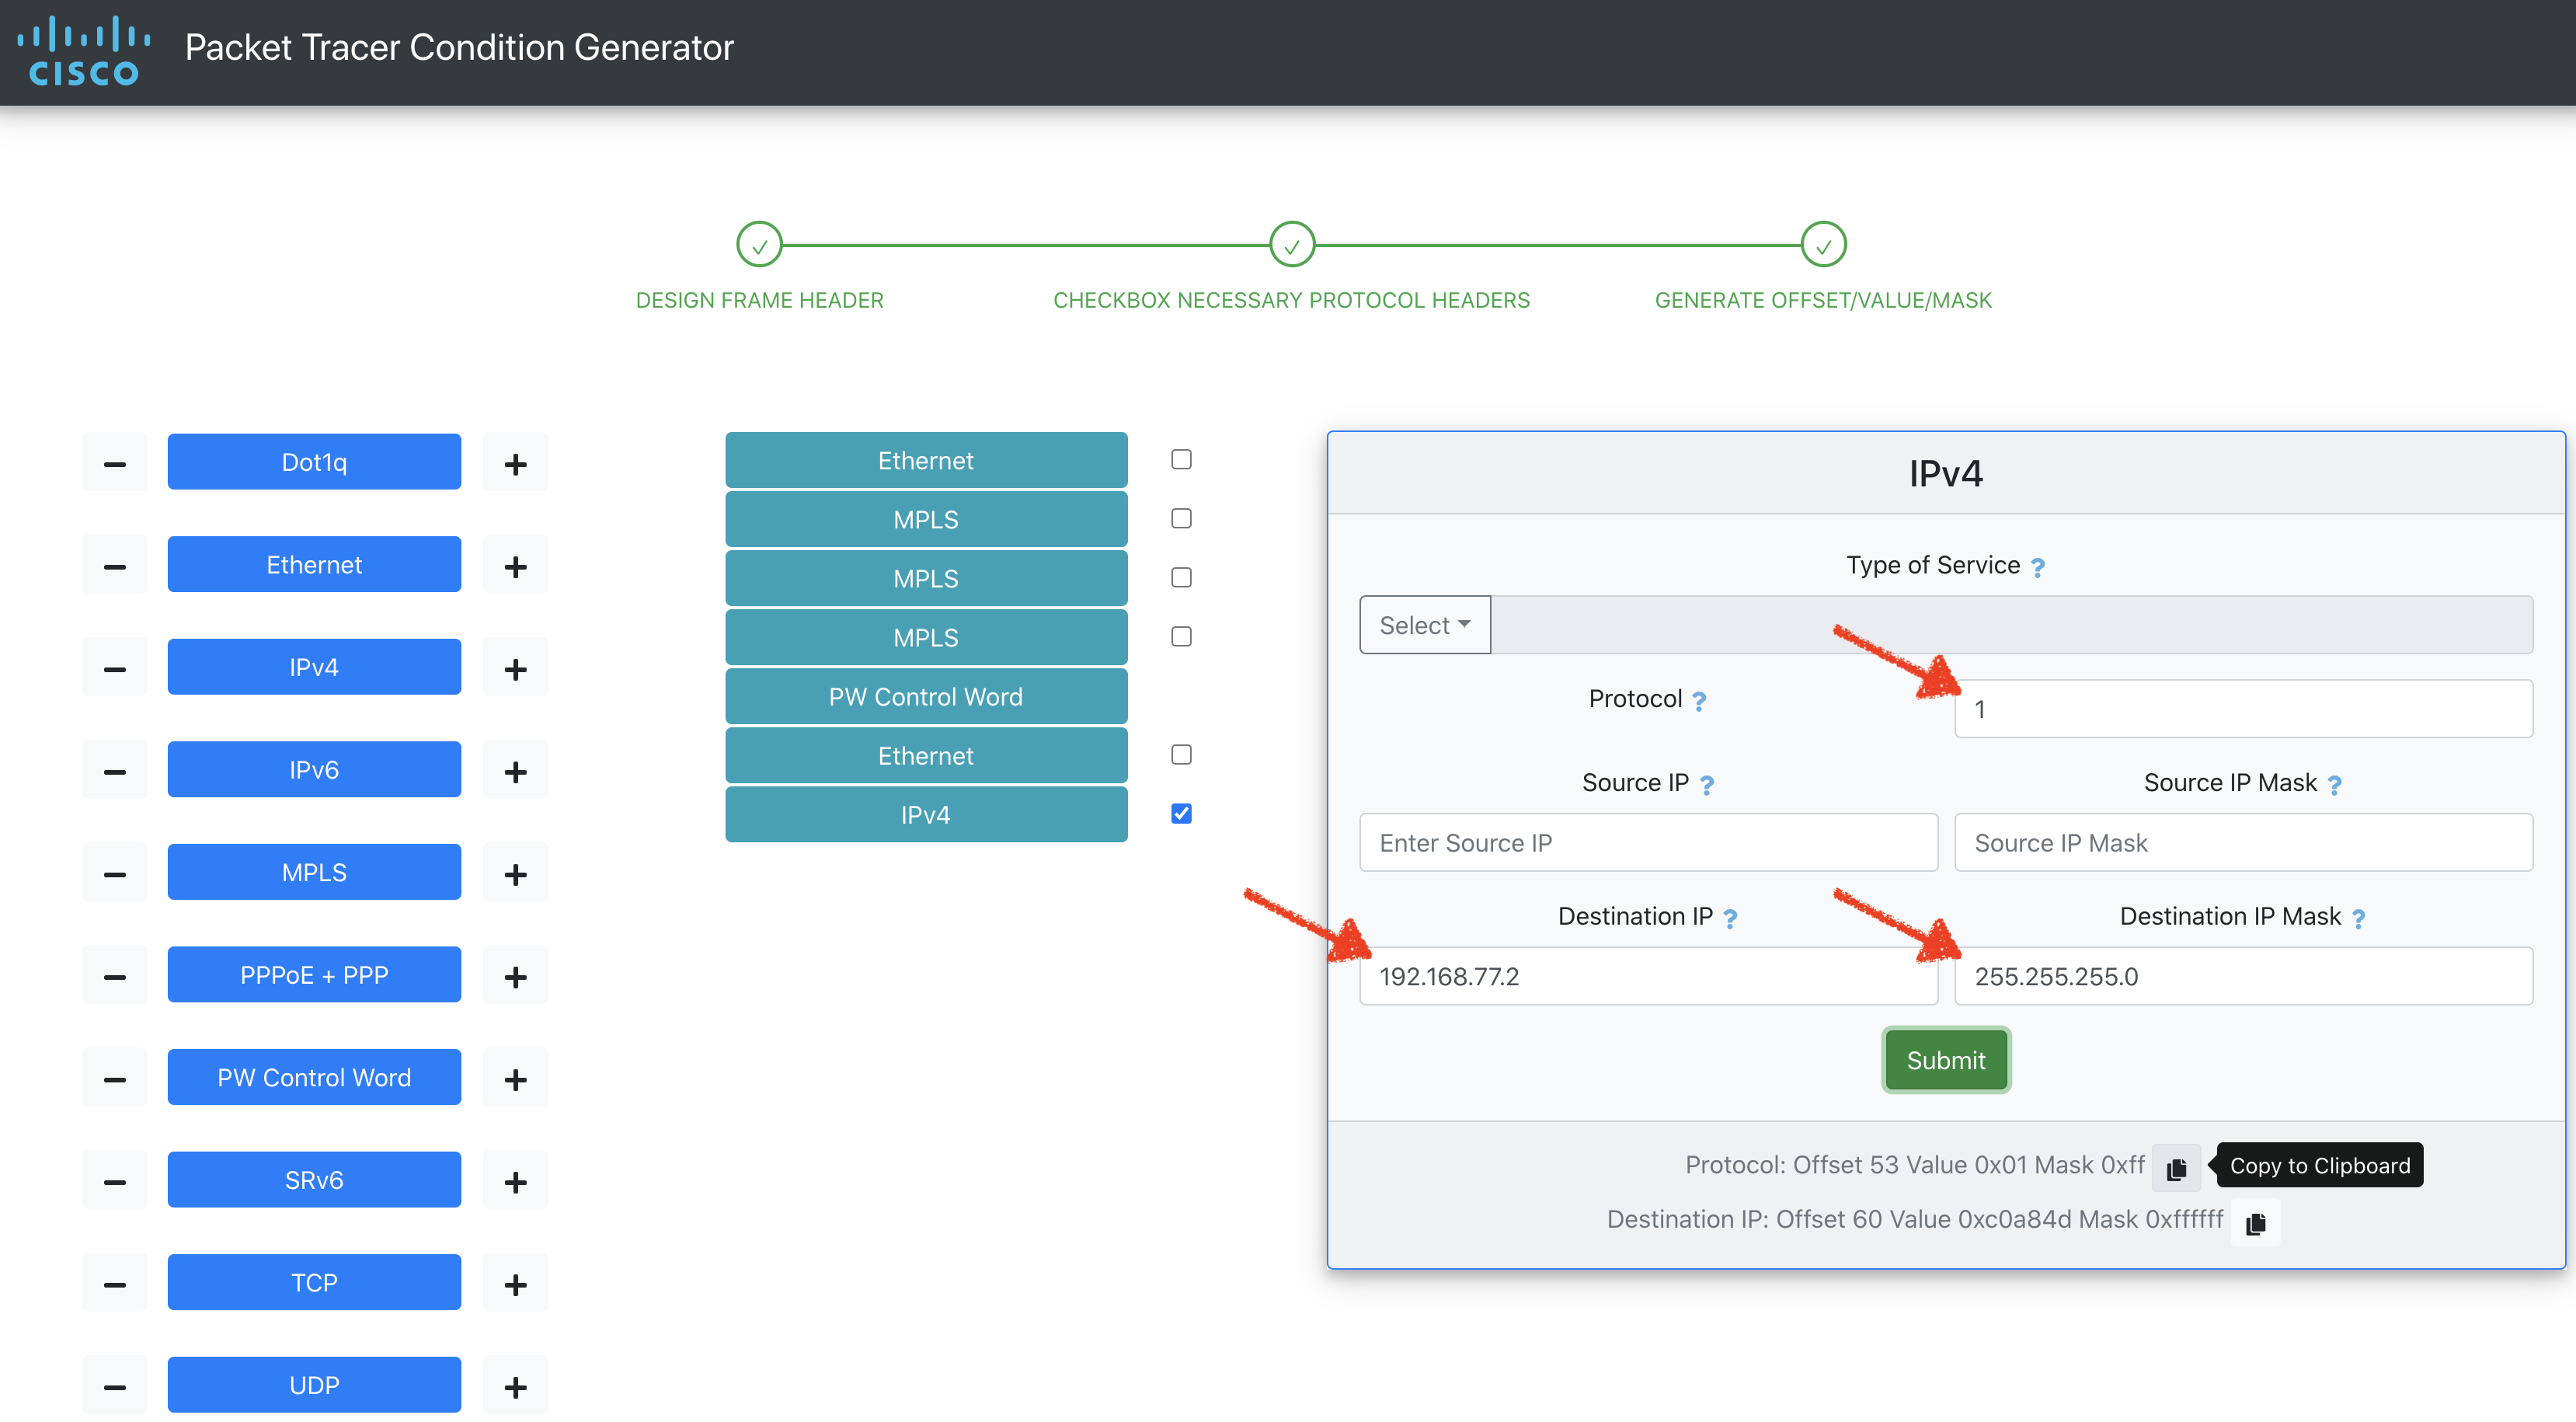
When the Offset/Value/Mask is copied to clipboard, use it to specify the conditions:
packet-trace condition 1 Offset 53 Value 0x01 Mask 0xff
packet-trace condition 3 Offset 60 Value 0xc0a84d02 Mask 0xffffff00
On ASR 9000, you can specify a maximum of three 4-octet Offset/Value/Mask sets.
Packet Tracer Status
Use the following command to see the packet tracer status:
show packet-trace status [detail]
Use the show packet-trace status command to check which conditions were buffered so far by the pkt_trace_master process running on the active RP and what is the aggregate packet tracer status (active/inactive).
RP/0/RSP0/CPU0:CORE-TOP#sh packet-trace status
------------------------------------------------------------

Packet Trace Master Process:

  Buffered Conditions:
    Interface HundredGigE0/5/0/6
    1 offset 53 value 0x1 mask 0xff
    2 offset 56 value 0xc0a84d01 mask 0xffffffff
    3 offset 60 value 0xc0a84d02 mask 0xffffffff

  Status: Active

RP/0/RSP0/CPU0:CORE-TOP#
The detailed option of the status command “show packet-trace status detail” can be used to see which processes are registered with the packet tracer framework on every card in the router. If packet tracer status is Active, you can also verify which conditions were programmed in data-path. Packet tracer conditions are broadcast to all participatig processes when the packet-trace start command is issued, but only the NPs that own the interfaces specified in the packet tracer condition are programming it in HW.
RP/0/RSP0/CPU0:CORE-TOP#sh packet-trace status detail
------------------------------------------------------------
Location: 0/5/CPU0

Available Counting Modules: 6

  #1 spp_pd
    Last errors:

  #2 netio_pd
    Last errors:

  #3 prm_server_to
   Last errors:

  #4 spio_pd_LACP
    Last errors:

  #5 spio_pd_ARP
    Last errors:

  #6 spio_pd_LLDP
    Last errors:


Available Marking Modules: 1

  #1 prm_server_to

    Interfaces: 1
      HundredGigE0/5/0/6

    Conditions: 3
      1 offset 53 value 0x1  mask 0xff
      2 offset 56 value 0xc0a84d01  mask 0xffffffff
      3 offset 60 value 0xc0a84d02  mask 0xffffffff

    Last errors:

------------------------------------------------------------

Packet Trace Master Process:

  Buffered Conditions:
    Interface HundredGigE0/5/0/6
    1 offset 53 value 0x1 mask 0xff
    2 offset 56 value 0xc0a84d01 mask 0xffffffff
    3 offset 60 value 0xc0a84d02 mask 0xffffffff

  Status: Active

------------------------------------------------------------
Location: 0/RSP0/CPU0

Available Counting Modules: 2

  #1 spp_pd
    Last errors:

  #2 netio_pd
    Last errors:


Available Marking Modules: 0

RP/0/RSP0/CPU0:CORE-TOP#
Packet Tracer Results
Use the following command to see the packet tracer results:
show packet-trace result [counter <name> [source <source>] [location <location>]]
The simple form of this command shows the aggregate status of all non-zero counters. In particular, you can see the following:
- Location of the counter.
- Counter source. In case of packet tracing on ASR9k data-path, source represents the NP.
- Counter name.
- Counter type: drop or pass
- Last Attribute. With every counter update the owner of the counter may decide to provide an additional explanation along with the counter update. In case of drop counters, you should expect to see the drop reason.
- Counter value
Sample output:
RP/0/RSP0/CPU0:CORE-TOP#sh packet-trace results
T: D - Drop counter; P - Pass counter
Location     | Source       | Counter                   | T | Last-Attribute                           | Count
------------   ------------   -------------------------   -   ----------------------------------------   ---------------
0/5/CPU0       NP3            PACKET_MARKED               P   HundredGigE0_5_0_6                         1000
0/5/CPU0       NP3            PACKET_TO_FABRIC            P                                              1000
0/5/CPU0       NP0            PACKET_FROM_FABRIC          P                                              1000
0/5/CPU0       NP0            PACKET_TO_INTERFACE         P   HundredGigE0_5_0_1                         1000
RP/0/RSP0/CPU0:CORE-TOP#
When using the “show packet-trace results counter <_name_>" option, you can see:
- the most recent 1023 increments of the given counter. Note that the packet tracer framework may receive a counter increment that is higher than one, depending on how the process that collects data-path counter from NP updates the packet tracer framework.
- the timestamp of the cunter increment
- any additional attribute communicated with that counter update.
The asterisk next to the counter name shows the most recent update. This is important if the counter was updated more than 1023 times, in which case the oldest entries are overwritten.
Sample output:
RP/0/RSP0/CPU0:CORE-TOP#sh packet-trace results counter PACKET_MARKED source NP3 location 0/5/CPU0
Tue Aug 25 16:21:00.616 UTC
T: D - Drop Counter; P - Pass Counter; M - Marking Master Counter; * - Last Updated Index of Counter

------------------------------------------
Location: 0/5/CPU0
------------------------------------------

Timestamp              | Source       | Counter                   | T | Attribute                                | Count
----------------------   ------------   -------------------------   -   ----------------------------------------   ---------------
Aug 25 09:37:22.230      NP3            PACKET_MARKED               M   HundredGigE0_5_0_6                         2
Aug 25 09:37:25.230      NP3            PACKET_MARKED               M   HundredGigE0_5_0_6                         3
Aug 25 09:37:28.230      NP3            PACKET_MARKED               M   HundredGigE0_5_0_6                         4
<i<..snip..>
Aug 25 16:20:52.230      NP3            PACKET_MARKED               M   HundredGigE0_5_0_6                         5
Aug 25 16:20:55.230      NP3            PACKET_MARKED               M   HundredGigE0_5_0_6                         7
Aug 25 16:20:58.229      NP3           *PACKET_MARKED               M   HundredGigE0_5_0_6                         6
RP/0/RSP0/CPU0:CORE-TOP#
Packet Tracer Counter Descriptions
Use the following command to see which counters are registered with the packet tracer framework and their descriptions:
show packet-trace descriptions
XR Embedded Packet Tracer Performance Considerations
Performance impact of packet tracing is observed only on the network processor (NP) that owns interfaces specified in the packet tracer condition. Headers of all packets received on those interfaces (and only on those interfaces) must be compared to the specified condition. All other elements in the data-path and punt/inject path that participate in the packet tracer framework only need to check the value of a single bit in the internal packet header. Hence you will not observe any performance impact on other elements in the packet processing path.
Performance impact on Lightspeed and Lightspeed Plus is negligeable even on the NP where the incoming packets are checked against the specified condition. For example, NP load remains 28% in test setup with and without packet tracing.
Performance impact on Tomahawk line cards needs to be considered before enabling packet tracing condition on interfaces owned by Tomahawk NP. If the NP utilisation is ~20%, enabling packet tracer may increase the NP utilisation to ~60%. Note that performance impact is not observed if Tomahawk NP is the egress NP.
Use Cases
The followig three use cases illustrate what can you expect to achieve with packet tracer on ASR 9000.
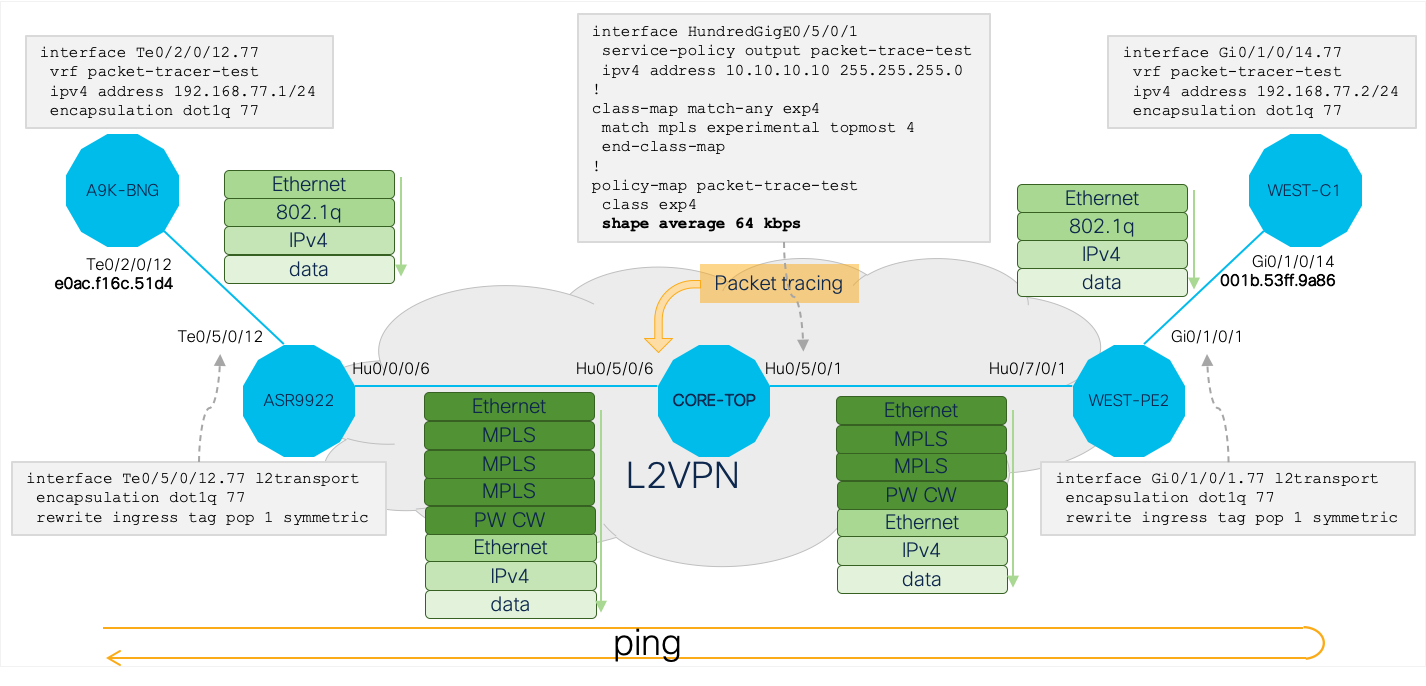
Use Case 1: Tracing On A P Router In L2VPN
I’m sure you will agree that this is one of the most difficult issues to troubleshoot: packet pertaining to a L2VPN PW are dropped somewhere in the core. XR Embedded Packet Tracer is the only feature that allows you to troubleshoot this easily.
The following image shows the topology, relevant configurations, protocol stacks, test flow (ICMP echo) direction and the point where packet tracing is applied:
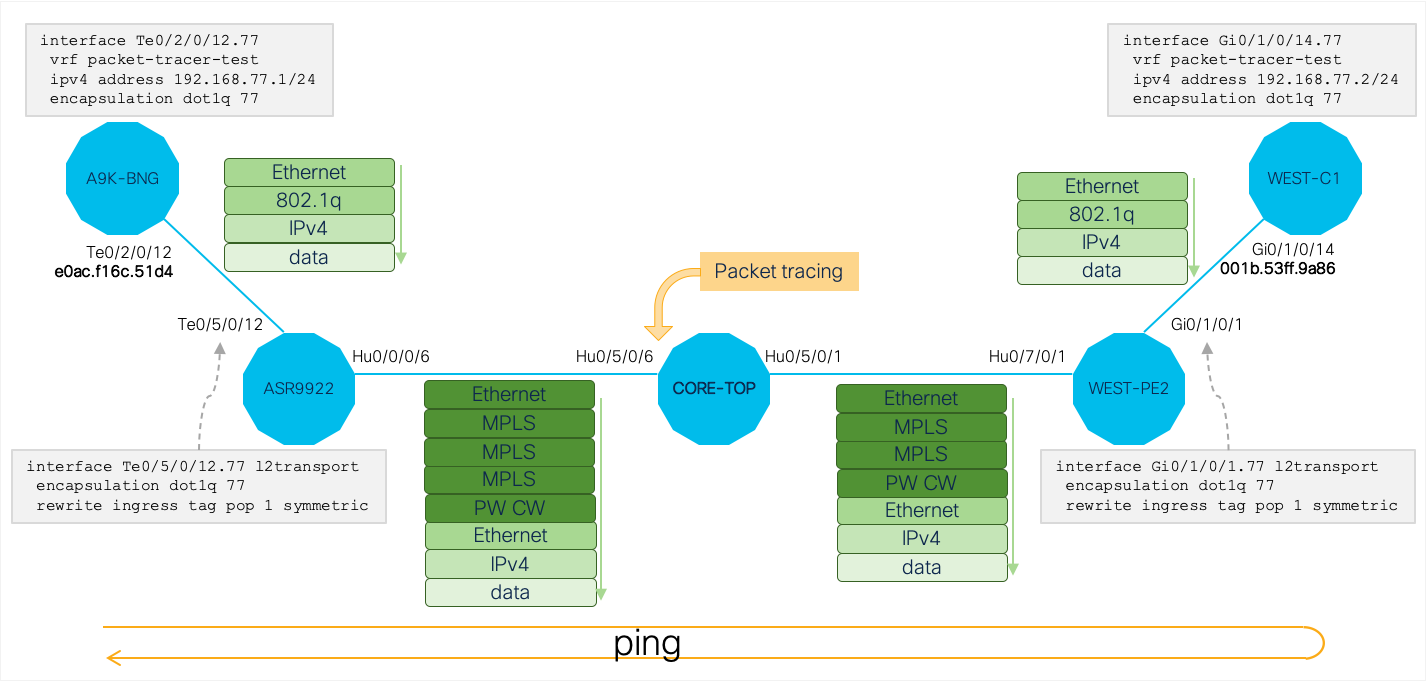
Protocol stack on any flow will depend very much on the network configuration. You can either derive it by walking the control path from encapsulation PE to the P node where packet tracer is enabled to see what kind of header rewrites are performed on each node (e.g.: is dot1q header stripped on encapsulation PE, how many labels are pushed, is PW control word enabled, etc.) or you can run a monitor session once on the P router to confirm the protocol stack on the flow of interest.
Packet tracer condition in this use case was developed using the XR Embedded Packet Tracer - Condition Generator Web App.
The Offset/Value/Mask triplets in below snapshot represent the following fields of the IPv4 packet encapsulated into L2VPN frame:
- ICMP protocol
- source IPv4 address
- destination IPv4 address
The simple set of commands below was sufficient to confirm that all packets of this flow are successfuly sent towards the egress interface:
RP/0/RSP0/CPU0:CORE-TOP#packet-trace stop
RP/0/RSP0/CPU0:CORE-TOP#clear packet-trace conditions all
RP/0/RSP0/CPU0:CORE-TOP#clear packet-trace counters all
RP/0/RSP0/CPU0:CORE-TOP#packet-trace condition interface hu0/5/0/6
RP/0/RSP0/CPU0:CORE-TOP#packet-trace condition 1 Offset 53 Value 0x01 Mask 0xff
RP/0/RSP0/CPU0:CORE-TOP#packet-trace condition 2 Offset 56 Value 0xc0a84d01 Mask 0xffffffff
RP/0/RSP0/CPU0:CORE-TOP#packet-trace condition 3 Offset 60 Value 0xc0a84d02 Mask 0xffffffff
RP/0/RSP0/CPU0:CORE-TOP#show packet-trace status
------------------------------------------------------------

Packet Trace Master Process:

  Buffered Conditions:
    Interface HundredGigE0/5/0/6
    1 offset 53 value 0x1 mask 0xff
    2 offset 56 value 0xc0a84d01 mask 0xffffffff
    3 offset 60 value 0xc0a84d02 mask 0xffffffff

  Status: Inactive

RP/0/RSP0/CPU0:CORE-TOP#packet-trace start
RP/0/RSP0/CPU0:CORE-TOP#show packet-trace status
------------------------------------------------------------

Packet Trace Master Process:

  Buffered Conditions:
    Interface HundredGigE0/5/0/6
    1 offset 53 value 0x1 mask 0xff
    2 offset 56 value 0xc0a84d01 mask 0xffffffff
    3 offset 60 value 0xc0a84d02 mask 0xffffffff

  Status: Active

RP/0/RSP0/CPU0:CORE-TOP#sh packet-trace results
T: D - Drop counter; P - Pass counter
Location     | Source       | Counter                   | T | Last-Attribute                           | Count
------------   ------------   -------------------------   -   ----------------------------------------   ---------------
0/5/CPU0       NP3            PACKET_MARKED               P   HundredGigE0_5_0_6                         1000
0/5/CPU0       NP3            PACKET_TO_FABRIC            P                                              1000
0/5/CPU0       NP0            PACKET_FROM_FABRIC          P                                              1000
0/5/CPU0       NP0            PACKET_TO_INTERFACE         P   HundredGigE0_5_0_1                         1000
RP/0/RSP0/CPU0:CORE-TOP#
Use Case 2: Packet Drops In NP Microcode
Packet tracer framework can explicity report packet drops if the packet drop was a decision made by any entity that participates in the packet tracer framework. This means that packets dropped by the NP microcode are explicitly reported.
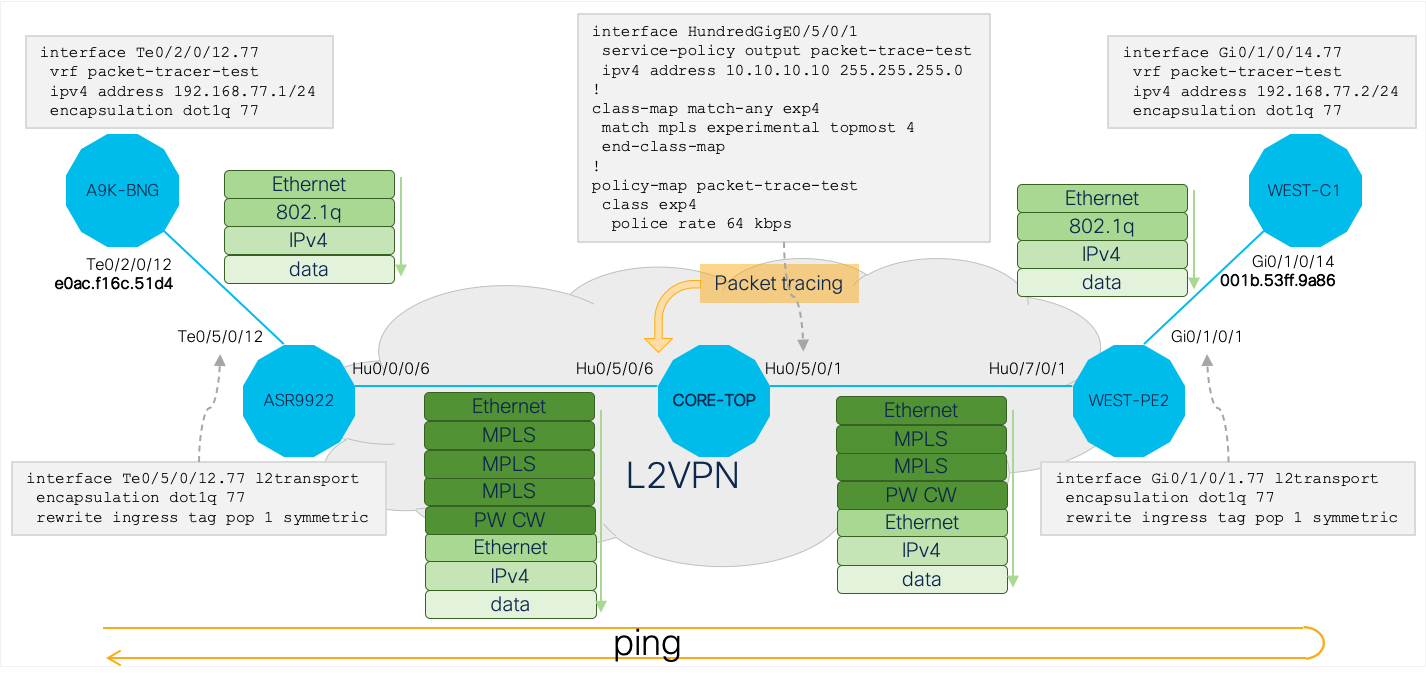
In this use case an egress policer was applied to the Hu0/5/0/1 interface of the P router:
Note that, as the policer drop is a decision made by the NP microcode, you can see the PACKET_EGR_DROP counter increment in the output of show packet-trace result counter.
You can also see that the additional information passed with the PACKET_EGR_DROP counter increment explains the drop reason. In this use case drop reason was RSV_DROP_QOS_DENY, which is a policer drop in NP microcode parlance.
You can also see that the number of drops matches exactly the drops in the output of show policy-map interface hu0/5/0/1 output command.
Further you can observe using the “show packet-trace results counter <_name_>" the drop reason in all increments of `PACKET_EGR_DROP` counter.
RP/0/RSP0/CPU0:CORE-TOP#sh packet-trace results
T: D - Drop counter; P - Pass counter
Location     | Source       | Counter                   | T | Last-Attribute                           | Count
------------   ------------   -------------------------   -   ----------------------------------------   ---------------
0/5/CPU0       NP3            PACKET_MARKED               P   HundredGigE0_5_0_6                         1000
0/5/CPU0       NP3            PACKET_TO_FABRIC            P                                              1000
0/5/CPU0       NP0            PACKET_FROM_FABRIC          P                                              1000
0/5/CPU0       NP0            PACKET_EGR_DROP             D   RSV_DROP_QOS_DENY                          77
0/5/CPU0       NP0            PACKET_TO_INTERFACE         P   HundredGigE0_5_0_1                         923
RP/0/RSP0/CPU0:CORE-TOP#sh policy-map interface hu0/5/0/1 output

HundredGigE0/5/0/1 output: packet-trace-test

Class exp4
  Classification statistics          (packets/bytes)     (rate - kbps)
    Matched             :                1000/144000               8
    Transmitted         : N/A
    Total Dropped       :                  77/11088                1
  Policing statistics                (packets/bytes)     (rate - kbps)
    Policed(conform)    :                 923/132912               7
    Policed(exceed)     :                  77/11088                1
    Policed(violate)    :                   0/0                    0
    Policed and dropped :                  77/11088
Class class-default
  Classification statistics          (packets/bytes)     (rate - kbps)
    Matched             :                  25/2052                 0
    Transmitted         : N/A
    Total Dropped       : N/A
RP/0/RSP0/CPU0:CORE-TOP#
RP/0/RSP0/CPU0:CORE-TOP#sh packet-trace results counter PACKET_EGR_DROP location 0/5/CPU0
T: D - Drop Counter; P - Pass Counter; M - Marking Master Counter; * - Last Updated Index of Counter

------------------------------------------
Location: 0/5/CPU0
------------------------------------------

Timestamp              | Source       | Counter                   | T | Attribute                                | Count
----------------------   ------------   -------------------------   -   ----------------------------------------   ---------------
Aug 30 16:49:10.070      NP0            PACKET_EGR_DROP             D   RSV_DROP_QOS_DENY                          1
Aug 30 16:49:13.069      NP0            PACKET_EGR_DROP             D   RSV_DROP_QOS_DENY                          2
Aug 30 16:49:16.068      NP0            PACKET_EGR_DROP             D   RSV_DROP_QOS_DENY                          3
Aug 30 16:49:19.067      NP0            PACKET_EGR_DROP             D   RSV_DROP_QOS_DENY                          2
Aug 30 16:49:22.067      NP0            PACKET_EGR_DROP             D   RSV_DROP_QOS_DENY                          2
Aug 30 16:49:25.067      NP0            PACKET_EGR_DROP             D   RSV_DROP_QOS_DENY                          2
Aug 30 16:49:28.068      NP0            PACKET_EGR_DROP             D   RSV_DROP_QOS_DENY                          4
Aug 30 16:49:31.067      NP0            PACKET_EGR_DROP             D   RSV_DROP_QOS_DENY                          2
Aug 30 16:49:34.067      NP0            PACKET_EGR_DROP             D   RSV_DROP_QOS_DENY                          2
Aug 30 16:49:37.067      NP0            PACKET_EGR_DROP             D   RSV_DROP_QOS_DENY                          3
Aug 30 16:49:40.067      NP0            PACKET_EGR_DROP             D   RSV_DROP_QOS_DENY                          2
Aug 30 16:49:43.067      NP0            PACKET_EGR_DROP             D   RSV_DROP_QOS_DENY                          2
Aug 30 16:49:46.067      NP0            PACKET_EGR_DROP             D   RSV_DROP_QOS_DENY                          2
Aug 30 16:49:49.067      NP0            PACKET_EGR_DROP             D   RSV_DROP_QOS_DENY                          4
Aug 30 16:49:52.067      NP0            PACKET_EGR_DROP             D   RSV_DROP_QOS_DENY                          2
Aug 30 16:49:55.067      NP0            PACKET_EGR_DROP             D   RSV_DROP_QOS_DENY                          2
Aug 30 16:49:58.067      NP0            PACKET_EGR_DROP             D   RSV_DROP_QOS_DENY                          3
Aug 30 16:50:01.067      NP0            PACKET_EGR_DROP             D   RSV_DROP_QOS_DENY                          2
Aug 30 16:50:04.067      NP0            PACKET_EGR_DROP             D   RSV_DROP_QOS_DENY                          3
Aug 30 16:50:07.067      NP0            PACKET_EGR_DROP             D   RSV_DROP_QOS_DENY                          1
Aug 30 16:50:10.067      NP0            PACKET_EGR_DROP             D   RSV_DROP_QOS_DENY                          3
Aug 30 16:50:13.067      NP0            PACKET_EGR_DROP             D   RSV_DROP_QOS_DENY                          1
Aug 30 16:50:16.067      NP0            PACKET_EGR_DROP             D   RSV_DROP_QOS_DENY                          3
Aug 30 16:50:19.067      NP0            PACKET_EGR_DROP             D   RSV_DROP_QOS_DENY                          3
Aug 30 16:50:22.067      NP0            PACKET_EGR_DROP             D   RSV_DROP_QOS_DENY                          3
Aug 30 16:50:25.067      NP0            PACKET_EGR_DROP             D   RSV_DROP_QOS_DENY                          2
Aug 30 16:50:28.067      NP0            PACKET_EGR_DROP             D   RSV_DROP_QOS_DENY                          1
Aug 30 16:50:31.067      NP0            PACKET_EGR_DROP             D   RSV_DROP_QOS_DENY                          4
Aug 30 16:50:34.067      NP0            PACKET_EGR_DROP             D   RSV_DROP_QOS_DENY                          2
Aug 30 16:50:37.067      NP0            PACKET_EGR_DROP             D   RSV_DROP_QOS_DENY                          2
Aug 30 16:50:40.067      NP0            PACKET_EGR_DROP             D   RSV_DROP_QOS_DENY                          3
Aug 30 16:50:43.067      NP0            PACKET_EGR_DROP             D   RSV_DROP_QOS_DENY                          2
Aug 30 16:50:46.068      NP0           *PACKET_EGR_DROP             D   RSV_DROP_QOS_DENY                          2
RP/0/RSP0/CPU0:CORE-TOP#
Use Case 3: Packet Drops Outside Of NP Microcode
Packets dropped by any HW ASIC (e.g. FIA, Xbar) are not explicitly reported. The number of such packet drops can be inferred from the mismatch between the number of expected and counted packets. E.g. if PACKET_FROM_FABRIC count on egress NP is less than the PACKET_TO_FABRIC count on ingress NP, this indicates that packets are dropped in FIA. While this doesn’t directly explain the drop reason, it does indicate where are the drops happening and helps point further troubleshooting in the right direction.
In this use case the egress policer on Hu0/5/0/1 was replaced with a shaper of the same rate:
NP Traffic Manager is a hardware component of the ASR 9000 network processor. As the Traffic Manager receives the packet after the packet has already been processed by the NP microcode, drops by Traffic Manager are not reported to the packet tracer framework. They can, however, be observed in the QoS statistics.
RP/0/RSP0/CPU0:CORE-TOP#sh policy-map interface hu0/5/0/1 output
Sun Aug 30 17:09:45.008 UTC

HundredGigE0/5/0/1 output: packet-trace-test

Class exp4
  Classification statistics          (packets/bytes)     (rate - kbps)
    Matched             :                1000/1344000              606
    Transmitted         :                  75/100800               38
    Total Dropped       :                 925/1243200              0
  Queueing statistics
    Queue ID                             : 122898
    High watermark                       : N/A
    Inst-queue-len  (packets)            : 0
    Avg-queue-len                        : N/A
    Taildropped(packets/bytes)           : 925/1243200
    Queue(conform)      :                  75/100800               38
    Queue(exceed)       :                   0/0                    0
    RED random drops(packets/bytes)      : 0/0

Class class-default
  Classification statistics          (packets/bytes)     (rate - kbps)
    Matched             :                   2/176                  0
    Transmitted         :                   4/340                  0
    Total Dropped       :                   0/0                    0
  Queueing statistics
    Queue ID                             : 122899
    High watermark                       : N/A
    Inst-queue-len  (packets)            : 0
    Avg-queue-len                        : N/A
    Taildropped(packets/bytes)           : 0/0
    Queue(conform)      :                   4/340                  0
    Queue(exceed)       :                   0/0                    0
    RED random drops(packets/bytes)      : 0/0

RP/0/RSP0/CPU0:CORE-TOP#sh packet-trace results
Sun Aug 30 17:09:50.904 UTC
T: D - Drop counter; P - Pass counter
Location     | Source       | Counter                   | T | Last-Attribute                           | Count
------------   ------------   -------------------------   -   ----------------------------------------   ---------------
0/5/CPU0       NP3            PACKET_MARKED               P   HundredGigE0_5_0_6                         1000
0/5/CPU0       NP3            PACKET_TO_FABRIC            P                                              1000
0/5/CPU0       NP0            PACKET_FROM_FABRIC          P                                              1000
0/5/CPU0       NP0            PACKET_TO_INTERFACE         P   HundredGigE0_5_0_1                         1000
RP/0/RSP0/CPU0:CORE-TOP#
Use Case 4: Processing Of ICMP Echo Requsts
This use case demonstrates how packet tracer framework can be used to trace punted packets. It also shows the specific way in which ASR 9000 is responding to ICMP echo requests.
Topology and relevant configuration:
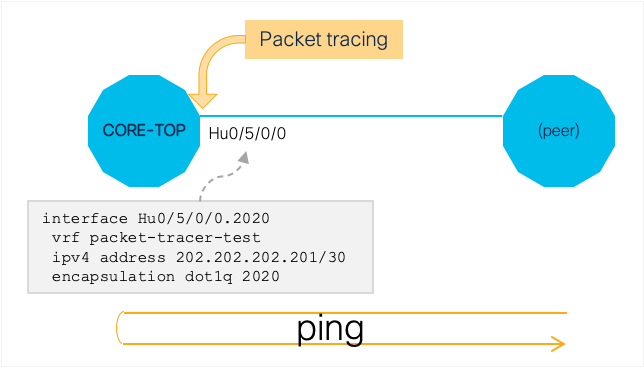
Applied packet tracer condition to match VLAN ID 2020 and IPv4 address 202.202.202.201:
RP/0/RSP0/CPU0:CORE-TOP#sh packet-trace status
------------------------------------------------------------

Packet Trace Master Process:

  Buffered Conditions:
    Interface HundredGigE0/5/0/0
    1 offset 14 value 0x7e4 mask 0xfff
    2 offset 34 value 0xcacacac9 mask 0xffffffff

  Status: Active

RP/0/RSP0/CPU0:CORE-TOP#
Packet trace results:
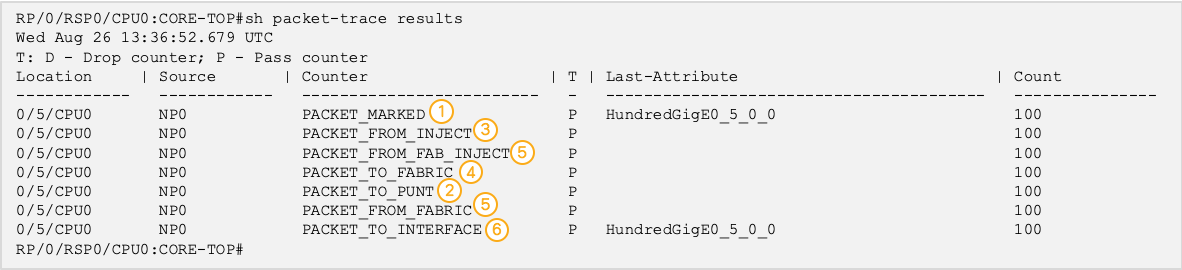
From this result the packet flow of ICMP echo processing inside ASR9k:
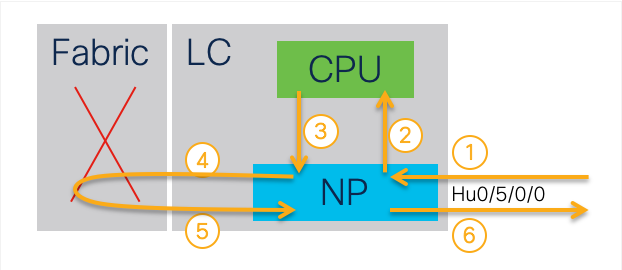
You can also observe that NetIO on IOS XR routers reuses the buffer carrying the ICMP echo request packet when it generates the echo reply, thus preserving the packet tracer flag in the internal packet header.
Use Case 5: Trace Packets On Punt Path
Packet tracing on punt path is supported since XR release 7.5.2. You can trace packets in SPP, NetIO, UDP and TCP. SPP and NetIO have a collection of libraries that are dynamically linked. As only processes can register counters with the packet trace framework, in all SPP and NetIO library functions use three generic counters: ENTRY_COUNT, EXIT_COUNT, DROP_COUNT. During each counter increment, a detailed description of the action is passed on to the packet trace framework as an attribute in the counter update API. You can use the “show packet-trace result counter <name>” to see the details.
Below example shows the packet-trace counters incremented during a telnet session into the router.
RP/0/RSP0/CPU0:ASR9910-1-xrg-403#sh packet-trace status
Thu Jun  5 09:36:07.592 UTC
------------------------------------------------------------

Packet Trace Master Process:

  Buffered Conditions:

  Status: Inactive

RP/0/RSP0/CPU0:ASR9910-1-xrg-403#packet-trace condition interface Bundle-Ether200
Thu Jun  5 09:36:35.197 UTC

RP/0/RSP0/CPU0:ASR9910-1-xrg-403#sh packet-trace status
Thu Jun  5 09:36:37.976 UTC
------------------------------------------------------------

Packet Trace Master Process:

  Buffered Conditions:
    Interface Bundle-Ether200
      Member HundredGigE0/4/0/3

  Status: Inactive

RP/0/RSP0/CPU0:ASR9910-1-xrg-403#packet-trace condition 1 Offset 23 Value 0x06 Mask 0xff
Thu Jun  5 09:37:34.471 UTC

RP/0/RSP0/CPU0:ASR9910-1-xrg-403#packet-trace condition 2 Offset 30 Value 0xac191d65 Mask 0xffffffff
Thu Jun  5 09:37:45.423 UTC

RP/0/RSP0/CPU0:ASR9910-1-xrg-403#sh packet-trace status
Thu Jun  5 09:37:51.807 UTC
------------------------------------------------------------

Packet Trace Master Process:

  Buffered Conditions:
    Interface Bundle-Ether200
      Member HundredGigE0/4/0/3
    1 offset 23 value 0x6 mask 0xff
    2 offset 30 value 0xac191d65 mask 0xffffffff

  Status: Inactive

RP/0/RSP0/CPU0:ASR9910-1-xrg-403#packet-trace start
Thu Jun  5 09:37:57.795 UTC
RP/0/RSP0/CPU0:ASR9910-1-xrg-403#show packet-trace results
Thu Jun  5 09:38:12.535 UTC
T: D - Drop counter; P - Pass counter
Location     | Source       | Counter                   | T | Last-Attribute                           | Count
------------   ------------   -------------------------   -   ----------------------------------------   ---------------
RP/0/RSP0/CPU0:ASR9910-1-xrg-403#show packet-trace results
Thu Jun  5 09:38:23.307 UTC
T: D - Drop counter; P - Pass counter
Location     | Source       | Counter                   | T | Last-Attribute                           | Count
------------   ------------   -------------------------   -   ----------------------------------------   ---------------
0/RSP0/CPU0    SPP-PI         CLIENT_PUNT_SUCCESS         P   stage1                                     24
0/RSP0/CPU0    NETIO-PI       BYPASS_MUT_QFULL_DROP       D   packet_input_bypass                        24
0/RSP0/CPU0    NETIO-PI       IP_COUNT                    P   netio_send_pulse_input                     24
0/RSP0/CPU0    spp-LIB        ENTRY_COUNT                 P   SPP PD Punt: stage1                        24
0/RSP0/CPU0    netio-LIB      ENTRY_COUNT                 P   lpts_npmb_ipv4_delivers                    72
0/RSP0/CPU0    tcp-LIB        ENTRY_COUNT                 P   ip lib - input from netio                  48
0/RSP0/CPU0    TCP            RECV_PCB_RQ                 P   TCP pkt processing done                    17
0/4/CPU0       NP1            PACKET_MARKED               P   HundredGigE0_4_0_3                         22
0/4/CPU0       NP1            PACKET_TO_FABRIC            P                                              22
RP/0/RSP0/CPU0:ASR9910-1-xrg-403#
XR Embedded Packet Tracer Restrictions And Limitations
XR release 7.1.2:
- Packet marking is supported on 5th, 4th and 3rd generation line cards (aka Lightspeed Plus, Lighstpeed, Tomahawk).
- Packet tracing is supported in the NP microcode of 5th, 4th and 3rd generation line cards.
- You can specify a maximum of three 4-octet Offset/Value/Mask sets.
- Embedded Packet Tracer is not HA (high availability) aware. Specified packet tracer conditions are not synchronised with the standby RP.
- By design, packet tracer conditions cannot be updated while packet tracing is active.
XR release 7.5.2:
- packet tracer automatically resolves bundle members at the time when the condition is set
- you can now trace packets on the punt path in SPP, NetIO, UDP, TCP
Appendix 1: XR Embedded Packet Tracer Framework Architecture Details
Packet tracer master process pkt_trace_master on active route processor (RP) card is responsible for user interaction and sending instructions to processes participating in the packet tracer framework. When packet-trace start command is issued, pkt_trace_master process broadcasts the specified conditions to all participating processes. Receiving process detects whether the condition applies to entities it owns and acts accordingly. That way only the NPs that own the interfaces specified in the packet tracer condition programme the condition in HW.
When packet tracing is enabled on an interface, the Network Processor (NP) checks whether received packets are matching the specified condition. If packet matches the condition, a flag is set in the internal packet header. This flag in the internal packet header allows for the tracing of this packet on all elements in the data-path and punt-path inside the router.
On every line card (LC) and route processor card (RP) a pkt_trace_agent process maintas the array of counters registered by each process participating in the packet tracer framework. Processes participating in the packet tracer framework communicate counter updates to the pkt_trace_agent process. When you issue the show packet-trace result command, the pkt_trace_master process on active RP polls data from all cards and displays the non-zero counters.
Leave a Comment