
Introduction to the WAN Automation Engine (WAE) Design User Interface
Overview
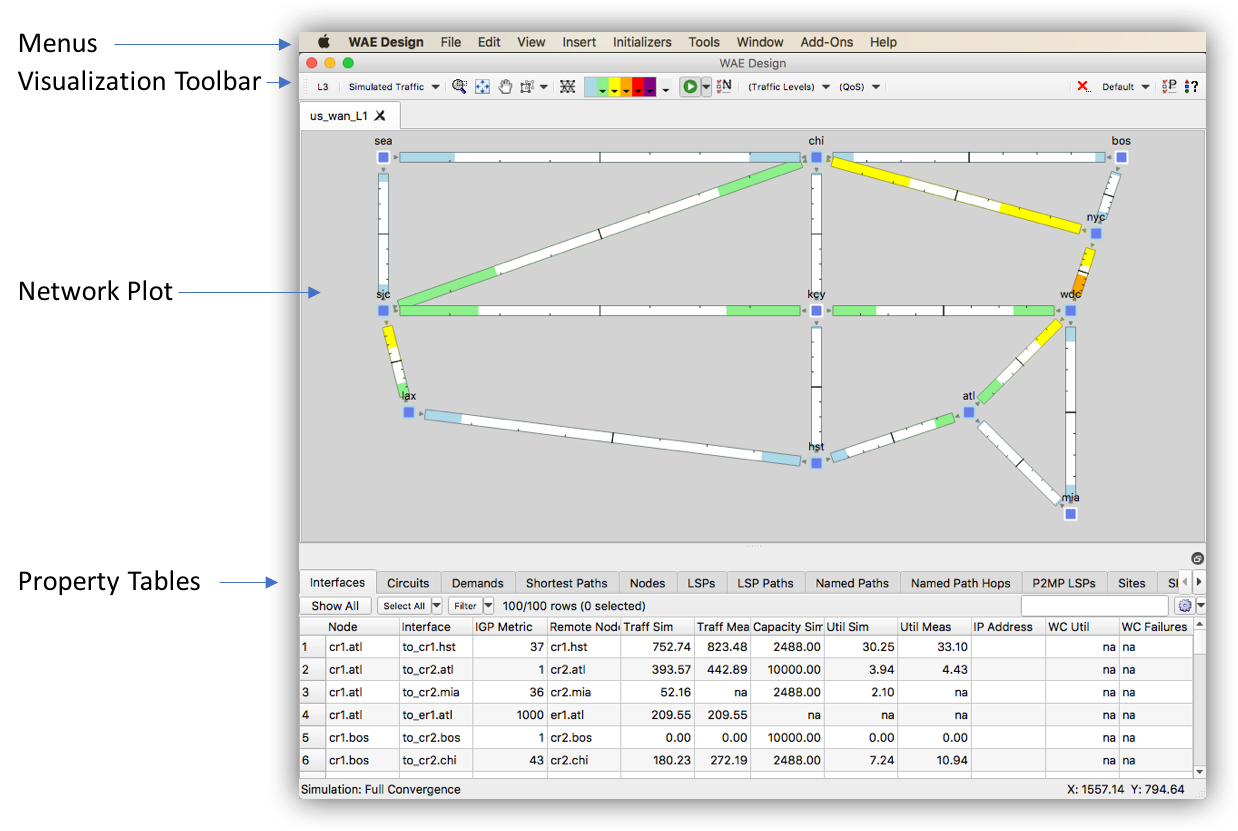
WAE Design is a planning tool for design, engineering, and capacity planning of IP/MPLS networks. This tutorial will examine some key features of the WAE Design user interface.
Note:
- When WAE collects from the network, the output of the collection process is a network model which is often referred to as a plan file. The network model is then used by WAE applications such as WAE Design.
- The network model used in this tutorial is from the WAE Design samples directory: us_wan_l1.txt
- If you don’t have the WAE Design application, see the tutorial Using dCloud to Access the WAN Automation Engine Demos.
- If using dCloud, use the US East datacenter and launch the demo for “WAE Live”. The WAE Design application will be on the workstation desktop.
Navigation of the WAE Design User Interface
This section describes how to navigate the WAE Design user interface.
Property Tables
Property Tables display collected and simulated information of objects in the network model.
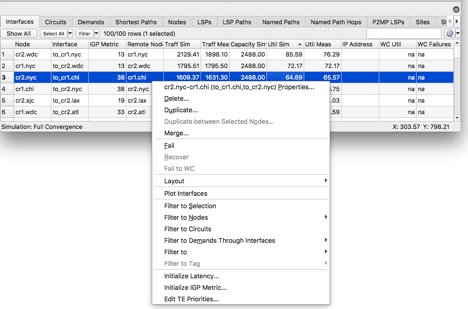 Select a row in a table and right-click to open a context menu. Common tasks usually involve opening the Properties menu at the top to edit information about the object, deleting or duplicating the object or filtering to related objects.
Note: In WAE when looking at an interface, the traffic and utilization values are referring to egress traffic and utilization of the interface.
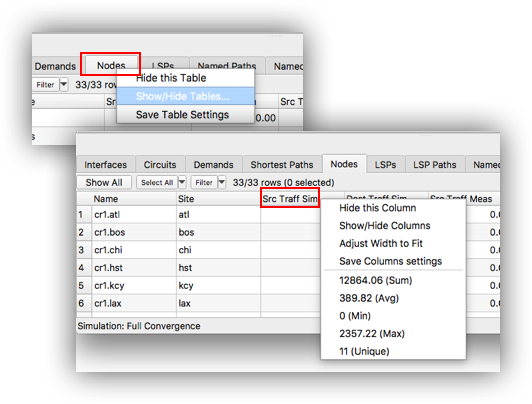 There are many tables and columns that are not shown by default. Tables can easily be shown or hidden as needed by right-clicking on any table header and selecting Show/Hide Tables. Each table also has a large set of display columns which can also be shown or hidden by right-clicking the column header and selecting Show/Hide Columns.
Advanced filter features allow the user to pinpoint specific objects in a table using the Filter button. In addition, objects can easily be sorted by clicking on the column header. Summary statistics for each column can be obtained by right-clicking on the column header.
The Network Plot
The Network Plot shows a visual representation of the network topology and interface utilizations.
Most of the visualization options are selectable in the Visualization Toolbar directly above the Network Plot.
Typically, nodes can be grouped into user defined Sites. Sites can also be grouped in user defined Parent Sites. Note that the node/site/parent site mapping is not layout specific, it applies for all layouts. Layouts are described in more detail later.
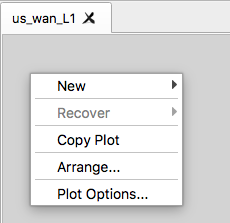 If you right-click on an object in the plot, you will open the objects’ context menu. However, if you right-click an empty area of the plot as shown on the right, you will open the plot context menu which provides options such as menus for creating new objects, recovering simulated failures, a copy plot feature that copies an image of the current plot to the clipboard, an Arrange menu for aligning elements in the plot and a shortcut to bring up the Plot Options menu.
Warning! WAE Design does not have “Undo” or “Redo” capabilities. If you move nodes/sites or accidently delete an object from the model, you cannot go back. It is recommended that you frequently save the plan file.
The Visualization Toolbar
Most of the important aspects of the Visualization Toolbar are shown from left to right in the following animated gif.
- L3/L1 toggle button enables quick transition from the DWDM L1 topology to the L3 topology.
- The Traffic View selection can display the difference between the measured and simulated utilizations of the network. The Worst Case and Failure Impact views are populated using the Simulation Analysis tool described in another tutorial.
- There are buttons to zoom, drag and fit the network plot.
- In large networks, the various circuits can network can look complicated. You can select objects and set the opacity of the background objects to make a selection stand out.
- The Arrange menu can also be launched which provides options for arranging sites and nodes.
- The colors on the links represent the utilization value. These color thresholds can be configured.
Layouts and the Plot Options Menu
In the properties menu for Sites and Nodes, there are schematic (X, Y) and geographic (longitude and latitude) coordinates. This determines the positon of these elements on the Network Plot. You can click and drag a node or site to change its position or use the Arrange menu to align and position the nodes or sites.
Note:
- The geographic coordinates as well as node/site/parent site mappings apply to all layouts
- There is no “undo” functionality
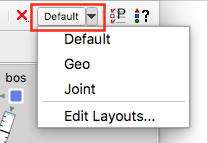
Layouts are used to present different views of the network. The layout drop-down allows you to quickly change between the defined layouts. Layouts can be created, modified, duplicated or deleted using the Edit Layouts option.
A layout has a PlotLayoutType that can either be ‘Design’ or ‘Weathermap’. The difference is Weathermap layouts allow you to click and drag to bend circuits for clarity.
The Plot Options menu enables custom settings that are applied to the current selected layout. The Plot Options menu is accessed by right clicking an empty area of the network plot and selecting “Plot Options”. The following examples from the Plot Options menu can be applied to a layout.
| Plot Options Tab | Options |
|---|---|
| General Options | Schematic vs Geographic: Schematic layouts use the X,Y positioning. Geographic will use the longitude and latitude positioning using either an outline or detailed background map. |
| Design Colors | Set the utilization threshold colors that appear in the plot |
| Design Circuits | Set the width of the circuits. Apply text such as name, IGP metric, IP address, utilization percentage. Group parallel circuits |
| Layer 1 | Set the width of the L1 Links. Apply text such as name, number of L1 circuit paths, distance or delay. Show L1 waypoints and utilizations. Show the layer 1 topology in the background of the layer 3 topology and show the layer 3 topology in the background of the L1 view. |
Simulation and Identifying the Simulation Mode
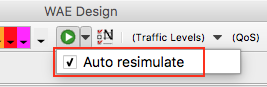 When making changes to the plan file, you may not want to have WAE Design resimulate the network after every change. If you want to make multiple changes to the network and resimulate at a later time, uncheck the Auto resimulate button. When you are finished making all the changes select the Play button when you want to run a simulation.
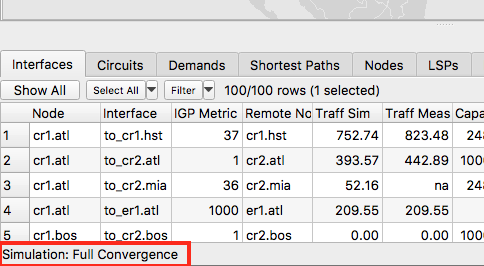 When running a simulation, it’s important to understand what simulation mode you are currently in. (Simulation modes will be described in another tutorial). The current simulation mode is shown at the bottom of the WAE Design application below the Property Tables.
Conclusion
This tutorial covered the basics of the WAE Design user interface. Please check out our other tutorials to explore additional features and capabilities of WAE.
Leave a Comment