
NCS5500 Performance and Load-Balancing at Scale [Lab Series 01]

You can find more content related to NCS5500 including routing memory management, VRF, URPF, Netflow, QoS, EVPN, Flowspec implementation following this link.
Introduction
This test is the first episode coming with a video on our new Lab Series.
You can find a detailed explanation on the purpose and also a link to all other tests in this xrdocs.io post: https://xrdocs.io/ncs5500/tutorials/ncs5500-lab-series/
We see regular requests from customer to demonstrate the scale we claim and particularly regarding the port density.
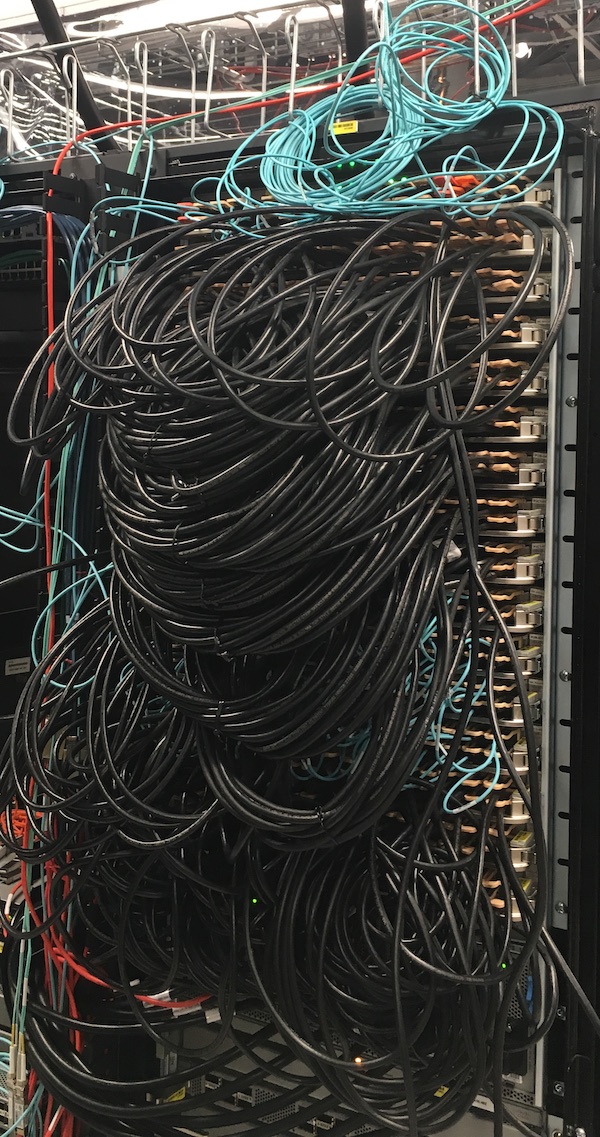
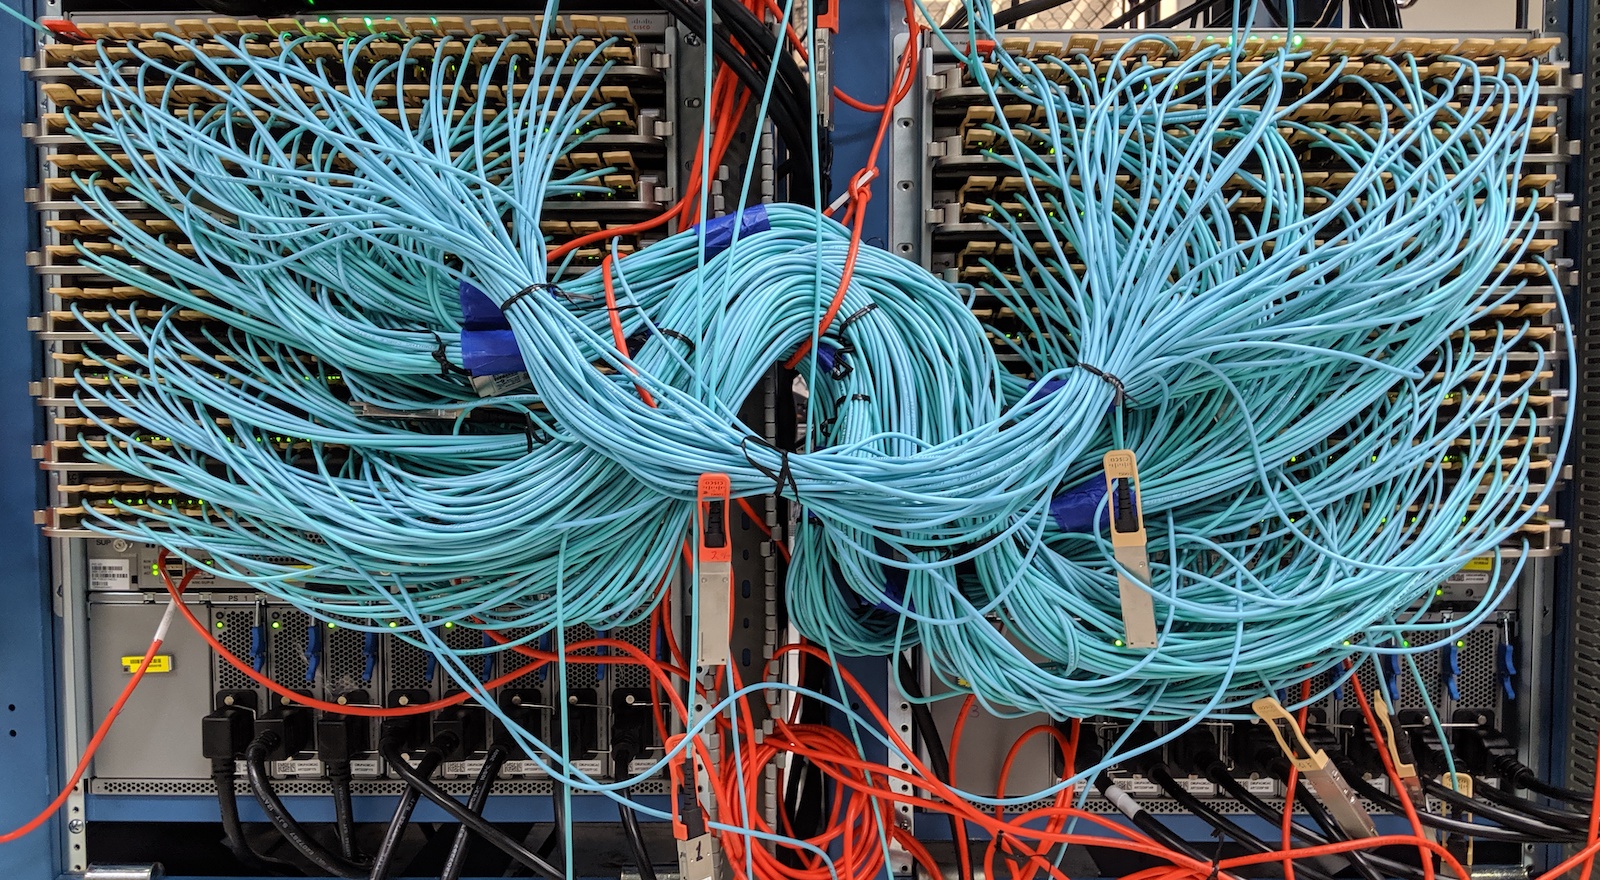
The NCS5500 chassis exist in 4-slot, 8-slot and 16-slot version and it’s fairly complicated to create a setup large enough in a lab when we talk about 36x 100GE interfaces per slot.
Due to the orthogonal architecture of the chassis, it’s not really necessary to have fully wired chassis at least to demonstrate that performance aspect, which is directly related to the NPU capabilities. Having the ports of two NPUs wired should be enough. But we understand the customers’ concern when investing in such large systems, that’s why we had to create testbeds specifically to clarify these doubts.
These topologies permit to test fabric load, ASIC limits, and power consumption. Considering the cost of traffic generator ports, the snake architecture is a good approach the re-inject of the traffic hop-by-hop and load the chassis with minimal (but still significant) investment.
For this article, we built a test bed where two NC5508s equipped with 36x100GE-SE line cards (the ones with Jericho+ NPUs and external TCAM) are fully wired back-to-back. That means we have twice 288 interfaces at 100GE and we will push bi-directional line rate traffic through it.
This large test bed will give us the opportunity to verify:
- line rate traffic for IPv4 and IPv6
- what is the minimum packet size
- how it behaves with IMIX packet distribution
- what is the impact on features like ACLs and QoS when they are applied on ALL the ports
- longevity tests
- power and CPU usage But also, the setup is perfect to demonstrate link bundling and load balancing at scale
- bundles of 64x 100GE interfaces
- load balancing inside each bundle
- load balancing between multiple large bundles
Pratyusha Aluri, software engineer in Cisco’s Service Provider business unit built and configured this setup. She will run all these tests as recorded in the video:
Tests
Disclaimers
It’s important to understand the limits when using snake topologies:
- the NDR performance is reflecting the more loaded Cores in the NPU (particularly in situation where we have an odd number of ports per NPU and therefor an uneven allocation. Ex: Jericho+, where 5 ports are assigned to a core and 4 ports are allocated to the other core)
- the latency measured can’t be trusted
- configuration tricks are required to overcome the natural limitation of max 255 hops in IP routing
- once the NDR is identified, tests on performance below that level can not be trusted to identify the drop rates (a drop on the first link will be cascaded on the following ports, making the overall drop rate amplified artificially)
Definition: NDR stands for Non Drop rate. It represents the minimum packet size the router can forward on all ports, both directions, 100% line rate, without any drops.
Performance testing
The video is 13-minute long, you can directly reach the different sections with these shortcuts:
- Lab topology description: https://youtu.be/s6qSt6C2D5U?t=782
- NDR tests at 129B and 130B IPv4 https://youtu.be/s6qSt6C2D5U?t=164
- Longevity testing / Power and CPU: https://youtu.be/s6qSt6C2D5U?t=315
- Performance test with IPv4 IMIX distribution: https://youtu.be/s6qSt6C2D5U?t=345
- NDR tests at 129B and 130B IPv6: https://youtu.be/s6qSt6C2D5U?t=375
- NDR tests with IPv4 130B packets with ACL and QoS applied: https://youtu.be/s6qSt6C2D5U?t=407
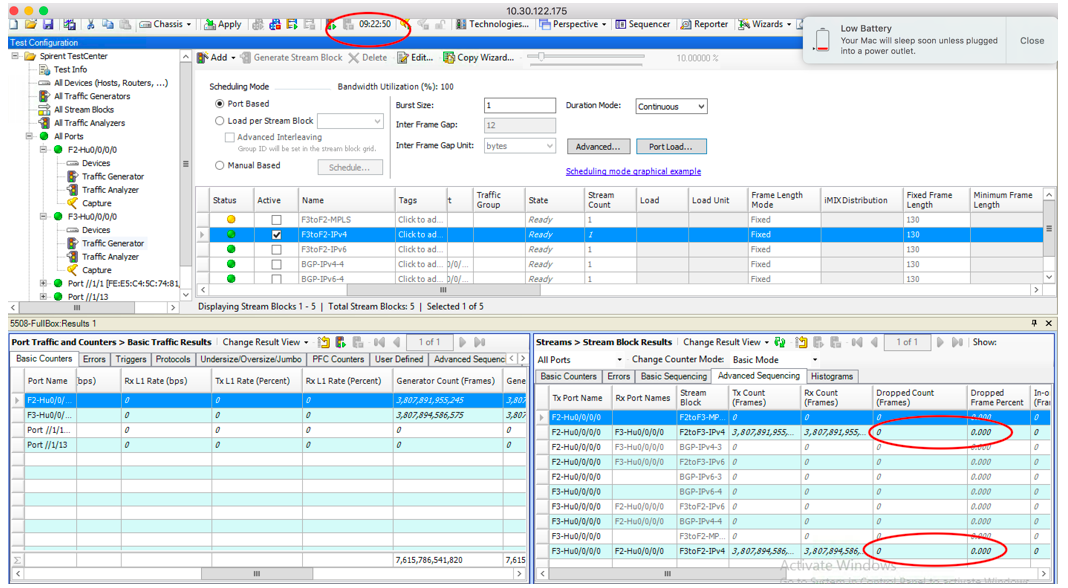
For these tests we are using an Layer 3 snake, that means we will use basic static routing and VRF-lite (only locally significant VRFs). Since all the ports are directly to connect to their counterpart on the facing NCS5500, the configuration is easy to understand. Only ports 0/0/0/0 are used to connected to the traffic generator.
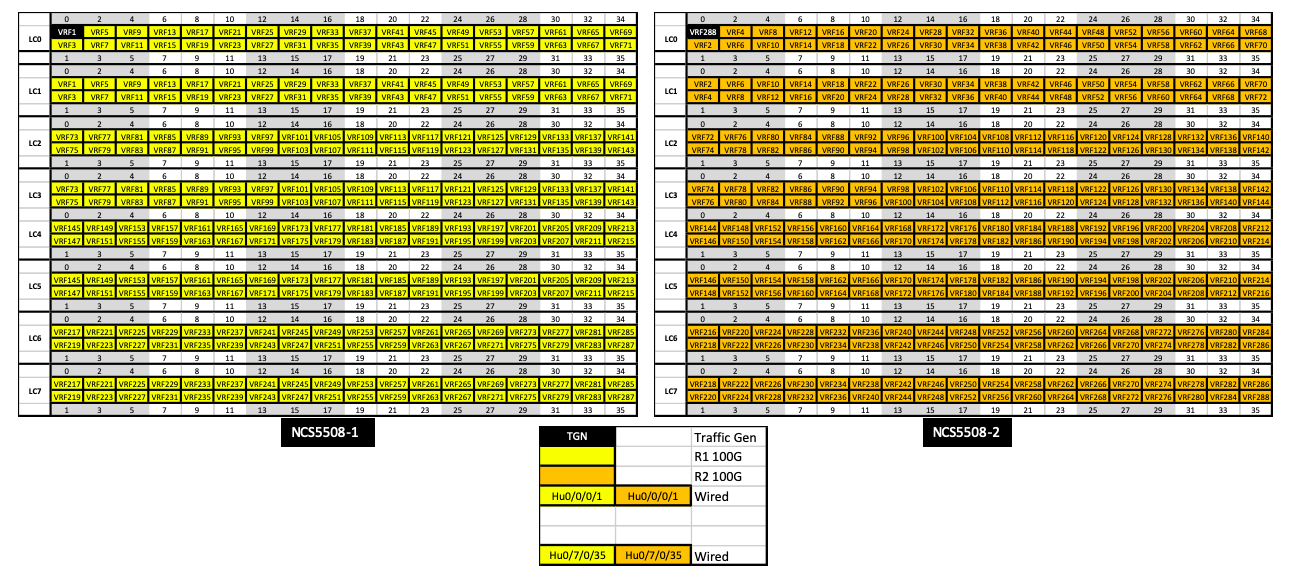
The configuration is made such as traffic received in a port is not locally routed or switched but will always “travel” through the fabric (under the form of cells).
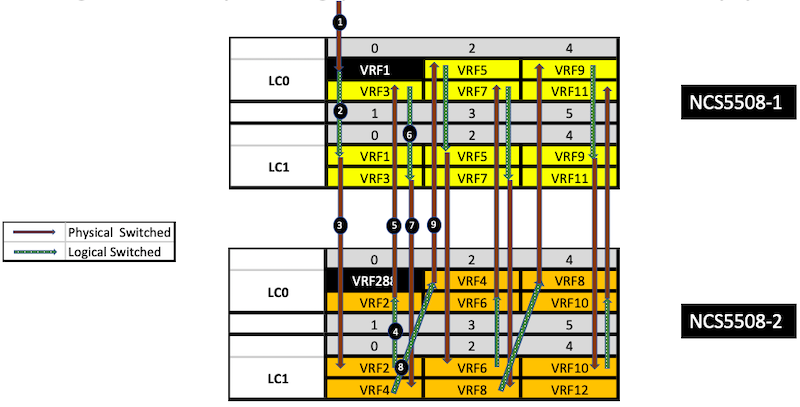
We have 288 ports, twice. So it’s much more than the max TTL count, even if we set up the traffic generator to mark the packets with TTL=255. We need to use the following trick:
hw-module profile tcam format access-list ipv4 src-addr dst-addr src-port dst-port proto frag-bit enable-set-ttl ttl-match
In the tests above, we will be able to demonstrate:
- NDR for Jericho+ systems snake topology is 130 bytes per packet
- IPv4 and IPv6 performance are identical
- Features applied on interface are not impacting the PPS performance
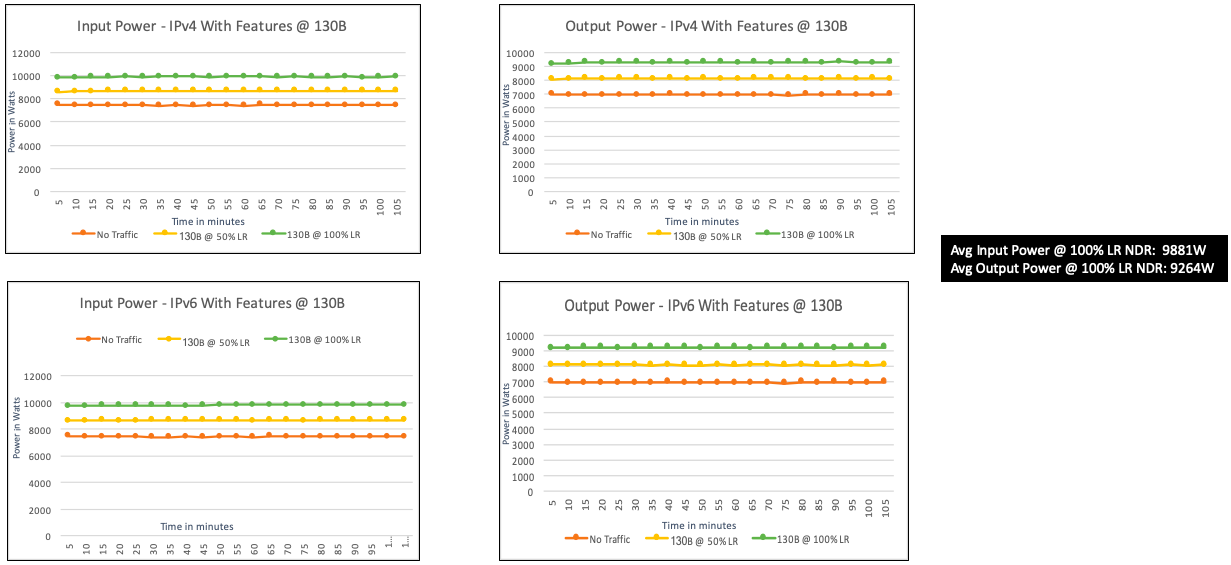
Also we performed a longevity test to verify we don’t lose any packet on a long period (9h+):
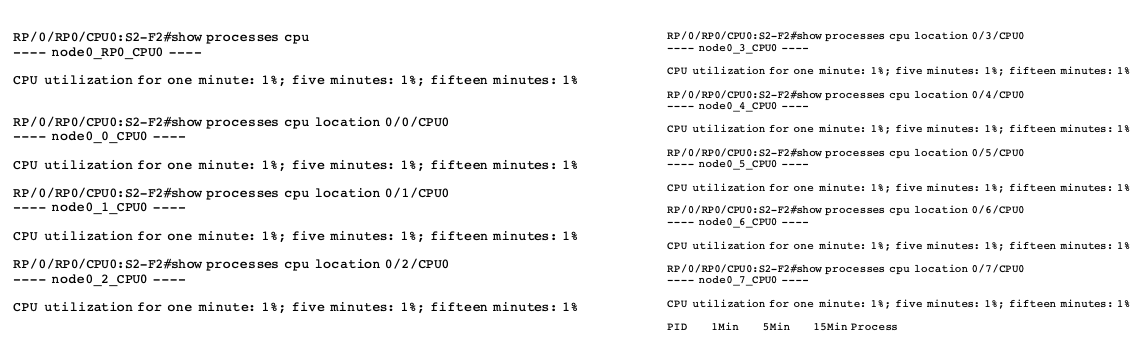
And during this test we also measured power consumption and CPU usage:
CLI used during the test:
monitor interface *
show controller fia diagshell 0 "diag counters g" location 0/0/CPU0
(admin) show controller fabric plane all statistics
show processes cpu
show interfaces hu0/0/0/0 accounting
Link Aggregation and ECMP
The second part of the testing starts at:
- LAG and ECMP tests: https://youtu.be/s6qSt6C2D5U?t=599
We define 4 bundles with 64x 100GE interfaces each and a fifth one made of the remaining 31x 100GE ports.
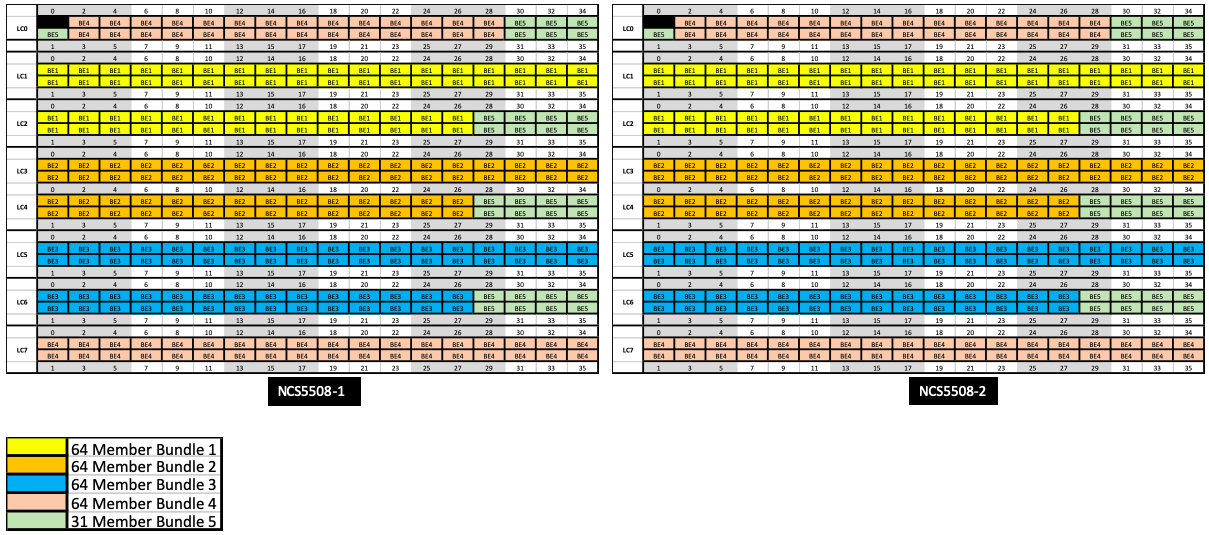
In this test we are able to measure that ECMP is properly load balancing the traffic between the different bundles but also that traffic is evenly spread inside the bundles themselves.
CLI used during the test:
show bundle br
monitor interface bundle-ether *
show interface be1
monitor interface hu 0/1/0/*
show cef ipv6 131::
Leave a Comment