
Testing NDR on NCS5500 36x 100GE Line Cards [Lab Series 02]

You can find more content related to NCS5500 including routing memory management, VRF, URPF, Netflow, QoS, EVPN, Flowspec implementation following this link.
Introduction
This test is the second episode of our new Lab Series. You can find a detailed explanation on the purpose and also a link to all other tests in this xrdocs.io post: https://xrdocs.io/ncs5500/tutorials/ncs5500-lab-series/
Last week, we ran multiple tests in very heavily wired systems. Among the topics covered, we measured the NDR with a very long snake.
The concept of Non Drop Rate deserves dedicated explanations.
In this article and video, we will explain what it represents. We will demonstrate why the snake topology is not the best to reach the full capability of the ASIC and what happens when you push the system to its limit.
Video
What is NDR?
The concept of Non Drop Rate, or NDR, is often used in system validation to qualify the NPU capabilities. It represents the minimum possible packet size you can transmit:
- on all ports of the NPU
- with 100% line rate on each port
- bi-directionally
Often times, it’s something that can be derived with simple math starting from the number of packets per second the forwarding ASIC can support. But some other factors may come into play.
We will see in these tests that a good understanding of the internal architecture may be necessary to interpret correctly the numbers measured in lab.
As useful as it is to compare different devices, it’s also very important to understand the limit of this number. NDR, like many other topics covered in these videos, is mostly a “lab thing”.
In the example we are using today, the NDR for Jericho+ used in the 36x100G-SE line card, is 130 bytes per packet. For Jericho2, it will be around 230 or 280 bytes per packet depending on the line card. But it’s virtually impossible to get 9 ports 100G (assigned to a same NPU) or worse, 12 ports 400G, running sustained line rate bidirectional traffic simultaneously.
It’s possible to imagine a couple of ports being saturated following a network outage, with a lot of traffic redirected via a specific path. But having the 9 ports in such situation would reflect a very poorly designed network, or… a lab situation.
What about a DDoS attack trying to saturate the Jericho+ NPU?
The question would have make sense 5 or 10 years ago, but it’s not something that can be expected in current production networks based on such ASICs.
We are talking about 900Gbps and 835MPPS of forwarding capacity here. A DDoS attack larger than 900Gbps have been seen in the past, but the very nature of a DDoS is to be distributed (the first D in DDoS), that means the attack packets will come from everywhere on the internet and it will be virtually impossible to concentrate it on 9 ports of an NPU specifically. Attack packets will land naturally on many sites, many routers, many NPUs.
With the same logic, if we can imagine attacks exceeding 835MPPS (with SYN flood, it has been seen in the past), the coordination of this attack on a specific NPU is extremely complex. And attackers with such compute power at their disposal will leverage other tools to attack their targets, in a much efficient way.
So, a DDoS attack leveraging this “bottleneck” is extremely unlikely (in this world, never say never, but today it should not be a matter of concern).
Can we use a snake test for NDR measurement?
Yes and no.
Let’s say it’s not the best for such test, but considering the number of ports on the router, the tester interfaces necessary for a fully wired topology are extremely expensive and difficult to find.
So the logical approach to load a line card or a chassis is to wire ports back-to-back and to configure VRFs, Bridging or MPLS static swapping. That way, we only need two ports from the traffic generator (actually one can be enough).
But this methodology comes with a lot of limitations:
- TTL remarking may be needed for large setup
- latency can no longer be measured
- if numbers of ports are not consistent per NPU or per Core, it will affect the results
- a drop on a link or an NPU will be reflected on all the remaining ports: you can measure NDR with such topology but you can not trust any measurement below that level due to multiple cascading effects.
Do I need a fully loaded chassis or even a fully loaded line card?
Since we are testing the NPU capability, we just need to make sure the traffic is not locally routed/switched. That means we need to use at minimum two different NPUs, all wired. So, with the line card we are using today, 9x2=18 ports would have been enough to run this test.
Having more ports is impressive (and I admit, fun), but it doesn’t not bring anything aside, may be, the power consumption measurement.
Test results
In this test we were able to measure NDR at 130 bytes per packets. But also, we identified drops above this limit in some particular ranges.
What are we measuring actually?
The first mistake would be to think we can measure the ASIC performance, dividing it by the number of ports.
835MPPS / 9x 100GE gives us 92.77MPPS per port. That’s not how it works internally.
In the case of the Jericho+ ASIC, the ports allocation is unbalanced. Simply because we have an odd number of them:
- 5x 100GE interfaces on core 0
- 4x 100GE interfaces on core 1
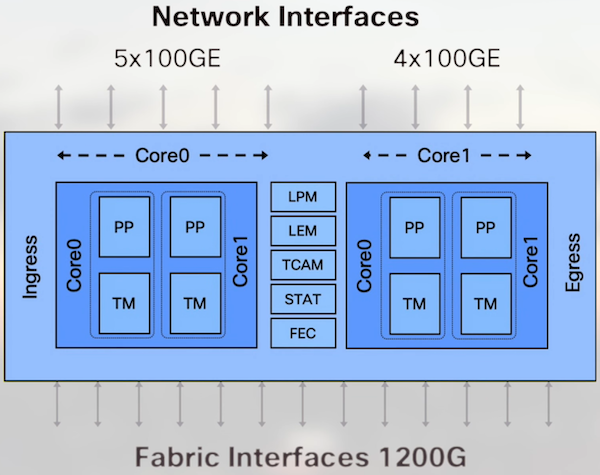
You can verify the port allocation per NPU and core with:
show controller npu voq-usage interface all instance all location 0/x/CPU0
So what we actually measure with a snake topology is the performance of the most loaded core:
5x100G on core 0.
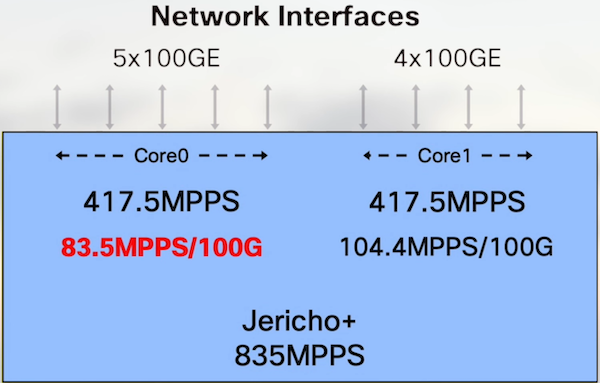
Instead of the 92.77MPPS calculated above, the reality of the test matches this number: 83.5MPPS per 100GE port.
Since the packets handled by core 0 will flow through core 1 too, we take the lowest denominator.
Consequence: this kind of snake test can only show a maximum of 751.5MPPS per NPU.
Note that if you test only the 4 other ports allocated to core 1, we get 104.4MPPS per 100GE.
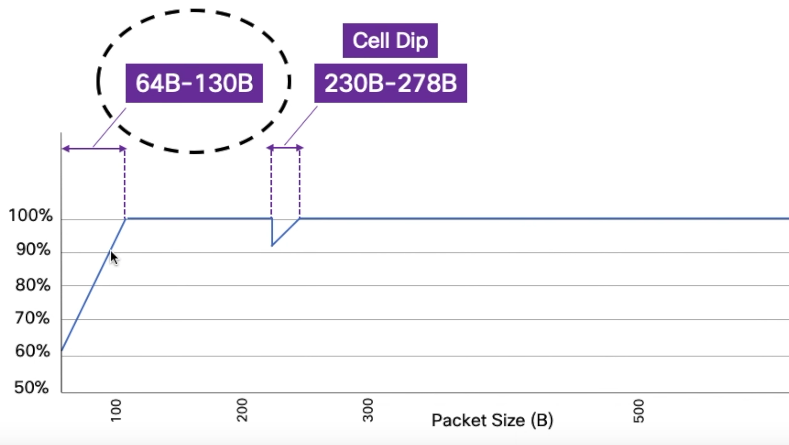
Under and above 130B/pkt
We have seen above that each core can handle 417.5MPPS.
In the worst case (core 0), we have 5 ports 100GE. Total 500Gbps.
To calculate the larger packet size we can push, we will run this simple math:
NDR + Header (20 bytes) = ROUNDUP ( 500,000,000,000 / 417,500,00 /8 )
That gives us an NDR of 130 bytes per packet.
Below, we are exceeding the number of PPS the NPU can handle. At 130, we finally cross the 835MPPS boundary and we can push packet line rate on all interfaces.
Between 230B/pkt and 278B/pkt
It’s frequent that customer ask to test specific packet size during the validation / CPOC. They want to see 64 bytes, 128 bytes, 256 bytes, …
Not reaching line rate with the first two is expected, as explained above. But it’s surprising that we still see packet drops at 256 bytes.
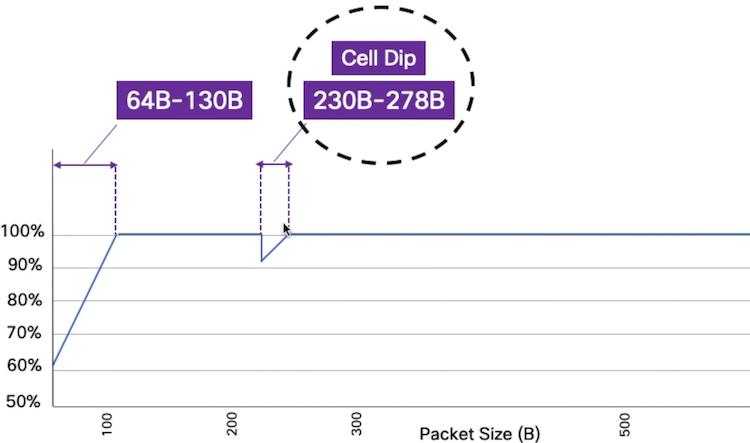
It’s because we have a specific behavior in the range 230 bytes to 278 bytes.
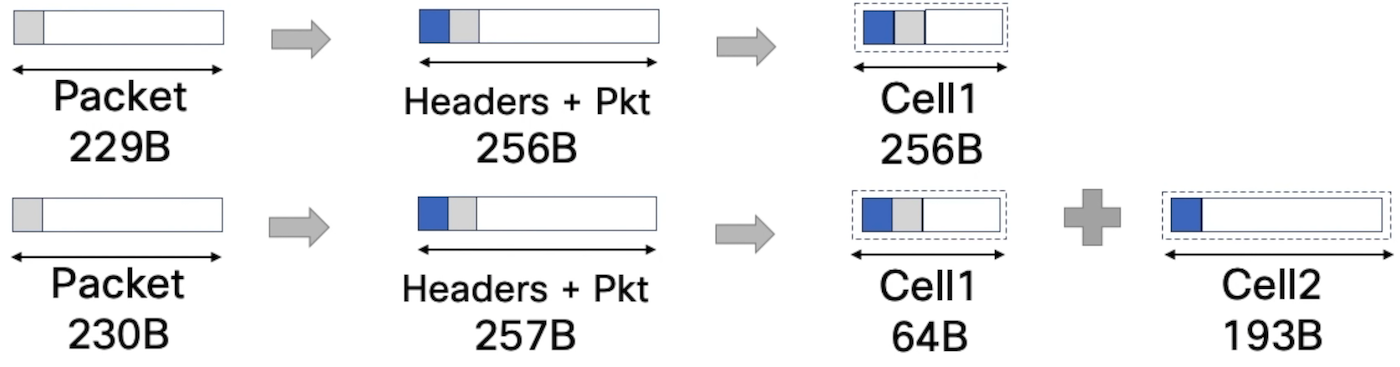
Internally, packets are split in cells before being sent to the egress pipeline (could be locally routed/switched or transmitted via the fabric). These cells could be of variable length, from 64B to 256B.
Also, when it’s transmitted internally, each packet is appended a couple of headers and 230 bytes is the point where you “jump” from one cell to two cells.
At that point, we hit a different bottleneck: the fabric capacity. With the packet size growing, it reduces the amount ot cells to the Fabric Engines and the symptoms disappear after 278 bytes per packet.
In the video, we executed the test with different packet sizes to illutrate that point.
If, during the test, you maintain the line rate traffic in both drop cases described above, you will see the percentage of drops moving from 8% to 20%. It can be explained by a cascading effect illustrated by the two diagrams below:
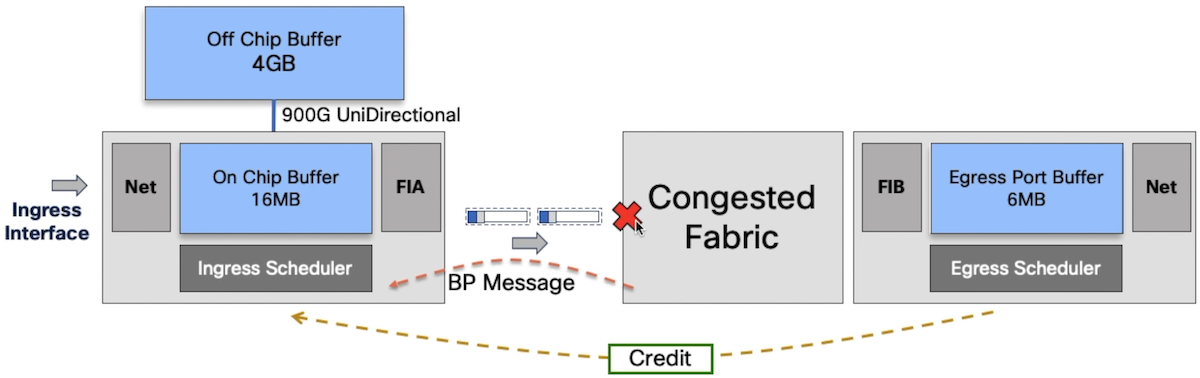
A token is granted to transmit the packet by the egress scheduler, the fabric is saturated and it issues a backpressure message to the ingress scheduler.
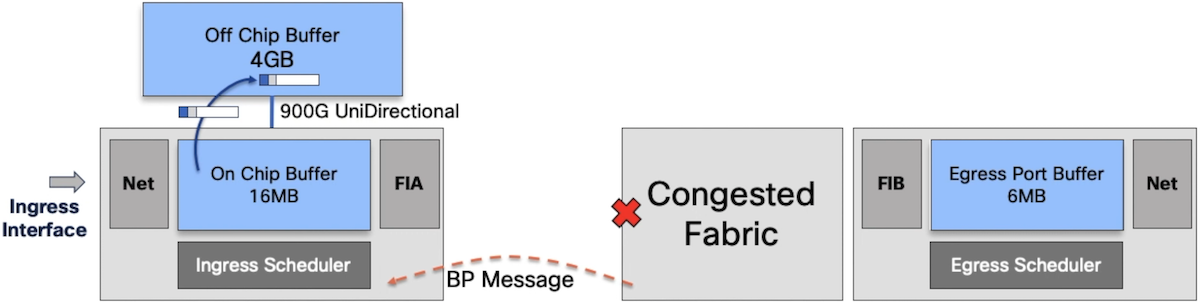
Since more and more packets are received from the same VOQ, the queue is evicted and the packets are stored in the GDDR5 DRAM. All packets are now going through the DRAM, which eventually saturates the link to this memory (900Gbps unidirectional that becomes 450Gbps read / 450Gbps write). We triggered a third type of bottleneck now. It’s possible to monitor all these drops with the following CLI.
show controller npu diag counters graphical instance 0 location 0/x/CPU0
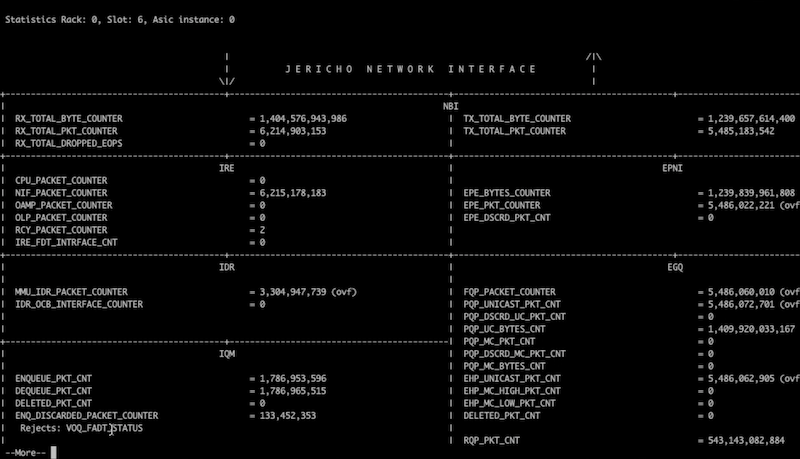
In the ENQ_DISCARDED_PACKET_COUNTER, we will get details on the reasons of the drop.
First it will show VOQ_FADT_STATUS. FADT stands for Fair Adaptive Tail Drop. It’s an internal mechanism optimizing the buffer management in case of congestion in the NPU core. The purpose being to reduce the drop threshold for congested queue if the level of congestion increases, in order to leave enough buffer for the non-congested queues.
In second step, if we maintain the congestion, we will see other kinds of ENQ_DISCARDED like IDR_DRAM_REJECT_STATUS (when we saturate the bandwidth to the DRAM).
Do we have always drops with packets in this 230B-278B range?
It’s a legitimate question we got from customers.
In the video, we demonstrate that reducing the bandwidth to 90% line rate makes the drop symptoms disappear.
Performance per 100G ports
Another frequent question we have during validation and CPOCs is the following: “is it a per port limitation or per NPU limitation”?
All these performance tests and NDR measurements are only reflecting the NPU capability (or in the case of snake topology, at least the core capability).
If the NPU is not reaching its PPS limit you can push packets, through the fabric or locally routed, at 64 bytes per packet between two ports.
That’s what we demonstrate in the video in the last part with ports 0 and 35 configured in the same VRFs and 64B packets transmitted line rate between the two ports.
And just for the sake of demo, we prove it with 256B packets too (in the 230B-278B range).
Conclusion
We hope this video and few explanations have been useful and will guide you if you need to run these kind of tests yourself. The snake topology is good to reduce the amount of traffic generator ports but it comes with some limitations, so it’s important to understand the internal mechanisms at play to explain all the results.
Finally, it’s something we repeated several times in the video: these tests should be taken for what they are, lab demo. And it’s dangerous to compare the results with production since the nature of this last one is very different.
Leave a Comment