Multithreading in MDT
Collections
Have you ever thought what “sample-interval” really means? And why is it so important to really understand its operation and properly design your telemetry configuration?
In this paper, I will explain how collections work internally. The overall process can be divided into three major parts:
- Messaging to a router
- Internal operations within MDT process
- Collecting data from a requested sensor path (and sending back to a collector)
It is not very important for our topic whether you have dial-in or dial-out mode configured on your router, so let’s consider a case with dial-in.
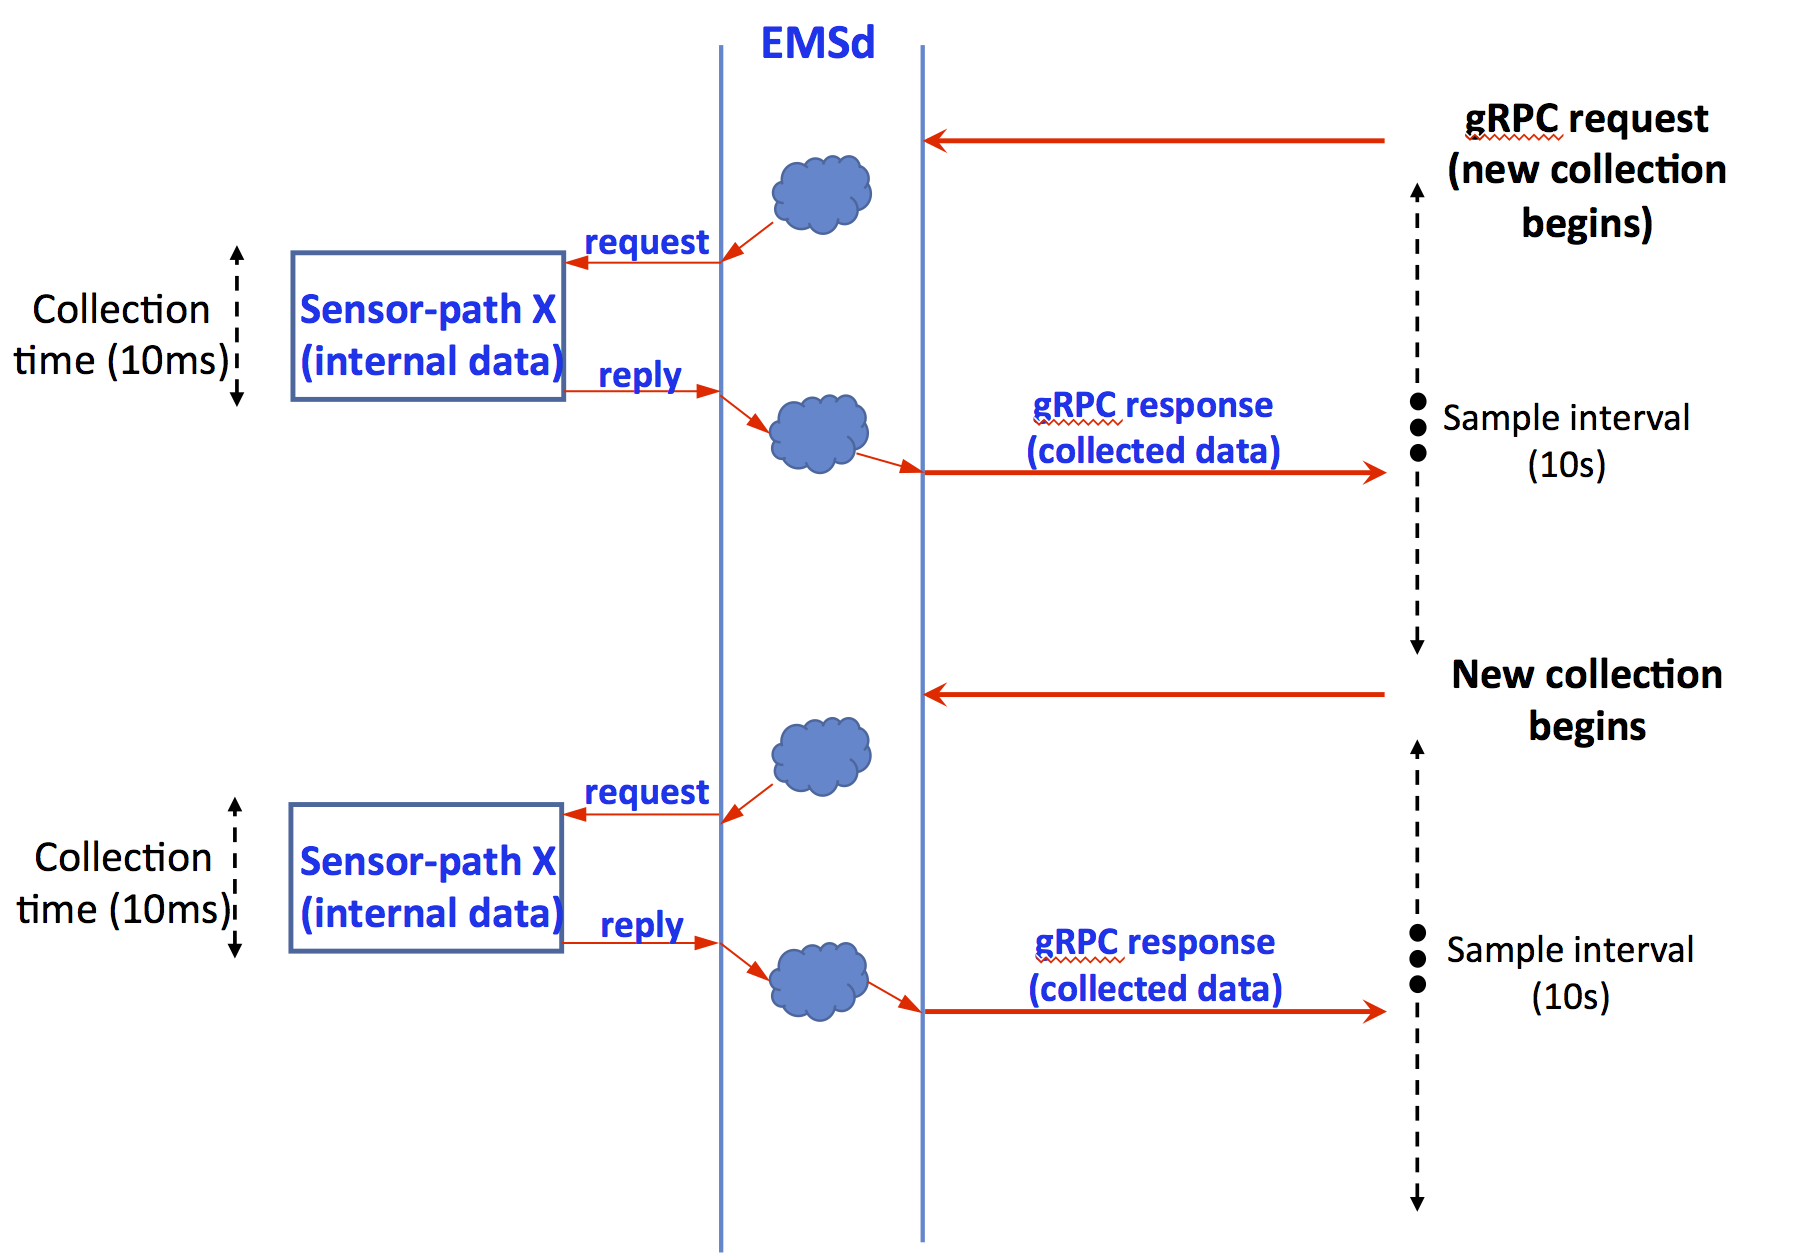
At the beginning of the session, our router will get a gRPC request message. The configured sample-interval timer starts and an internal MDT process (aka EMSd or Extensible Manageability Services) starts its operations. EMSd requests the information from an internal data source. The built-in efficiency of the IOS XR architecture means that collection time usually takes tens of milliseconds. After the collection is done, information is sent back to EMSd for fast encoding and transport.
For a better understanding, take a look into this schema:

As soon as a new sample interval starts, MDT sends a new request to the operational data storage and the system follows steps described above.
You can check collection time with the following show command (or in the Cisco-IOS-XR-telemetry-model-driven-oper.yang YANG model):
RP/0/RP0/CPU0:ios#sh telemetry model-driven subscription 1
Sat Jul 22 21:04:22.527 UTC
Subscription:  1
-------------
<<< skipped >>>

  Collection Groups:
  ------------------
    Id: 1
    Sample Interval:      5000 ms
    Encoding:             self-describing-gpb
    Num of collection:    6
    Collection time:      Min:    16 ms Max:    17 ms
    Total time:           Min:    16 ms Avg:    17 ms Max:    18 ms
    Total Deferred:       0
    Total Send Errors:    0
    Total Send Drops:     0
    Total Other Errors:   0
    Last Collection Start:2017-07-22 21:04:18.1396342587 +0000
    Last Collection End:  2017-07-22 21:04:18.1396360587 +0000
    Sensor Path:          Cisco-IOS-XR-infra-statsd-oper:infra-statistics/interfaces/interface/latest/generic-counters
In the output above, I’ve highlighted the Total time (collection + MDT encoding) and a sample interval values. This tells you how much time is needed to collect and encode all the data in a given sensor-path. Information is provided for each sensor-path you have configured.
A big “bag” of data
So far so good: we have a well-defined collection time; we have an optimized sample-interval. But what can go wrong?
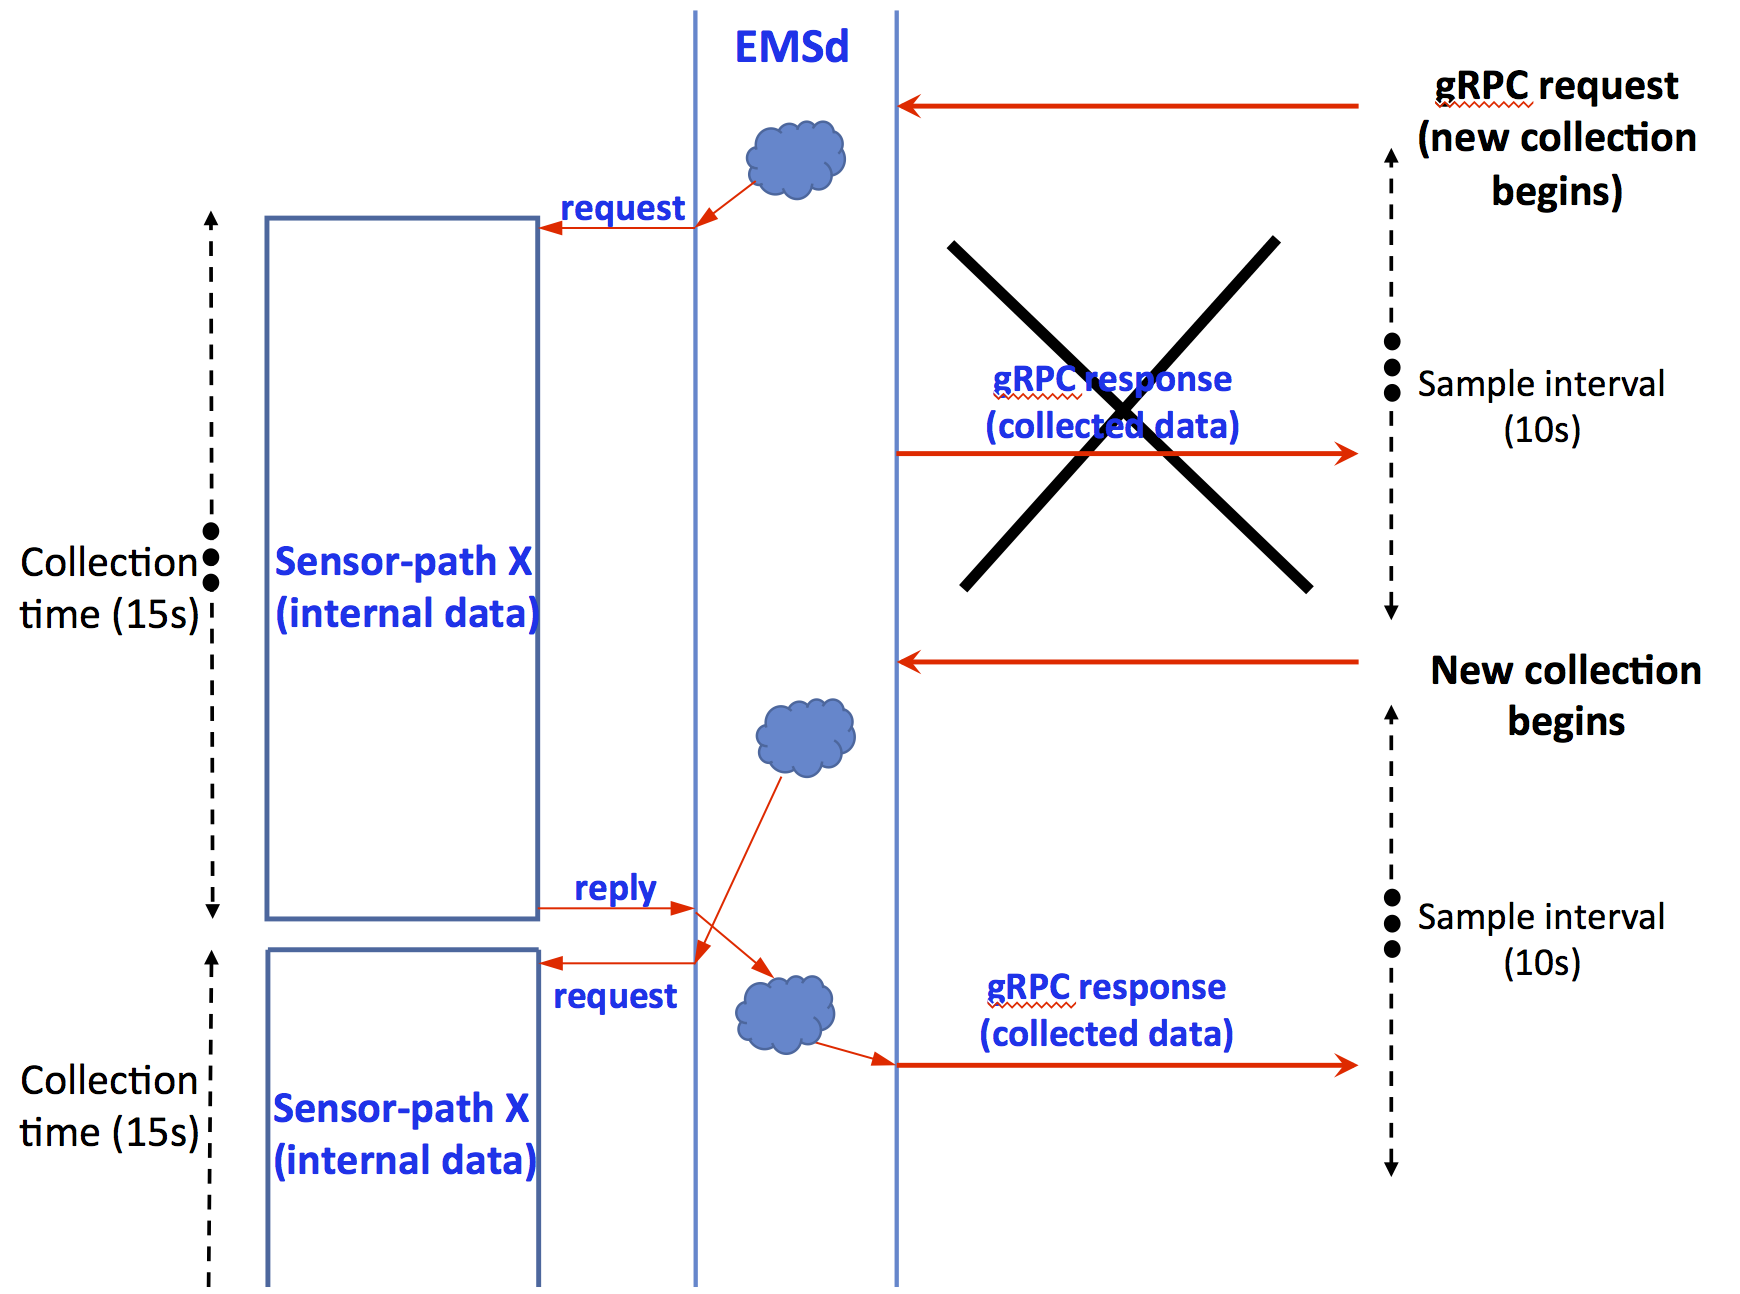
Imagine you have a system with a high number of routes, or with a big number of MPLS-TE tunnels, or a system with a big number of interfaces/sub-interfaces. Even with optimized collection processes, the amount of data is so big that it takes some time is needed to deliver it back to EMSd. Let’s have a look into the picture again:

The steps for the system are the same – we need an initial message request, we need to process information within EMSd, we need to send a request message for the internal data. But because of the amount of data, the collection time will take more than the configured sample-interval. In this case, IOS XR will continue to collect the original sample and send it as soon as it is complete (which may be after the next sample-interval has expired). Depending on the sample interval and collection time ratio, it could be even a window after the next sample and so on.
EMSd guarantees non-stop operation. So it will request a new sample of data from the storage as soon as it gets current collection back (as a new sample interval has already started).
Below is an example of such behavior from a system with a big number of interfaces (just for demo purposes):
RP/0/RP1/CPU0:ios#sh telemetry model-driven subscription 1
Sat Jul 22 14:30:29.775 UTC
Subscription:  1
-------------
<<< skipped >>>

  Collection Groups:
  ------------------
    Id: 7
    Sample Interval:      5000 ms
    Encoding:             self-describing-gpb
    Num of collection:    6
    Collection time:      Min:    13675 ms Max:    14030 ms
    Total time:           Min: 13806 ms Avg: 13940 ms Max: 14067 ms
    Total Deferred:       0
    Total Send Errors:    0
    Total Send Drops:     0
    Total Other Errors:   0
    No data Instances:    6
    Last Collection Start:2017-07-22 14:30:15.3522663588 +0000
    Last Collection End:  2017-07-22 14:30:29.3536676588 +0000
    Sensor Path:          Cisco-IOS-XR-infra-statsd-oper:infra-statistics/interfaces/interface/latest/data-rate
As you see from the outputs, the sample-interval is 5 seconds, but due to the big amount of data, total collection time takes around 14 seconds! That led to the worst-case scenario where several consecutive sample intervals were skipped.
A big and a small “bag”
The situation described above doesn’t look good. But is that the worst you can expect?
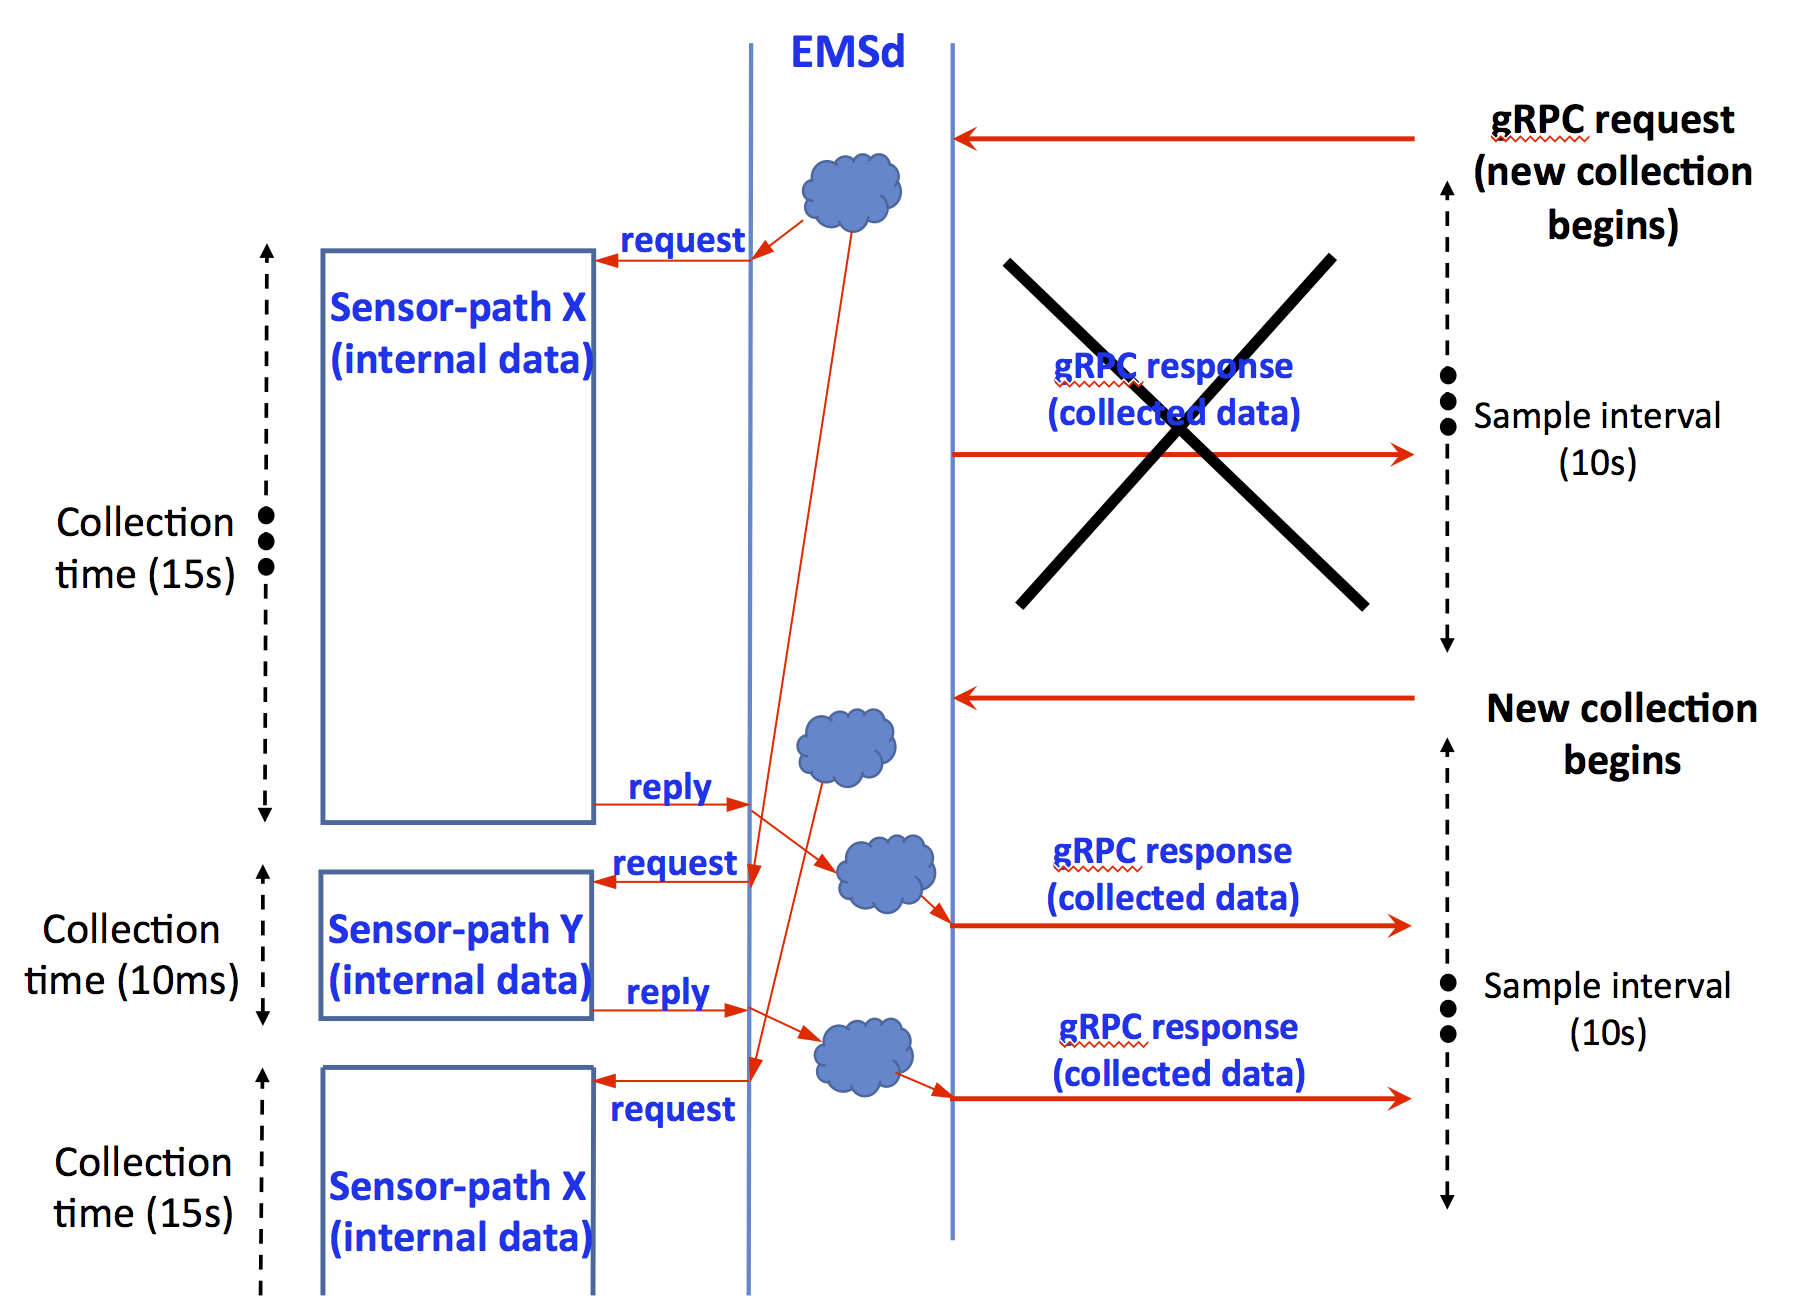
Let’s have a look at what might happen if you have multiple sensor-paths to collect and one sensor-path has a big “bag” of data and another one has a small “bag”:

We have the same story as before – a request is coming, after which our router needs to start processing and pushing out requested operational data. But we have two sensor-paths to be sent out this time. Let’s say that the collection starts with the biggest one. As before, it takes some long time, exceeding configured sample-interval. And all that time, our request for the second, smaller sensor-path has to sit and wait in the queue for the first collection to be finished. As the result, both collections are delayed and sent during one of the next sample-intervals, even if the second sensor-path collection needs just few milliseconds to be collected and sent out.
Here is a snapshot from a router with big number of interfaces:
RP/0/RP1/CPU0:ios#sh telemetry model-driven subscription 1
Sat Jul 22 14:57:23.911 UTC
Subscription:  1

<<< skipped >>>

  Collection Groups:
  ------------------
    Id: 9
    Sample Interval:      5000 ms
    Encoding:             self-describing-gpb
    Num of collection:    4
    Collection time:      Min:    13650 ms Max:    13707 ms
    Total time:           Min: 13840 ms Avg: 13894 ms Max: 13933 ms
    Total Deferred:       0
    Total Send Errors:    0
    Total Send Drops:     0
    Total Other Errors:   0
    No data Instances:    4
    Last Collection Start:2017-07-22 14:57:08.841218292 +0000
    Last Collection End:  2017-07-22 14:57:22.855108292 +0000
    Sensor Path:          Cisco-IOS-XR-infra-statsd-oper:infra-statistics/interfaces/interface/latest/data-rate

    Id: 10
    Sample Interval:      5000 ms
    Encoding:             self-describing-gpb
    Num of collection:    4
    Collection time:      Min:    10 ms Max:    14 ms
    Total time:           Min:    10 ms Avg:    12 ms Max:    14 ms
    Total Deferred:       0
    Total Send Errors:    0
    Total Send Drops:     0
    Total Other Errors:   0
    No data Instances:    0
    Last Collection Start:2017-07-22 14:57:22.855108292 +0000
    Last Collection End:  2017-07-22 14:57:22.855121292 +0000
    Sensor Path:          Cisco-IOS-XR-infra-statsd-oper:infra-statistics/interfaces/interface/latest/generic-counters
As you can see, our second path, which only requires around 12ms of collection time, was delayed by 19 seconds because it had to wait for the first path to complete.
Share the workload
IOS XR is a real time, modular software architecture based on processes that operate in separate address spaces with memory protection. Each process consists from a number of threads. EMSd is a process that represents core functionality of MDT within IOS XR. And it also contains a big number of different threads, which execute multiple tasks.
Starting in the 6.2.x release train, EMSd will deliver improved performance by creating a separate thread within its architecture to process each “subscription” within MDT configuration. In other words, this enhancement will let you interleave small “bag” sensor-paths with large bag sensor-paths. This means you will be able to send “fast” paths according to expected sample-intervals while giving “slow” paths its own processing.
Here is a picture of the enhanced functionality:

As soon as a sample-interval starts, a separate thread will be allocated for each “subscription” configured (or to each sensor-path in case you have just one path inside each “subscription” configuration). When a given thread has finished the collection for its paths, the data will be sent immediately. Larger, slower sensor paths will continue collecting and an update will be sent out to collector that collection is still in progress.
This is how it will look like on the tested router:
RP/0/RP1/CPU0:ios#sh telemetry model-driven subscription 1
Sat Jul 22 16:08:41.087 UTC
Subscription:  1
-------------

<<< skipped >>>

  Collection Groups:
  ------------------
    Id: 16
    Sample Interval:      5000 ms
    Encoding:             self-describing-gpb
    Num of collection:    1
    Collection time:      Min:    13931 ms Max:    13931 ms
    Total time:           Min: 14000 ms Avg: 14000 ms Max: 14000 ms
    Total Deferred:       0
    Total Send Errors:    0
    Total Send Drops:     0
    Total Other Errors:   0
    No data Instances:    1
    Last Collection Start:2017-07-22 16:08:23.821224996 +0000
    Last Collection End:  2017-07-22 16:08:37.835224996 +0000
    Sensor Path:          Cisco-IOS-XR-infra-statsd-oper:infra-statistics/interfaces/interface/latest/data-rate


RP/0/RP1/CPU0:ios#sh telemetry model-driven subscription 2
Sat Jul 22 16:08:42.777 UTC
Subscription:  2
-------------

<<< skipped >>>

  Collection Groups:
  ------------------
    Id: 17
    Sample Interval:      5000 ms
    Encoding:             self-describing-gpb
    Num of collection:    5
    Collection time:      Min:    13 ms Max:    16 ms
    Total time:           Min:    13 ms Avg:    14 ms Max:    16 ms
    Total Deferred:       0
    Total Send Errors:    0
    Total Send Drops:     0
    Total Other Errors:   0
    No data Instances:    0
    Last Collection Start:2017-07-22 16:08:42.839437996 +0000
    Last Collection End:  2017-07-22 16:08:42.839450996 +0000
    Sensor Path:          Cisco-IOS-XR-infra-statsd-oper:infra-statistics/interfaces/interface/latest/generic-counters
As you can see, the snapshots were taken almost at the same time, but the number of collections done by the second subscription is way ahead compared to the first one. This example demonstrates the behavior of multithreading processing of sensor paths.
It is also possible to see threads within a process with this “show” command:
RP/0/RP1/CPU0:ios#sh proc emsd
Sat Jul 22 16:11:19.938 UTC
                  Job Id: 1165
                     PID: 27830
            Process name: emsd

<<< skipped >>>

        Process cpu time: 3081.880 user, 1382.840 kernel, 4464.720 total
JID    TID  Stack  pri  state        NAME             rt_pri
1165   27830    0K  20   Sleeping     emsd             0
1165   27831    0K  20   Sleeping     lwm_debug_threa  0
1165   27832    0K  20   Sleeping     emsd             0

<<< skipped >>>

1165   9576    0K  20   Sleeping     emsd             0
1165   31769    0K  20   Sleeping     mdt_wkr_1        0
1165   16846    0K  20   Sleeping     mdt_wkr_2        0
------------------------------------------------------------------------------
“mdt_wkr_
Conclusion
Model-driven telemetry represents the future of high-speed export of operational data. Before 6.2.x releases, you can configure different sample-intervals for different sensor-paths, but as soon as you have a path with a large amount of data in a processing queue, everything else will have to wait until after that collection is finished. Starting from 6.2.x, IOS XR added threading support for MDT. With this capability, we recommend that you separate your sensor-paths into different subscriptions to increase productivity of the router and your ability to get rich amount of different operational data at scale.
Leave a Comment