
Sensor Paths for Segment Routing Traffic Engineering
SR-TE, Meet MDT
Recently, when I was building out a proof of concept in my lab for some new Segment Routing Traffic Engineering (SR-TE) use cases, I found myself wanting a quick way to check if all my policies were coming up and forwarding traffic. Model-Driven Telemetry (MDT) can get a lot of operational data off the network very quickly. The only tricky part is identifying the YANG model and container that has the best data for a given use case. So I wanted to share a couple of the SR-TE models that were useful for me.
SR-TE Policy Status
One high-level performance indicator for SR-TE is the operational state of the SR-TE policies on the headend. In CLI, a quick way to verify that is with this command:
RP/0/RP0/CPU0:iosxrv-1#show segment-routing traffic-eng policy summary
Sun Mar 31 22:55:35.164 UTC
XTC policy database summary:
----------------------------
IPv4 source address: 1.1.1.1
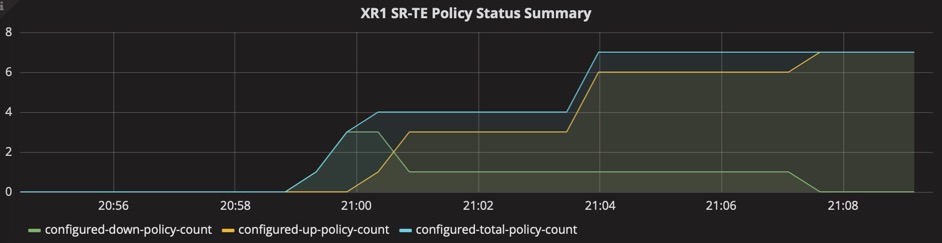
Total configured policies: 6
Operational: up 6 down 0
RP/0/RP0/CPU0:iosxrv-1#
In the output of this command, you can see that all six of the configured policies are up. This same data can be found in the XR Native YANG model Cisco-IOS-XR-infra-xtc-agent-oper.yang. That model can have a lot of data, so to narrow it down to just the policy summary data, specify your MDT sensor-path like this:
sensor-path Cisco-IOS-XR-infra-xtc-agent-oper:xtc/policy-summary
(For the complete configuration of MDT, see Configuring Model-Driven Telemetry ).
If you use pipeline to collect that data, you can easily direct the data to InfluxDB and display it with Grafana. Just add this entry to your metrics.json file in pipeline:
        {
                "basepath" : "Cisco-IOS-XR-infra-xtc-agent-oper:xtc/policy-summary",
                "spec" : {
                        "fields" : [
                                {"name" : "configured-total-policy-count"},
                                {"name" : "configured-down-policy-count"},
                                {"name" : "configured-up-policy-count"}
                        ]
                }
        }
The resulting graph in Grafana might look something like this as you configure and bring up SR-TE policies:
SR-TE Topology Summary
Another high-level indicator can be found in the SR-TE topology database statistics. In CLI, a quick way to verify that is with this command:
RP/0/RP0/CPU0:iosxrv-1#show segment-routing traffic-eng ipv4 topology summary
Sun Mar 31 23:24:38.880 UTC
XTC Agent's topology database summary:
--------------------------------
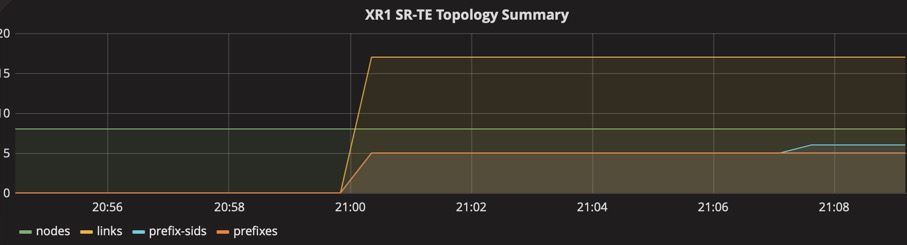
Topology nodes: 8
Prefixes: 6
Prefix SIDs: 11
Links: 20
Adjacency SIDs: 40
RP/0/RP0/CPU0:iosxrv-1#
This same data can be reported via MDT using this sensor-path:
sensor-path Cisco-IOS-XR-infra-xtc-agent-oper:xtc/topology-summary
Not surprisinging, the metrics.json entry for this sensor-path looks like this:
{
                "basepath" : "Cisco-IOS-XR-infra-xtc-agent-oper:xtc/topology-summary",
                "spec" : {
                        "fields" : [
                                {"name" : "links"},
                                {"name" : "nodes"},
                                {"name" : "prefix-sids"},
                                {"name" : "adjacency-sids"},
                                {"name" : "prefixes"}
                        ]
                }
        }
Here is the resulting graph when I brought up my 8-node lab topology:
SR-TE Policy Traffic
The proof in the SR-TE pudding is whether or not traffic is actually getting forwarded by that policy. I explored several different YANG models for this, but the best one ended up being one of the most common MDT sensor-paths – good old interface statistics!
The sensor-path for interface statistics is as follows:
sensor-path Cisco-IOS-XR-infra-statsd-oper:infra-statistics/interfaces/interface/latest/generic-counters
No need to modify the metrics.json file for this one: it’s included in the default metrics.json file in pipeline.
The “interface” to monitor in this case is actually the name of the SR-TE policy. The name is a combination of the policy’s color and tailend, e.g. “srte_c_10_ep_1.1.1.6” is the index name for the policy with Color 10, Tailend 1.1.1.6.
The following graph shows traffic starting to flow through seven SR-TE policies:
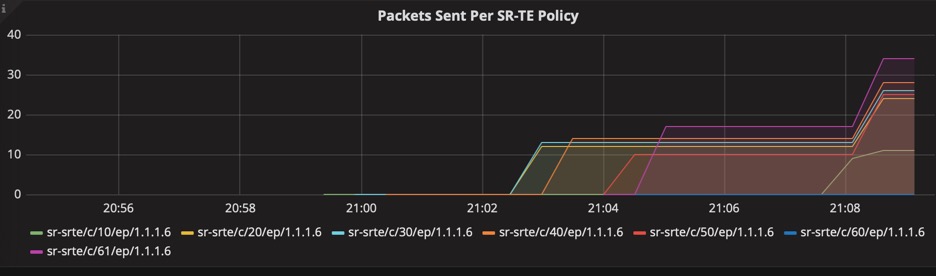
To display only the SR-TE policy interfaces, structure your Query in Grafana like this:
"SELECT \"packets-sent\" FROM \"Cisco-IOS-XR-infra-statsd-oper:infra-statistics/interfaces/interface/latest/generic-counters\" WHERE (\"interface-name\" =~ /sr-srte/ ) AND $timeFilter GROUP BY \"interface-name\""
Traffic Collector and SR Traffic-Matrix (SR-TM)
Interested in the traffic patterns on your network? SR-TM tracks the aggregated flows that enter and leave the network. The Traffic Collector process collects and stores histories of packet and bytes statistics for prefixes, tunnel counters and the Traffic-Matrix counters.
The sensor-path for Traffic-Collector is as follows:
sensor-path Cisco-IOS-XR-infra-tc-oper:traffic-collector/afs/af/counters/tunnels/tunnel
If you’re using pipeline, add this to your metrics.json:
{
  "basepath" : "Cisco-IOS-XR-infra-tc-oper:traffic-collector/afs/af/counters/tunnels/tunnel",
  "spec" : {
    "fields" : [
      {"name":"interface-name", "tag": true},
      {"name":"is-active"},
      {"name":"interface-name-xr"},
      {"name":"base-counter-statistics",
        "fields" : [
          {"name":"count-history",
            "fields" : [
              {"name":"transmit-number-of-bytes-switched"},
              {"name":"transmit-number-of-packets-switched"},
              {"name":"event-end-timestamp"},
              {"name":"event-start-timestamp"}
              ]
          },
          {"name":"transmit-packets-per-second-switched"},
          {"name":"transmit-bytes-per-second-switched"}
        ]
      }
    ]
  }
}
Thanks to my colleague, @StLitkowski, for working this one out.
Just the Beginning
These four sensor-paths should get you started with high-level monitoring of SR-TE. But it’s really just the beginning. Once you start exploring, you’ll quickly realize that IOS XR has an astonishing amount of SR-TE data available in YANG models and streamable via MDT.
Leave a Comment