
Let’s get started with SRv6 Telemetry
Introduction
In this article, let’s look at some of the data that I found interesting to stream using Model-Driven Telemetry at the beginning of my SRv6 journey.
Leveraging Streaming Telemetry for SRv6
The networks of today widely differs between the domains. The end-to-end provisioning is lengthy & complex because of different management teams, manual operations, and heterogeneous underlay/overlay networks. That’s why Segment Routing v6 has been introduced, to provide a scalable, simple, and unified technology for the transport, services and programmability across the Datacenter, Core and Metro domains. It is fully standardized, it solves many design and scalability issues.
For a customer training, I had to migrate my lab from SR-MPLS to SRv6 uSID architecture. Thanks to Model-Driven Telemetry and the vastness of IOS-XR operational data models, following concerns can be adressed:
Provides real-time visibility about SRv6 usage
SRv6 YANG models are ready to use for data collection. It allows us to collect SRv6 statistics about our network. Further details will be provided later in this article.
Successful migration
In general, one of the most crucial tasks before and after a migration is to do “pre/post sanity checks”. This means collecting all the necessary and relevant KPIs by executing show commands on all the devices.
Our use case involves transitioning from SR-MPLS to SRv6. It is a major mind shift and it relates to the transport network. This is not a routine task, but a critical one that demands a certain level of trust. Telemetry can make things easier, by collecting and streaming the necessary data to improve its usability over time.
The following KPIs can be gathered:
- ISISv4/v6 neighbors
- ISISv4/v6 routes
- BGP VPNv4/v6 sessions
- L2VPN stats
- Hardware stats
- Interface traffic
Accurate network planning
Capacity planning can be a challenging task. One way to achieve this is by tracking statistics for your devices over several months or years. Telemetry can also help to be proactive in identifying scale issues that may have a business impact.
Better understanding of hardware resources mapping
Determining the Network Processor resources utilization for a service or the number of entries consumed during the setup of a L3VPN service can be difficult. Getting visibility at hardware level is critical to better handle scale constraints.
YANG data modeling
Reading a YANG model from a .yang file is quite complex. There is an alternative to this which is pyang. pyang is a python program which can be used for 3 different use cases:
- YANG module validation
- YANG module transformation into other formats (XML, JSON)
- YANG module visualization (tree view)
The models that will be used in this article are:
- Cisco-IOS-XR-segment-routing-srv6-oper.yang
- Cisco-IOS-XR-NCS-BDplatforms-npu-resources-oper.yang
- Cisco-IOS-XR-8000-platforms-npu-resources-oper.yang
- Cisco-IOS-XR-infra-xtc-agent-oper.yang
Running the pyang command as shown below will allow you to view the tree format model:
pyang Cisco-IOS-XR-segment-routing-srv6-oper.yang -f tree --tree-path srv6/active/manager/sid-mgr-summary
module: Cisco-IOS-XR-segment-routing-srv6-oper
  +--ro srv6
     +--ro active
        +--ro manager
           +--ro sid-mgr-summary
              +--ro sids-out-of-resource-summary
              |  +--ro identifer-name?                  string
              |  +--ro oor-state?                       Srv6-out-of-resource-state
              |  +--ro oor-maximum-sid-count?           uint32
              |  +--ro oor-current-free-sid-count?      uint32
              |  +--ro oor-yellow-free-sid-thsreshold?   uint32
              |  +--ro oor-green-free-sid-threshold?    uint32
              |  +--ro oor-green-count?                 uint32
              |  +--ro oor-yellow-count?                uint32
              |  +--ro oor-red-count?                   uint32
              +--ro locators-count?                 uint16
              +--ro oper-locators-count?            uint16
              +--ro sids-count?                     uint32
              +--ro stale-sids-count?               uint32
              +--ro maximum-sids-count?             uint32
              +--ro block-local-sid-oor-summary* []
                 +--ro identifer-name?                  string
                 +--ro oor-state?                       Srv6-out-of-resource-state
                 +--ro oor-maximum-sid-count?           uint32
                 +--ro oor-current-free-sid-count?      uint32
                 +--ro oor-yellow-free-sid-threshold?   uint32
                 +--ro oor-green-free-sid-threshold?    uint32
                 +--ro oor-green-count?                 uint32
                 +--ro oor-yellow-count?                uint32
                 +--ro oor-red-count?                   uint32
Verifying the streamed data
The configuration of the TIG stack (Telegraf, InfluxDB, Grafana) won’t be covered here, as several tutorials already addressed it on xrdocs. However, we will inspect the data that is being transmitted to the Telegraf collector.
Info: Before executing the command, it is necessary to have MDT process running.
By running in exec-mode the command mdt_exec, you will be able to see the data pushed from your router: run mdt_exec -s sensor-path
This is a sample output for Cisco-IOS-XR-segment-routing-srv6-oper:srv6/active/manager path:
RP/0/RP0/CPU0:NCS5501-SE-1#run mdt_exec -s Cisco-IOS-XR-segment-routing-srv6-oper:srv6/active/manager
Tue Aug 15 18:51:29.740 CEST
Enter any key to exit...
 Sub_id 200000001, flag 0, len 0
 Sub_id 200000001, flag 4, len 5209
--------
{
  "node_id_str": "NCS5501-SE-1",
  "subscription_id_str": "app_TEST_200000001",
  "encoding_path": "Cisco-IOS-XR-segment-routing-srv6-oper:srv6/active/manager",
  "collection_id": "548867",
  "collection_start_time": "1692118289852",
  "msg_timestamp": "1692118289854",
  "data_json": [
    {
      "timestamp": "1692118289853",
      "keys": [],
      "content": {
        "sid-mgr-params": {
          "srv6-enabled": true,
          "configured-encap-source-address": "fccc:0:211::1",
          "default-encap-source-address": "fccc:0:211::1",
          "encap-hop-limit": {
            "use-default": true,
            "do-propagate": false,
            "value": 0
          },
          "encap-traffic-class": {
            "use-default": true,
            "do-propagate": false,
            "value": 0
          },
          "is-sid-holdtime-configured": false,
          "sid-holdtime-mins-configured": 0,
          "srv6-operational-mode": [
            {
              "srv6-operational-mode": {
                "type": "srv6-base",
                "description": "Base"
              },
              "srv6-operational-mode-enabled": false
            },
            {
              "srv6-operational-mode": {
                "type": "srv6-micro-segment",
                "description": "Micro-segment"
              },
              "srv6-operational-mode-enabled": true
            }
          ],
          "sid-formats-info": [
            {
              "format": {
                "type": "f3216",
                "description": "f3216"
              },
              "usidlib-ranges": {
                "lib-start": 57344,
                "elib-start": 65024,
                "configured": false
              },
              "usidwlib-ranges": {
                "ewlib-start": 65527,
                "configured": false
              }
            }
          ]
        },
        "sid-mgr-summary": {
          "locators-count": 5,
          "oper-locators-count": 5,
          "sids-count": 18,
          "stale-sids-count": 0,
          "maximum-sids-count": 8176,
          "sids-out-of-resource-summary": {
            "identifer-name": "Global",
            "oor-state": "oor-green",
            "oor-maximum-sid-count": 8176,
            "oor-current-free-sid-count": 8158,
            "oor-yellow-free-sid-threshold": 246,
            "oor-green-free-sid-threshold": 409,
            "oor-green-count": 0,
            "oor-yellow-count": 0,
            "oor-red-count": 0
          },
          "block-local-sid-oor-summary": [
            {
              "identifer-name": "Block fccc::/32",
              "oor-state": "oor-green",
              "oor-maximum-sid-count": 7680,
              "oor-current-free-sid-count": 7676,
              "oor-yellow-free-sid-threshold": 231,
              "oor-green-free-sid-threshold": 384,
              "oor-green-count": 0,
              "oor-yellow-count": 0,
              "oor-red-count": 0
            },
            {
              "identifer-name": "Block fccc:1::/32",
              "oor-state": "oor-green",
              "oor-maximum-sid-count": 7680,
              "oor-current-free-sid-count": 7672,
              "oor-yellow-free-sid-threshold": 231,
              "oor-green-free-sid-threshold": 384,
              "oor-green-count": 0,
              "oor-yellow-count": 0,
              "oor-red-count": 0
            },
            {
              "identifer-name": "Block fccc:2::/32",
              "oor-state": "oor-green",
              "oor-maximum-sid-count": 7680,
              "oor-current-free-sid-count": 7674,
              "oor-yellow-free-sid-threshold": 231,
              "oor-green-free-sid-threshold": 384,
              "oor-green-count": 0,
              "oor-yellow-count": 0,
              "oor-red-count": 0
            },
            {
              "identifer-name": "Block fccc:3::/32",
              "oor-state": "oor-green",
              "oor-maximum-sid-count": 7680,
              "oor-current-free-sid-count": 7680,
              "oor-yellow-free-sid-threshold": 231,
              "oor-green-free-sid-threshold": 384,
              "oor-green-count": 0,
              "oor-yellow-count": 0,
              "oor-red-count": 0
            },
            {
              "identifer-name": "Block fccc:4::/32",
              "oor-state": "oor-green",
              "oor-maximum-sid-count": 7680,
              "oor-current-free-sid-count": 7680,
              "oor-yellow-free-sid-threshold": 231,
              "oor-green-free-sid-threshold": 384,
              "oor-green-count": 0,
              "oor-yellow-count": 0,
              "oor-red-count": 0
            },
            {
              "identifer-name": "Block fccc:ff::/32",
              "oor-state": "oor-green",
              "oor-maximum-sid-count": 7680,
              "oor-current-free-sid-count": 7680,
              "oor-yellow-free-sid-threshold": 231,
              "oor-green-free-sid-threshold": 384,
              "oor-green-count": 0,
              "oor-yellow-count": 0,
              "oor-red-count": 0
            }
          ]
        },
        "platform-capabilities": {
          "cfg-support": {
            "encap-sa": true,
            "encap-hop-limit-value": true,
            "encap-hop-limit-propagate": false,
            "encap-traffic-class-value": false,
            "encap-traffic-class-propagate": false,
            "lib-range": true,
            "wlib-range": false
          },
          "support": {
            "srv6": true,
            "tilfa": true,
            "microloop-avoidance": true,
            "endpoint-behavior": [
              {
                "string": "End.DX6"
              },
              {
                "string": "End.DX4"
              },
              {
                "string": "End.DT6"
              },
              {
                "string": "End.DT4"
              },
              {
                "string": "End.DX2"
              },
              {
                "string": "End.DT2U"
              },
              {
                "string": "End.DT2M"
              },
              {
                "string": "End (PSP/USD)"
              },
              {
                "string": "End.X (PSP/USD)"
              },
              {
                "string": "uN (PSP/USD)"
              },
              {
                "string": "uA (PSP/USD)"
              },
              {
                "string": "uDT6"
              },
              {
                "string": "uDT4"
              },
              {
                "string": "uDX2"
              },
              {
                "string": "uDT2U"
              },
              {
                "string": "uDT2M"
              },
              {
                "string": "uB6 (Insert.Red)"
              }
            ],
            "headend-behavior": [
              {
                "string": "T"
              },
              {
                "string": "H.Insert.Red"
              },
              {
                "string": "H.Encaps.Red"
              },
              {
                "string": "H.Encaps.L2.Red"
              }
            ],
            "security-rule": [
              {
                "string": "SEC-1"
              },
              {
                "string": "SEC-2"
              },
              {
                "string": "SEC-3"
              }
            ],
            "counter": [
              {
                "string": "CNT-3"
              }
            ],
            "signaled-parameters": {
              "max-sl": 3,
              "max-end-pop-srh": 3,
              "max-h-insert": 2,
              "max-h-encap": 2,
              "max-end-d": 3
            },
            "endpoint-entries": {
              "local-only": true,
              "global-local-combo": true,
              "separate-shift-and-non-shift": true,
              "shift-only-drop": false
            }
          },
          "max-sids": 8176,
          "sid-holdtime-mins": 3,
          "encap-hop-limit-default": {
            "do-propagate": false,
            "value": 0
          },
          "encap-traffic-class-default": {
            "do-propagate": false,
            "value": 0
          },
          "max-locators": 16,
          "sid-resource-usage": [
            {
              "endpoint-behavior": "End.DX6",
              "value": 1
            },
            {
              "endpoint-behavior": "End.DX4",
              "value": 1
            },
            {
              "endpoint-behavior": "End.DT6",
              "value": 1
            },
            {
              "endpoint-behavior": "End.DT4",
              "value": 1
            },
            {
              "endpoint-behavior": "End.DX2",
              "value": 1
            },
            {
              "endpoint-behavior": "End.DT2U",
              "value": 1
            },
            {
              "endpoint-behavior": "End.DT2M",
              "value": 1
            },
            {
              "endpoint-behavior": "End (PSP/USD)",
              "value": 1
            },
            {
              "endpoint-behavior": "End.X (PSP/USD)",
              "value": 1
            },
            {
              "endpoint-behavior": "uN (PSP/USD)",
              "value": 1
            },
            {
              "endpoint-behavior": "uA (PSP/USD)",
              "value": 1
            },
            {
              "endpoint-behavior": "uDT6",
              "value": 1
            },
            {
              "endpoint-behavior": "uDT4",
              "value": 1
            },
            {
              "endpoint-behavior": "uDX2",
              "value": 1
            },
            {
              "endpoint-behavior": "uDT2U",
              "value": 1
            },
            {
              "endpoint-behavior": "uDT2M",
              "value": 1
            },
            {
              "endpoint-behavior": "uB6 (Insert.Red)",
              "value": 1
            }
          ]
        }
      }
    }
  ],
  "collection_end_time": "1692118289854"
}
The output is in JSON format. For having a human-readable format, I suggest using a JSON formatter such Code Beautify
SRv6 data
In this part, we will explore the resources that were useful for me to be monitored as part of my SRv6 lab.
SRv6 Manager
The overall SRv6 state from SRv6 Manager point of view is given by the CLI command show segment-routing srv6 manager.
RP/0/RP0/CPU0:NCS5501-SE-1#sh segment-routing srv6 manager
Tue Aug 15 18:50:37.816 CEST
Parameters:
  SRv6 Enabled: Yes
  SRv6 Operational Mode:
    Micro-segment:
      SID Base Block: fccc::/24
  Encapsulation:
    Source Address:
      Configured: fccc:0:211::1
      Default: fccc:0:211::1
    Hop-Limit: Default
    Traffic-class: Default
  SID Formats:
    f3216 32B/16NFA (2)
      uSID LIB Range:
        LIB Start   : 0xe000
        ELIB Start  : 0xfe00
      uSID WLIB Range:
        EWLIB Start : 0xfff7
Summary:
  Number of Locators: 5 (5 operational)
  Number of SIDs: 18 (0 stale)
  Max SID resources: 8176
  Number of free SID resources: 8158
  OOR:
    Thresholds (resources): Green 409, Warning 246
    Status: Resource Available
        History: (0 cleared, 0 warnings, 0 full)
- output omitted -
There is a clear similarity between the output of the command and the YANG model mentioned above. For getting summary information about the SRv6 state such as number of SIDs, I used the following sensor-paths:
Cisco-IOS-XR-segment-routing-srv6-oper:srv6/active/manager/sid_mgr_summary/sids_out_of_resource_summary/oor_current_free_sid_count
Cisco-IOS-XR-segment-routing-srv6-oper:srv6/active/manager/sid_mgr_summary/sids_count
The graphs below shows the active SIDs in my lab: 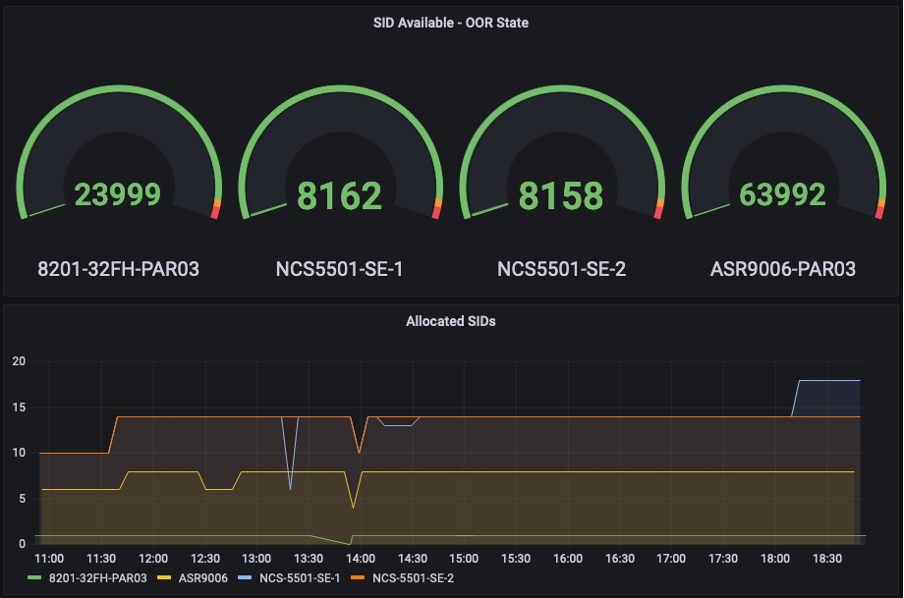
Locators
The SRv6 locator is used to identify a node and its specific services. The CLI command is show segment-routing srv6 locator.
The sensor paths are:
Cisco-IOS-XR-segment-routing-srv6-oper:srv6/active/locators/locator/info/interface/programmed_prefix
Cisco-IOS-XR-segment-routing-srv6-oper:srv6/active/manager/sid_mgr_summary/locators_count
Cisco-IOS-XR-segment-routing-srv6-oper:srv6/active/manager/sid_mgr_summary/oper_locators_count
SID
The CLI command is show segment-routing srv6 sid. To collect Active SIDs and their different behaviors, use following sensor paths:
Cisco-IOS-XR-segment-routing-srv6-oper:srv6/active/locator-all-sids/locator-all-sid/sid_behavior/description
Cisco-IOS-XR-segment-routing-srv6-oper:srv6/active/locator-all-sids/locator-all-sid/sid
SRv6 Traffic Engineering
Shelly wrote an article about the sensor-paths for SR-TE: -to complete-. The sensor paths mentioned in her article are the same for SRv6-TE.
A quick example would be to use this sensor-path: Cisco-IOS-XR-infra-xtc-agent-oper:xtc/policy-summary
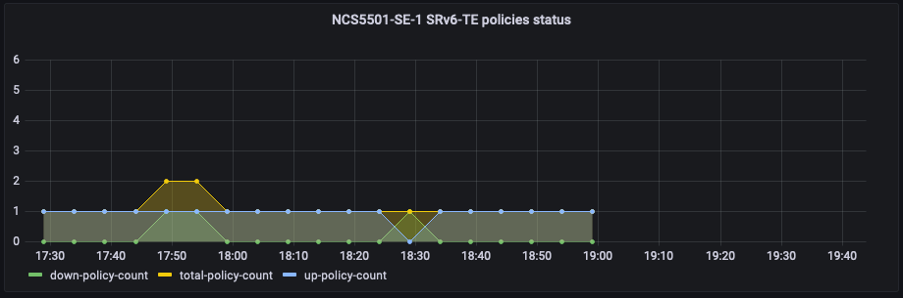
We can see with the graph above the SRv6-TE policy is now enabled.
Hardware data
This section will cover Network Processor (NP) SRv6 resources utilization. It will leverage different sensor-paths which are Platform Dependent.
NCS 5500/5700
Note: The sensor paths mentioned in this section can also be used for NCS 500 series.
A dedicated article written by Deepak covers this topic in details: - insert link-
The following Network Processor counters were considered:
| Network Processor Database | Purpose |
|---|---|
| LPM | IPv4/v6 prefixes |
| LEM | IPv4 /32 host prefixes, MAC adresses |
| Encap | SRv6 remote uSIDs |
| FEC | Prefix/label/SID lookup can point to a FEC entry |
| ECMP-FEC | SRv6 Multipath/ECMP entries pointing to a list of FEC array |
Note: This table applies to Jericho/Jericho+ ASICs. Jericho2 databases might differ.
Use the CLI command show controllers npu resources X location 0/N/CPU0, where X corresponds to the database and N to the line card location (use RP0 for fixed systems).
The sensor path used to collect hardware statistics is:
Cisco-IOS-XR-platforms-ofa-oper:ofa/stats/nodes/node/Cisco-IOS-XR-NCS-BDplatforms-npu-resources-oper:hw-resources-datas/hw-resources-data
There are variations visible in our subsequent graphs:
Cisco 8000
Info: SRv6 is supported on Cisco 8000 powered by Silicon One Q200 ASICs.
The following Network Processor counters were considered:
Use the CLI command show controllers npu resources X location 0/N/CPU0, where X corresponds to the database and N to the line card location (use RP0 for fixed systems).
The sensor path used to collect hardware statistics is:
Cisco-IOS-XR-platforms-ofa-oper:ofa/stats/nodes/node/Cisco-IOS-XR-8000-platforms-npu-resources-oper:hw-resources-datas/hw-resources-data
Below, we can see the current hardware statistics of the NP mentioned earlier:
Conclusion
This article started with few sensor paths which are specific to SRv6. It then covered counters and databases utilization which are platform dependent. Overall, using telemetry was very helpful during my SRv6 journey. IOS XR native models gives the ability to monitor a huge amount of data. Stay tuned for more telemetry content on SRv6!
Leave a Comment