
Telemetry Stack Update: QOS interface statistics example
Introduction
While telemetry has gained more popularity in the last few years, we still see a lot of customers that are hesitant to start using it. Telemetry is still seen for many as a black box.
There are already many great articles that cover the concepts and basics of telemetry. It gives great examples of what can be done and why telemetry should be used; I suggest that you have a look at them. However, many times people struggle when they start building their telemetry stack and it is not as easy as we may think.
This article is intended to share an up-to-date telemetry stack that can easily be spawn using Docker, it provides configuration example for both dial-in and dial-out streaming methods and shares a few tips and tricks to work with telemetry models and collectors.
All configuration files presented can be found on the Github repository
Context
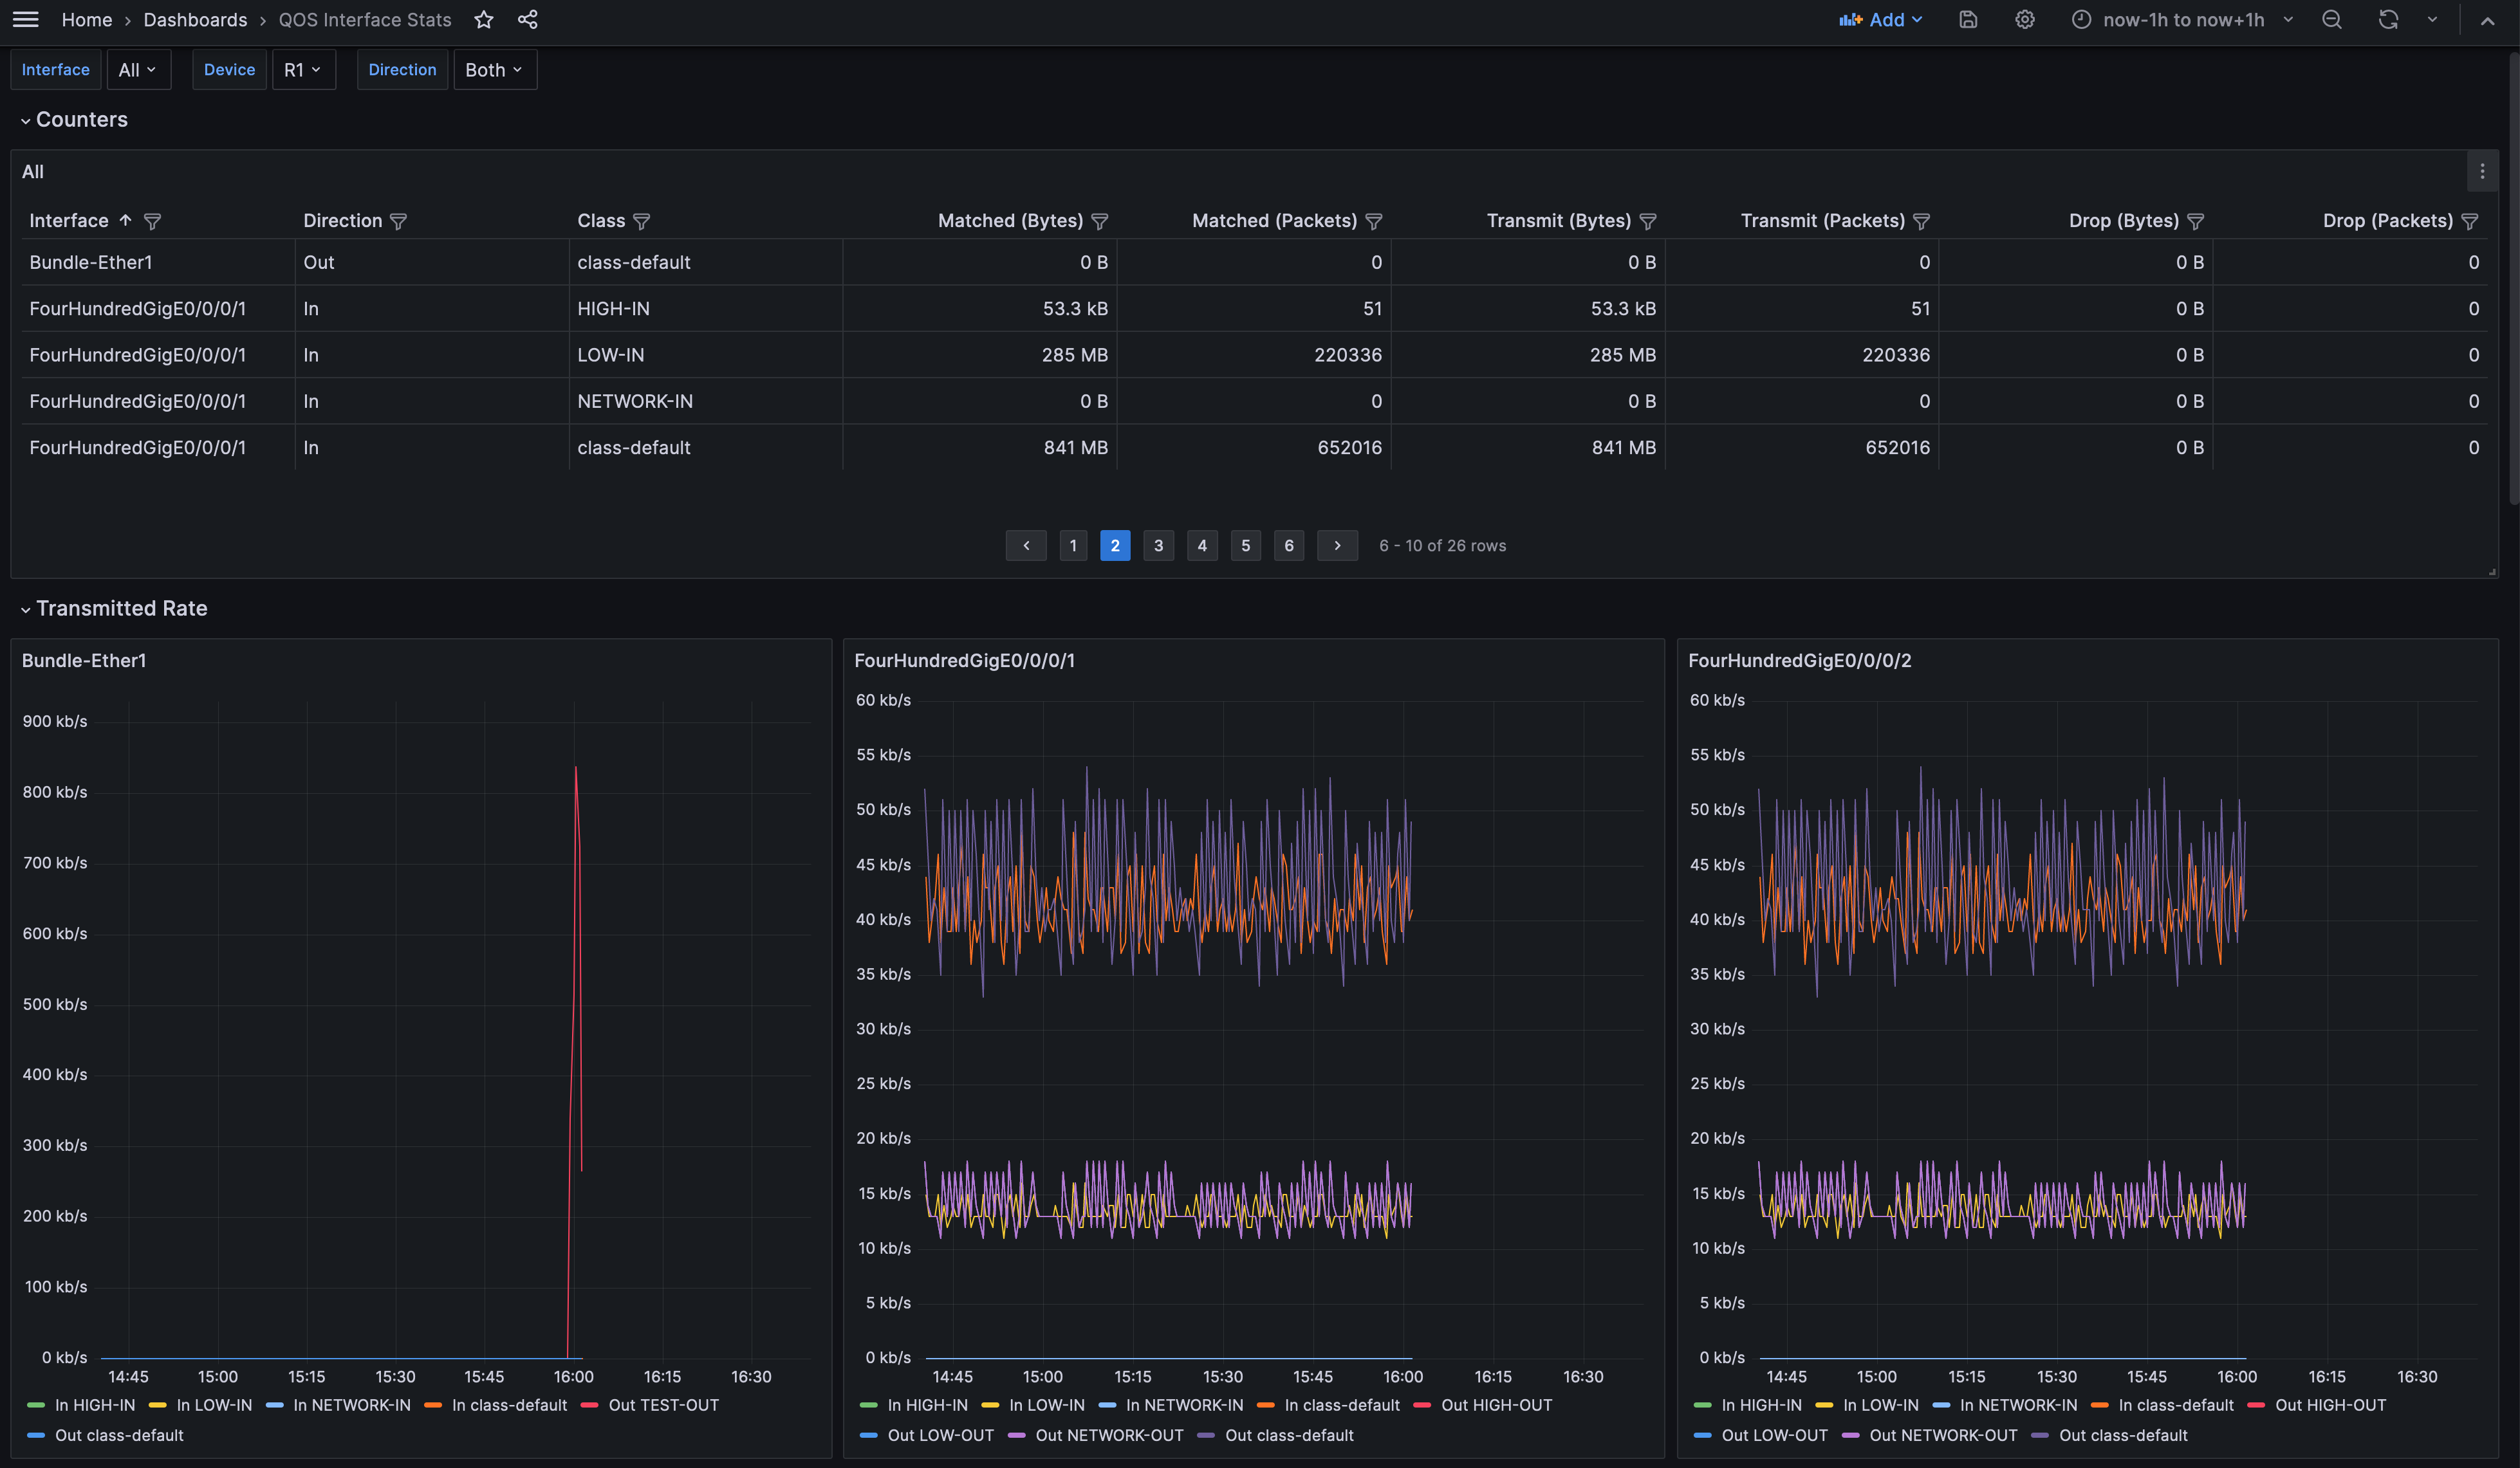
QOS Interface Statistics
Collecting QOS interface statistics is a recurring demand of our customers. Knowing the bandwidth utilization of an interface is often not enough and having the distribution of traffic among QOS classes gives a better view of the traffic profile.
In this article, graphs based of the following CLI will be created:
RP/0/RP0/CPU0:R1#show policy-map interface FourHundredGigE 0/0/0/1
Thu Aug 10 13:07:06.245 UTC

FourHundredGigE0/0/0/1 input: CORE-IN

Class NETWORK-IN
  Classification statistics          (packets/bytes)     (rate - kbps)
    Matched             :                   0/0                    0
    Transmitted         :                   0/0                    0
    Total Dropped       :                   0/0                    0
Class HIGH-IN
  Classification statistics          (packets/bytes)     (rate - kbps)
    Matched             :                  51/53346                0
    Transmitted         :                  51/53346                0
    Total Dropped       :                   0/0                    0
Class LOW-IN
  Classification statistics          (packets/bytes)     (rate - kbps)
    Matched             :             2519428/3250686120           13
    Transmitted         :             2519428/3250686120           13
    Total Dropped       :                   0/0                    0
Class class-default
  Classification statistics          (packets/bytes)     (rate - kbps)
    Matched             :             7549278/9738561264           41
    Transmitted         :             7549278/9738561264           41
    Total Dropped       :                   0/0                    0
Policy Bag Stats time: 1691672774954  [Local Time: 08/10/23 13:06:14.954]

<Output truncated>
YANG Models
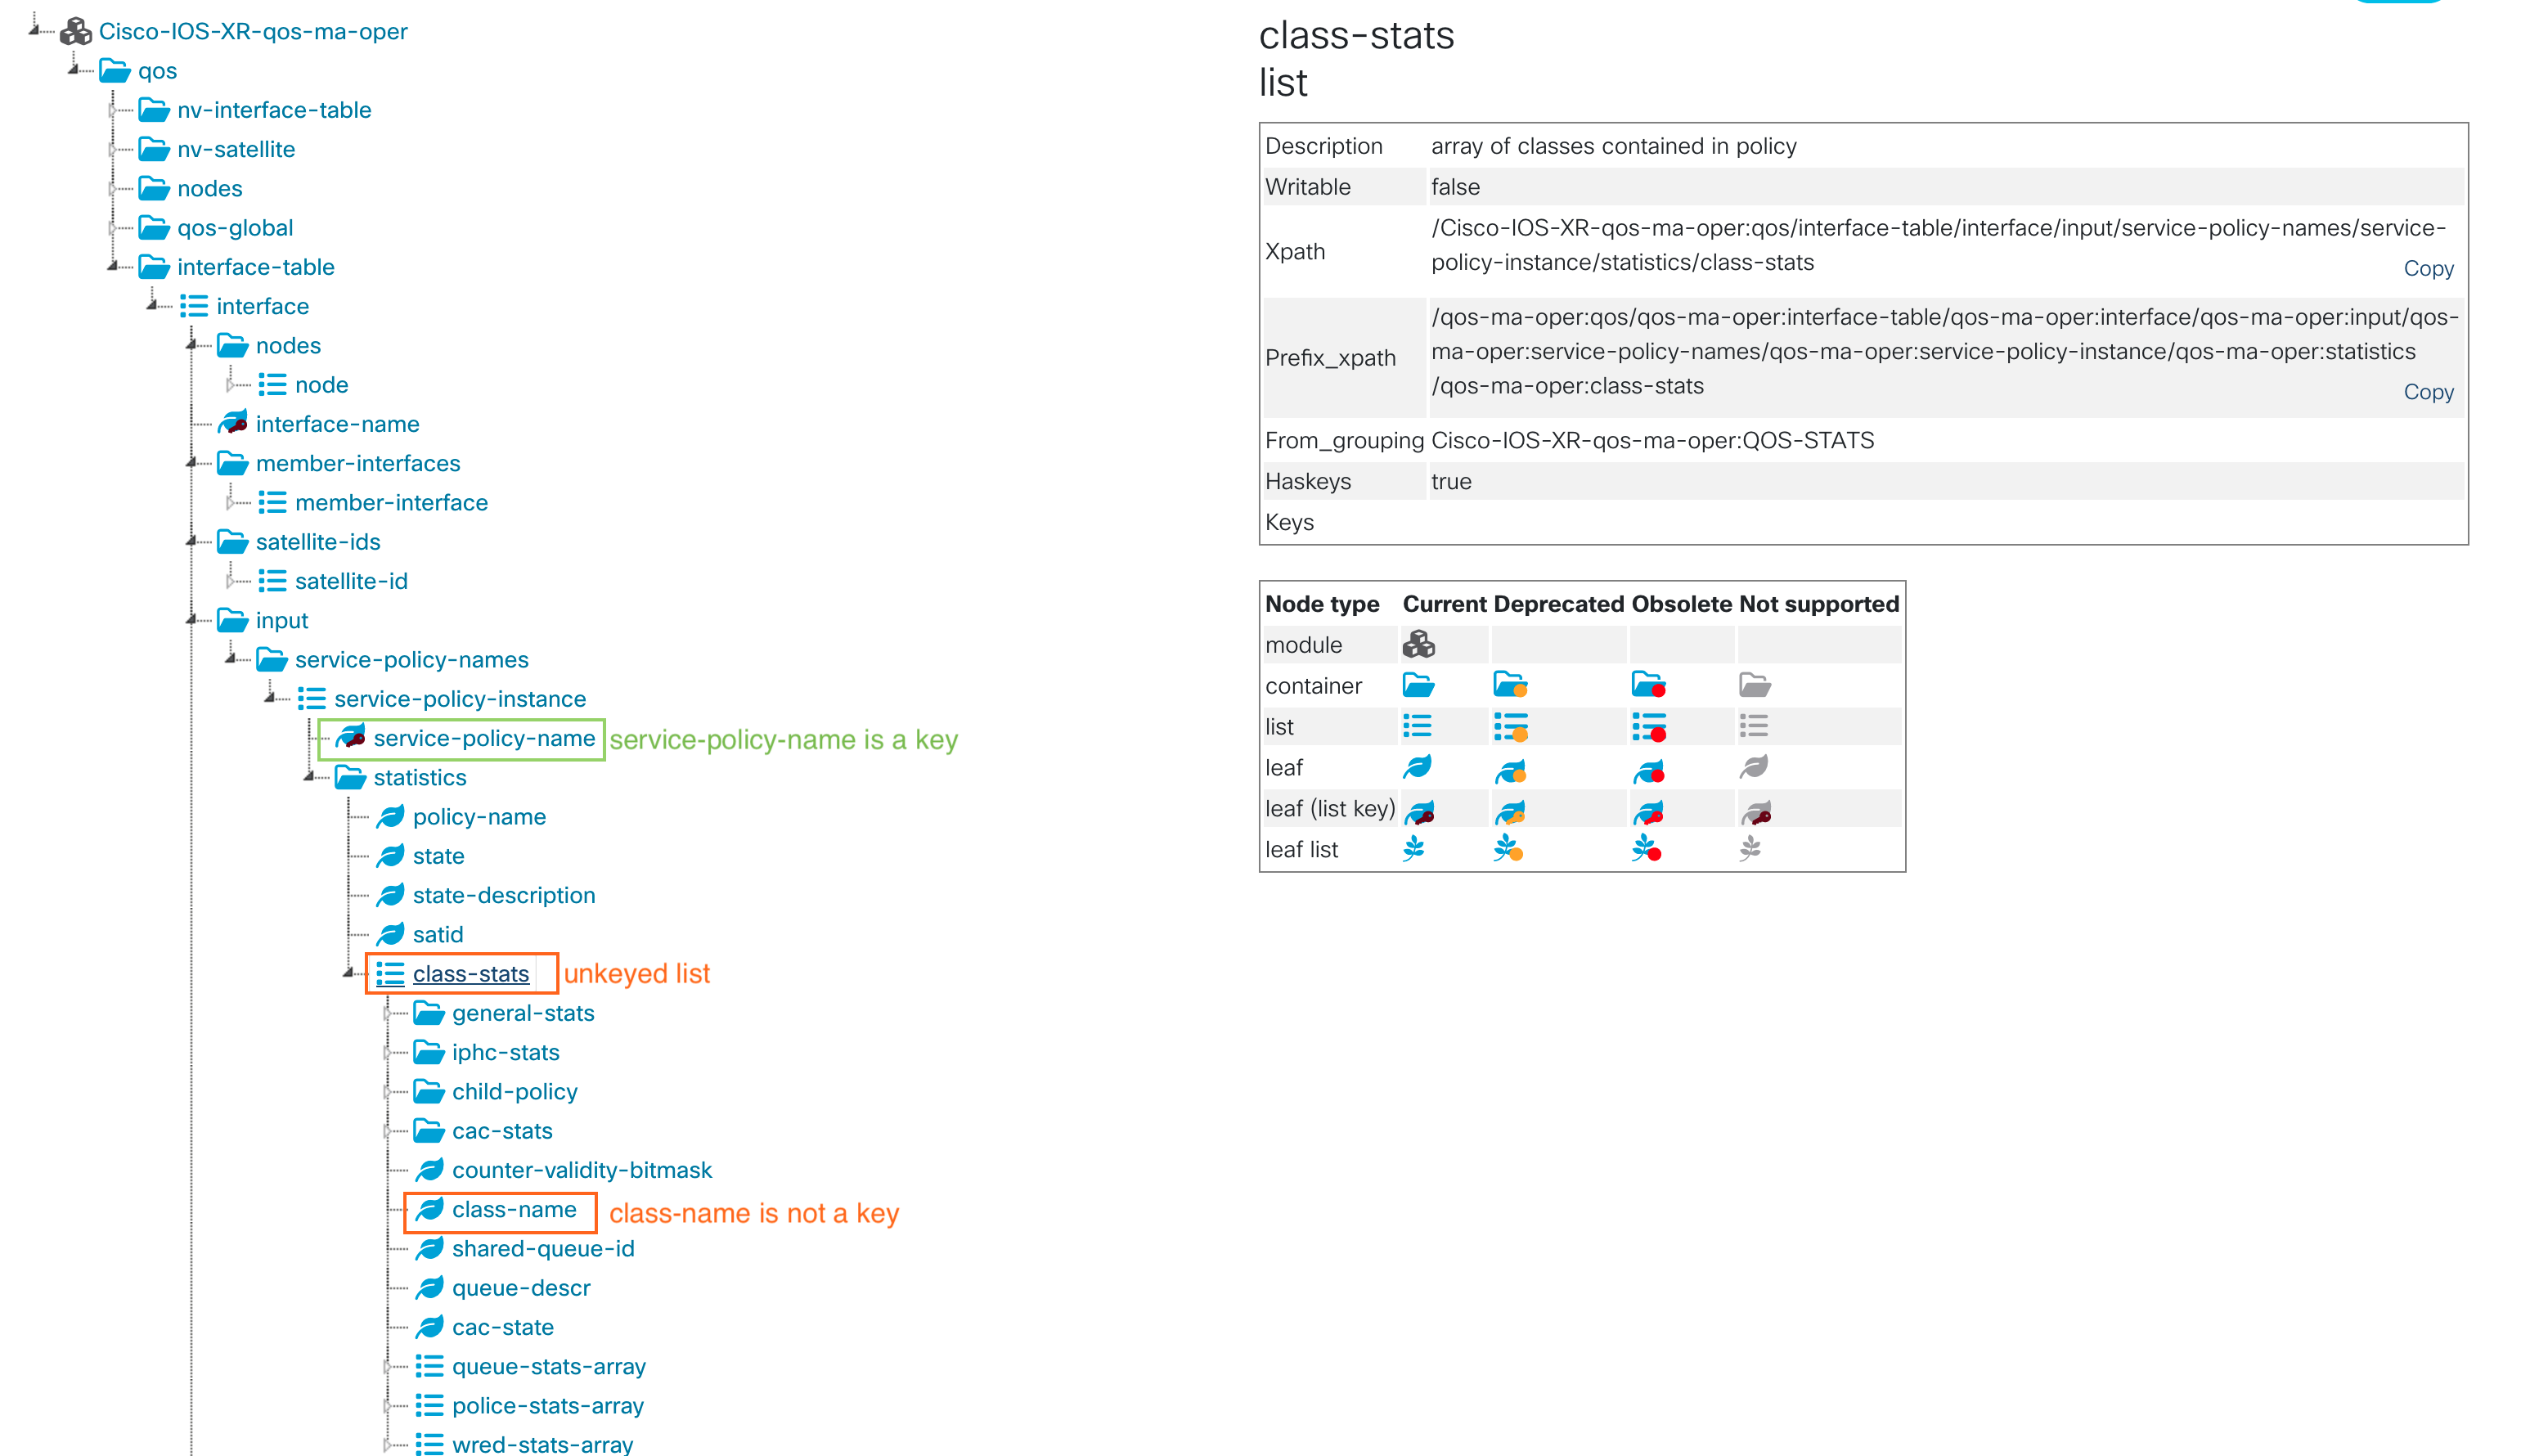
YANG models used for telemetry are not always perfect, sometimes they do not exactly fit our needs. There is so much data with many different models, it may happen that a particular model has a wrong data type. In the Cisco-IOS-XR-qos-ma-oper:qos/interface-table YANG model, which is used to retrieve QOS interface statistics, the class-name leaf inside a service-policy is not seen as a key. We are in the situation of an unkeyed list and it often causes issues with collectors.
Many times, the model can be updated, but it means installing a SMU (Software Maintenance Upgrade) or a new software version. It is often much simpler to work with the current model available and do some work in the telemetry collector to adapt it to specific needs.
This article aims to show examples on how to work around YANG models and telemetry collector limitations. It shows an example on how to provides a complete dashboard for monitoring QOS interface statistics.
Telemetry Stack
Components
A simple telemetry stack is composed of three main elements:
- Collector: It receives, processes and exports telemetry data from various sources
- Database: It stores data. The most suitable databases are Time Series DataBase (TSDB). Indeed, they are specifically built for handling metrics that are time-stamped.
- Visualization tool: It queries the database to display data. It allows to create graphs and others charts for data visualization. Those charts can often be gathered in dashboards.

An alert manager is often added in the stack to trigger alerts on specific thresholds. Many time, the alert manager is part of the visualization tool.
There are multiple options for those elements, proprietary and opensource. Below are popular opensource tools that can be used to build a telemetry stack:
- Collectors: Telegraf, gnmic, Fluentd, Logstash
- Database: InfluxDB, Prometheus, Elasticsearch
- Visualization: InfluxDB, Grafana, Kibana
The previously known TICK stack (Telegraf - InfluxDB - Chronograf - Kapacitor) is now integrated into InfluxDB. Since version 2.x, Chronograf (visualization) and Kapacitor (alerts) are integrated into InfluxDB, only Telegraf remains a separate component. Therefore, with only Telegraf and InfluxDB you can have a working telemetry stack.
TIG Stack
The TIG stack (Telegraf - InfluxDB - Grafana) is a popular opensource telemetry stack that can be used to gather telemetry data from several network platforms including Cisco devices like IOS XR routers. All example will be based on this stack with InfluxDB (version 2.x).
While InfluxDB offers its own web application for data visualization, Grafana is still used. Indeed, it offers many more options for building dashboards and alerts and can work with other data sources than InfluxDB. Using InfluxDB interface is still very valuable to explore the database and build flux queries.
Collection methods
There are two collection methods for telemetry. Dial-in and dial-out, it refers to which element initiates the telemetry session: the collector or the data source device. For more information on what you could choose, there is this great article from Shelly on XRdocs: Model-Driven Telemetry: Dial-In or Dial-Out ?
As both methods may be used depending on your environment, both approaches will be described and used as examples. While gRPC dial-out is often easier to work with, we will show that the same result can be achieved with both.
Telegraf collector
Telegraf is composed of multiple plugins that can be categorized in four different types:
- Input plugin: collect raw metrics from the data sources
- Processor plugin: transform, decorate and filter metrics
- Aggregator plugin: create aggregate metrics such as average mean, min, max, etc.
- Output plugin: write metrics to datastore
For IOS XR routers, the plugin inputs.cisco_telemetry_mdt is used for dial-out and the plugin inputs.gnmi is used for dial-in.
Multiples processor plugins will be used in the following examples to sanitize the data received and ensure that the output format is the same for both the dial-in and dial-out methods.
Telemetry metric format
Most telemetry data based on timeseries follows a common format. It is important to know this format to better understand how data is handled between the different components of the stack.
A time serie data point requires the following metadata:
- Timestamp: the time at which the metric was collected
- Metric name: such as sys.cpu.user, sys.env.temp
- Value: the value of the metric at the given timestamp. This can be of many types such as integer, float, string, boolean, etc.
- Tag: key/value pairs that uniquely identify the metric. There can be one or multiples tag. For example, there could be multiple cpu cores and many cpu on a system
Most of the time in TSDB, metrics are stored in containers called measurement. A measurement name is the description of the data that are stored. A measurement may contain multiples fields.
Below is an example of metrics collected for a server with two cpus of two cores, there are two field values: one for the cpu user utilization and one for the cpu system utilization. The tags are: host, cpu and core.
| time | measurement | host | cpu | core | field | value |
|---|---|---|---|---|---|---|
| 2023-07-11T00:00:00Z | sys | server1 | 0 | 0 | cpu.user | 11 |
| 2023-07-11T00:00:00Z | sys | server1 | 0 | 0 | cpu.system | 8 |
| 2023-07-11T00:00:00Z | sys | server1 | 0 | 1 | cpu.user | 11 |
| 2023-07-11T00:00:00Z | sys | server1 | 0 | 1 | cpu.system | 23 |
| 2023-07-11T00:00:00Z | sys | server1 | 1 | 0 | cpu.user | 11 |
| 2023-07-11T00:00:00Z | sys | server1 | 0 | 0 | cpu.system | 8 |
| … | … | … | … | … | … | … |
Docker compose
Building a telemetry stack with docker containers is a great way to quickly start testing telemetry. It could also be used for a production environment, though it would propably need to be hardened.
Below is a simple docker compose to launch a TIG stack.
version: "2"
services:
  grafana:
    image: grafana/grafana:latest
    container_name: grafana
    ports:
      - '3000:3000'
    volumes:
      - ./grafana-provisioning/:/etc/grafana/provisioning
    depends_on:
      - influxdb
    environment:
      - GF_SECURITY_ADMIN_USER=admin
      - GF_SECURITY_ADMIN_PASSWORD=admin123
      - INFLUX_DB_TOKEN=MYSUPERSECRETTOKEN

  influxdb:
    image: influxdb:latest
    container_name: influxdb
    ports:
      - '8086:8086'
    environment:
      - DOCKER_INFLUXDB_INIT_MODE=setup
      - DOCKER_INFLUXDB_INIT_BUCKET=telemetry
      - DOCKER_INFLUXDB_INIT_USERNAME=admin
      - DOCKER_INFLUXDB_INIT_PASSWORD=admin123
      - DOCKER_INFLUXDB_INIT_ORG=lab
      - DOCKER_INFLUXDB_INIT_ADMIN_TOKEN=MYSUPERSECRETTOKEN
    volumes:
      - /tmp/influxdb2_data:/var/lib/influxdb2

  telegraf:
    image: telegraf:latest
    container_name: telegraf
    depends_on:
      - influxdb
    ports:
      - '57500:57500'
    volumes:
     # - ./telegraf_dial_out.conf:/etc/telegraf/telegraf.conf:ro
     - ./telegraf_dial_in.conf:/etc/telegraf/telegraf.conf:ro
     - ./embedded_tag.star:/etc/telegraf/embedded_tag.star:ro
Default tcp ports are used for Grafana (3000) and InfluxDB (8086). The port 57500 is exposed for Telegraf, it is only used in case of dial-out methods as there is an inbound connection to the collector. Some environment variables are used to define admin user and password as well as an API token for InfluxDB. If those variables are changed, Telegraf configuration files needs to be updated accordingly.
The InfluxDB data is persistent across restart of the stack but stored in /tmp.
The folder grafana-provisioning contains files for creating of the InfluxDB datasource as well as the dashboard.
The file embedded_tag.star is a small script used to format data when the dial-in method is used. More details are provided in the following sections.
Below table is a quick reminder of useful docker compose commands:
| Command | Description |
|---|---|
| docker compose pull | Pull the images present in the file. Will update to the latest image version if available. |
| docker compose up | Create and launch the containers. The command does not return and logs are sent to the terminal output |
| docker compose up -d | Create and launch the containers in detached mode. The command returns after the containers creation |
| docker compose ps | Show the running containers |
| docker compose down | Stop and delete the containers |
| docker compose logs <container_name> | show the logs for a specific container |
For more information, have a look at the documentation
Telemetry configuration
Dial-out method
When using the dial-out method, more configuration is done on the routers and the telegraf configuration is simpler and more static. Although some processor plugins are used to transform and standardize the data.
XR configuration
The configuration on the router must define the address and port of the collector as well as the transport and encoding used. Here for simplicity the gRPC without TLS is used, therefore no certificate is required. For production network, it is recommended to use TLS for data encryption.
Two sensor-paths are defined for both input and output QOS interface statistics. Finally, the sensor group is associated to the destination with telemetry data being sent every 10 seconds (10000ms).
telemetry model-driven
 destination-group TIG
  vrf MGMT
  address-family ipv4 10.48.82.175 port 57500
   encoding self-describing-gpb
   protocol grpc no-tls
  !
 !
 sensor-group QOS
  sensor-path Cisco-IOS-XR-qos-ma-oper:qos/interface-table/interface/output
  sensor-path Cisco-IOS-XR-qos-ma-oper:qos/interface-table/interface/input
 !
 subscription TIG
  sensor-group-id QOS sample-interval 10000
  destination-id TIG
Telegraf configuration
Output
The output plugin outputs.influxdb_v2 is used to send the collected metrics to the InfluxDB database (note the _v2 for InfluxDB 2.x). The url, token, organization and bucket must match what is defined in the docker compose file.
[[outputs.influxdb_v2]]
  urls = ["http://influxdb:8086"]
  token = "MYSUPERSECRETTOKEN"
  organization = "lab"
  bucket = "telemetry"
Input
The input plugin inputs.cisco_telemetry_mdt is used to create a gRPC server listening for new dial-out telemetry connections. The transport used is gRPC, simple tcp could also be used. The address and port on which to listen are defined with the service_address attribute.
The embedded_tag attribute is quite important in our case as this helper has been designed specifically to cover the cases of unkeyed list. It will create a new tag from the leaf class-name. Having the class-name as a tag will allow to uniquely identify the metric collected.
Aliases are defined to reduce the name of the metric once stored in the database. Note that this functionality is offered natively by the input plugin but it could have been done with a processor.
[[inputs.cisco_telemetry_mdt]]
 transport = "grpc"
 service_address = ":57500"
 max_msg_size = 4000000
 embedded_tags = ["Cisco-IOS-XR-qos-ma-oper:qos/interface-table/interface/input/service-policy-names/service-policy-instance/statistics/class-stats/class-name",
 "Cisco-IOS-XR-qos-ma-oper:qos/interface-table/interface/output/service-policy-names/service-policy-instance/statistics/class-stats/class-name"]
  [inputs.cisco_telemetry_mdt.aliases]
   StatsQosIn = "Cisco-IOS-XR-qos-ma-oper:qos/interface-table/interface/input/service-policy-names/service-policy-instance/statistics"
   StatsQosOut = "Cisco-IOS-XR-qos-ma-oper:qos/interface-table/interface/output/service-policy-names/service-policy-instance/statistics"
Processor
Three processors are used. The first is to rename the tag class_stats/class_name to class_name. This tag was created by the output plugin using the embedded_tags attribute. The second is to reduce the metric name by removing the prefix path. For example the field class_stats/general_stats/total_transmit_rate becomes total_transmit_rate. The last one is to ensure that all data is correctly typed.
Namepass is a Telegraf selector. It filters the metrics that are processed by a plugin. In this example, it is to ensure that only the targeted metrics are going through the processors. The names used are the aliases given by the input plugin.
[[processors.rename]]
  namepass = ["StatsQosIn","StatsQosOut"]
  [[processors.rename.replace]]
    tag = "class_stats/class_name"
    dest = "class_name"

[[processors.regex]]
  namepass = ["StatsQosIn","StatsQosOut"]
  [[processors.regex.field_rename]]
    pattern = "^class_stats\\/general_stats\\/(.*)$"
    replacement = "${1}"

[[processors.converter]]
  namepass = ["StatsQosIn","StatsQosOut"]
  [processors.converter.fields]
   unsigned = ["*bytes","*packets","*rate"]
The full Telegraf configuration can be found on the Github repository.
Dial-in method
When using the dial-in method, there are barely any configuration on the routers and most of it is done on the collector. The list of routers to target, as well as which sensor-paths to collect are defined in the Telegraf configuration. It is much more similar to what could have been done with SNMP. Some processor plugins are also used to transform and standardize the data.
XR configuration
The configuration on the router must define the port of the gRPC server. Here for simplicity the gRPC without TLS is used, therefore no certificate is required. For production network, it is recommended to use TLS for data encryption.
grpc
 port 57400
 no-tls
 vrf MGMT
Telegraf configuration
Output
The same output plugin outputs.influxdb_v2 is used as for the dial-out method.
Input
The input plugin inputs.gnmi is used to establish a telemetry session over GNMI (gRPC Network Management Interface). All routers on which telemetry needs to be collected must be specified in the addresses list, the port of the gRPC server on the router must be included. The username and password to connect to the routers must be defined.
Several subscriptions can be described, each correspond to a sensor-path to collect.
[[inputs.gnmi]]
  addresses = ["R0.routers.lab:57400","R1.routers.lab:57400"]
  username = "cisco"
  password = "cisco123"
  encoding = "json_ietf"
  redial = "30s"

  [[inputs.gnmi.subscription]]
    name = "StatsQosOut"
    origin = "Cisco-IOS-XR-qos-ma-oper"
    path = "qos/interface-table/interface/output"
    subscription_mode = "sample"
    sample_interval = "10s"

  [[inputs.gnmi.subscription]]
    name = "StatsQosIn"
    origin = "Cisco-IOS-XR-qos-ma-oper"
    path = "qos/interface-table/interface/input"
    subscription_mode = "sample"
    sample_interval = "10s"
Processor
Several processors are used to ensure that the data collected with the gnmi plugin is sent to the database with exact same format as with the Cisco mdt plugin. The order attribute is used to ensure that the processors are executed in the correct order. Namepass are also used.
The first processor is to define the new class-name tag as this is an unkeyed list. It serves the same purpose as the embedded_tag attribute. This is done by a custom Starlark script. The processor processors.starlark allow you to programatically transform the data. It is very flexible and allows to perform operations that are not natively offered by the plugins. The detail of the Starlark script is presented on the next section.
The other processors used are to standardize the data. They reduce the prefix path name, convert some data returned as string to unsigned integer and ensure that underscores _ are used in tags and fields instead of dashes -.
[[processors.starlark]]
  order = 1
  namepass = ["StatsQosIn","StatsQosOut"]
  script="/etc/telegraf/embedded_tag.star"

  [processors.starlark.constants]
   embedded_tag_path = "service_policy_names/service_policy_instance/statistics_class-stats"
   embedded_tag_name = "class-name"

[[processors.converter]]
  order = 2
  namepass = ["StatsQosIn","StatsQosOut"]
  [processors.converter.fields]
   unsigned = ["*bytes","*packets","*rate"]

[[processors.regex]]
  order = 3
  namepass = ["StatsQosIn","StatsQosOut"]

  [[processors.regex.field_rename]]
    pattern = "^service_policy_names\\/service_policy_instance\\/statistics_class-stats\\/general-stats_(.*)$"
    replacement = "${1}"

[[processors.strings]]
  order = 4
  namepass = ["StatsQosIn","StatsQosOut"]
  [[processors.strings.replace]]
    field_key = "*"
    old = "-"
    new = "_"

[[processors.strings]]
 order = 5
 namepass = ["StatsQosIn","StatsQosOut"]
 [[processors.strings.replace]]
    tag_key = "*"
    old = "-"
    new = "_"
The full Telegraf configuration can be found on the Github repository.
Starlark script for embedded_tag
As the inputs.gnmi plugin does not offer options like embedded_tag, a starlark script is used. Starlark is a programming language which can be described as a dialect of python. It is very similar to python but with only a few basic functions. It is very small and simple.
When using the Starlark processor, every metric object is sent to a function apply(metric) that must be defined. The function will be called with each metric, and can return None, a single metric, or a list of metrics.
When the data is received the metric path will look like this service_policy_names/service_policy_instance/statistics_class-stats_0_class-name. Because there are multiples metric with the same tags, the path will contain an index to differentiate the metrics. For example _0_class-name.
This index is used in the script to build new metrics with the class-name as a tag.
The full script can be found on the Github repository.
Verification
Whether the dial-out or the dial-in method is used, the verification is similar. Indeed, in both scenarios, telemetry sensors are sent to the collector.
Below are the three basic commands for telemetry verification:
show telemetry model-driven destinationshow telemetry model-driven sensor-groupshow telemetry model-driven subscription
The gRPC and telemetry traces can also be looked at for more low-level troubleshooting:
show grpc trace {all|ems|yfed|yfw}show telemetry model-driven trace {all|backend-err|backend-sub|backend-timer|config|error|event|go-info|startup|subdb|timer}
Dial-out
To ensure that telemetry is correctly working, we first need to ensure that the gRPC session is correctly established with the collector. The state of the destination group must be Active.
RP/0/RP0/CPU0:R1#show telemetry model-driven destination
Thu Aug 31 15:02:24.837 UTC
  Group Id         Sub                          IP                                            Port    Encoding            Transport   State
  ------------------------------------------------------------------------------------------------------------------------------------------
  TIG              TIG                          192.168.122.1                                 57500   self-describing-gpb grpc        Active
      TLS:                  False
  Collection statistics:
    Maximum tokens                   : 4000
    Event tokens                     : 750
    Cadence tokens                   : 740
    Token processed at               :
    Cadence token advertised at      :
    Event token advertised at        :
    GNMI initial synchronization time:
    Pending queue size               : 0
    Pending queue memory size (bytes): 0
    Processed events                 : 0
    Collection tokens                : 740

RP/0/RP0/CPU0:R1#
The subscription must also be verified to ensure that all sensor groups are resolved.
RP/0/RP0/CPU0:R1#show telemetry model-driven subscription
Thu Aug 31 15:06:16.882 UTC
Subscription:  TIG                      State: ACTIVE
-------------
  Sensor groups:
  Id                               Interval(ms)               State
  QOS                              10000                      Resolved

  Destination Groups:
  Id                 Encoding            Transport   State   Port    Vrf                               IP
  TIG                self-describing-gpb grpc        Active  57500   MGMT                              192.168.122.1
    TLS :             False

RP/0/RP0/CPU0:R1#
If some sensor-groups are in state Not Resolved. The details of the sensor-path must be checked. All paths must be in state Resolved.
RP/0/RP0/CPU0:R1#show telemetry model-driven sensor-group
Thu Aug 31 15:09:18.051 UTC
  Sensor Group Id:QOS
    Sensor Path:        Cisco-IOS-XR-qos-ma-oper:qos/interface-table/interface/input
    Sensor Path State:  Resolved
    Sensor Path:        Cisco-IOS-XR-qos-ma-oper:qos/interface-table/interface/output
    Sensor Path State:  Resolved

RP/0/RP0/CPU0:R1#
Dial-in
When using the dial-in method, the sensor-paths are dynamically defined by the collector. Nevertheless, from XR standpoint, there are still a sensor-group, a subscription and a destination as for the dial-out method. All groups are prefixed with GNMI
The same verification must be done to ensure that telemetry data is correctly sent.
RP/0/RP0/CPU0:R1#show telemetry model-driven destination
Thu Aug 31 14:50:29.941 UTC
  Group Id         Sub                          IP                                            Port    Encoding            Transport   State
  ------------------------------------------------------------------------------------------------------------------------------------------
  GNMI_1003        GNMI__5033885546243418454    192.168.122.1                                 33086   gnmi-json           dialin      Active
      TLS:                  False
  Collection statistics:
    Maximum tokens                   : 4000
    Event tokens                     : 750
    Cadence tokens                   : 714
    Token processed at               :
    Cadence token advertised at      :
    Event token advertised at        :
    GNMI initial synchronization time: 2023-08-31 14:49:46.537741 +0000
    Pending queue size               : 0
    Pending queue memory size (bytes): 0
    Processed events                 : 0
    Collection tokens                : 714

RP/0/RP0/CPU0:R1#show telemetry model-driven subscription
Thu Aug 31 14:50:24.248 UTC
Subscription:  GNMI__5033885546243418454  State: ACTIVE
-------------
  Sensor groups:
  Id                               Interval(ms)               State
  GNMI__5033885546243418454_0      10000                      Resolved
  GNMI__5033885546243418454_1      10000                      Resolved

  Destination Groups:
  Id                 Encoding            Transport   State   Port    Vrf                               IP
  GNMI_1003          gnmi-json           dialin      Active  33086                                     192.168.122.1
    TLS :             False

RP/0/RP0/CPU0:R1#show telemetry model-driven sensor-group
Thu Aug 31 14:50:16.325 UTC
  Sensor Group Id:GNMI__5033885546243418454_0
    Sensor Path:        Cisco-IOS-XR-qos-ma-oper:qos/interface-table/interface/output
    Sensor Path State:  Resolved

  Sensor Group Id:GNMI__5033885546243418454_1
    Sensor Path:        Cisco-IOS-XR-qos-ma-oper:qos/interface-table/interface/input
    Sensor Path State:  Resolved


RP/0/RP0/CPU0:R1#
Grafana
As InfluxDB v2 is used, all queries are done using the Flux language. More information about Flux queries can be found in the documentation. Edit the panels to see how they have been built and which queries are used.
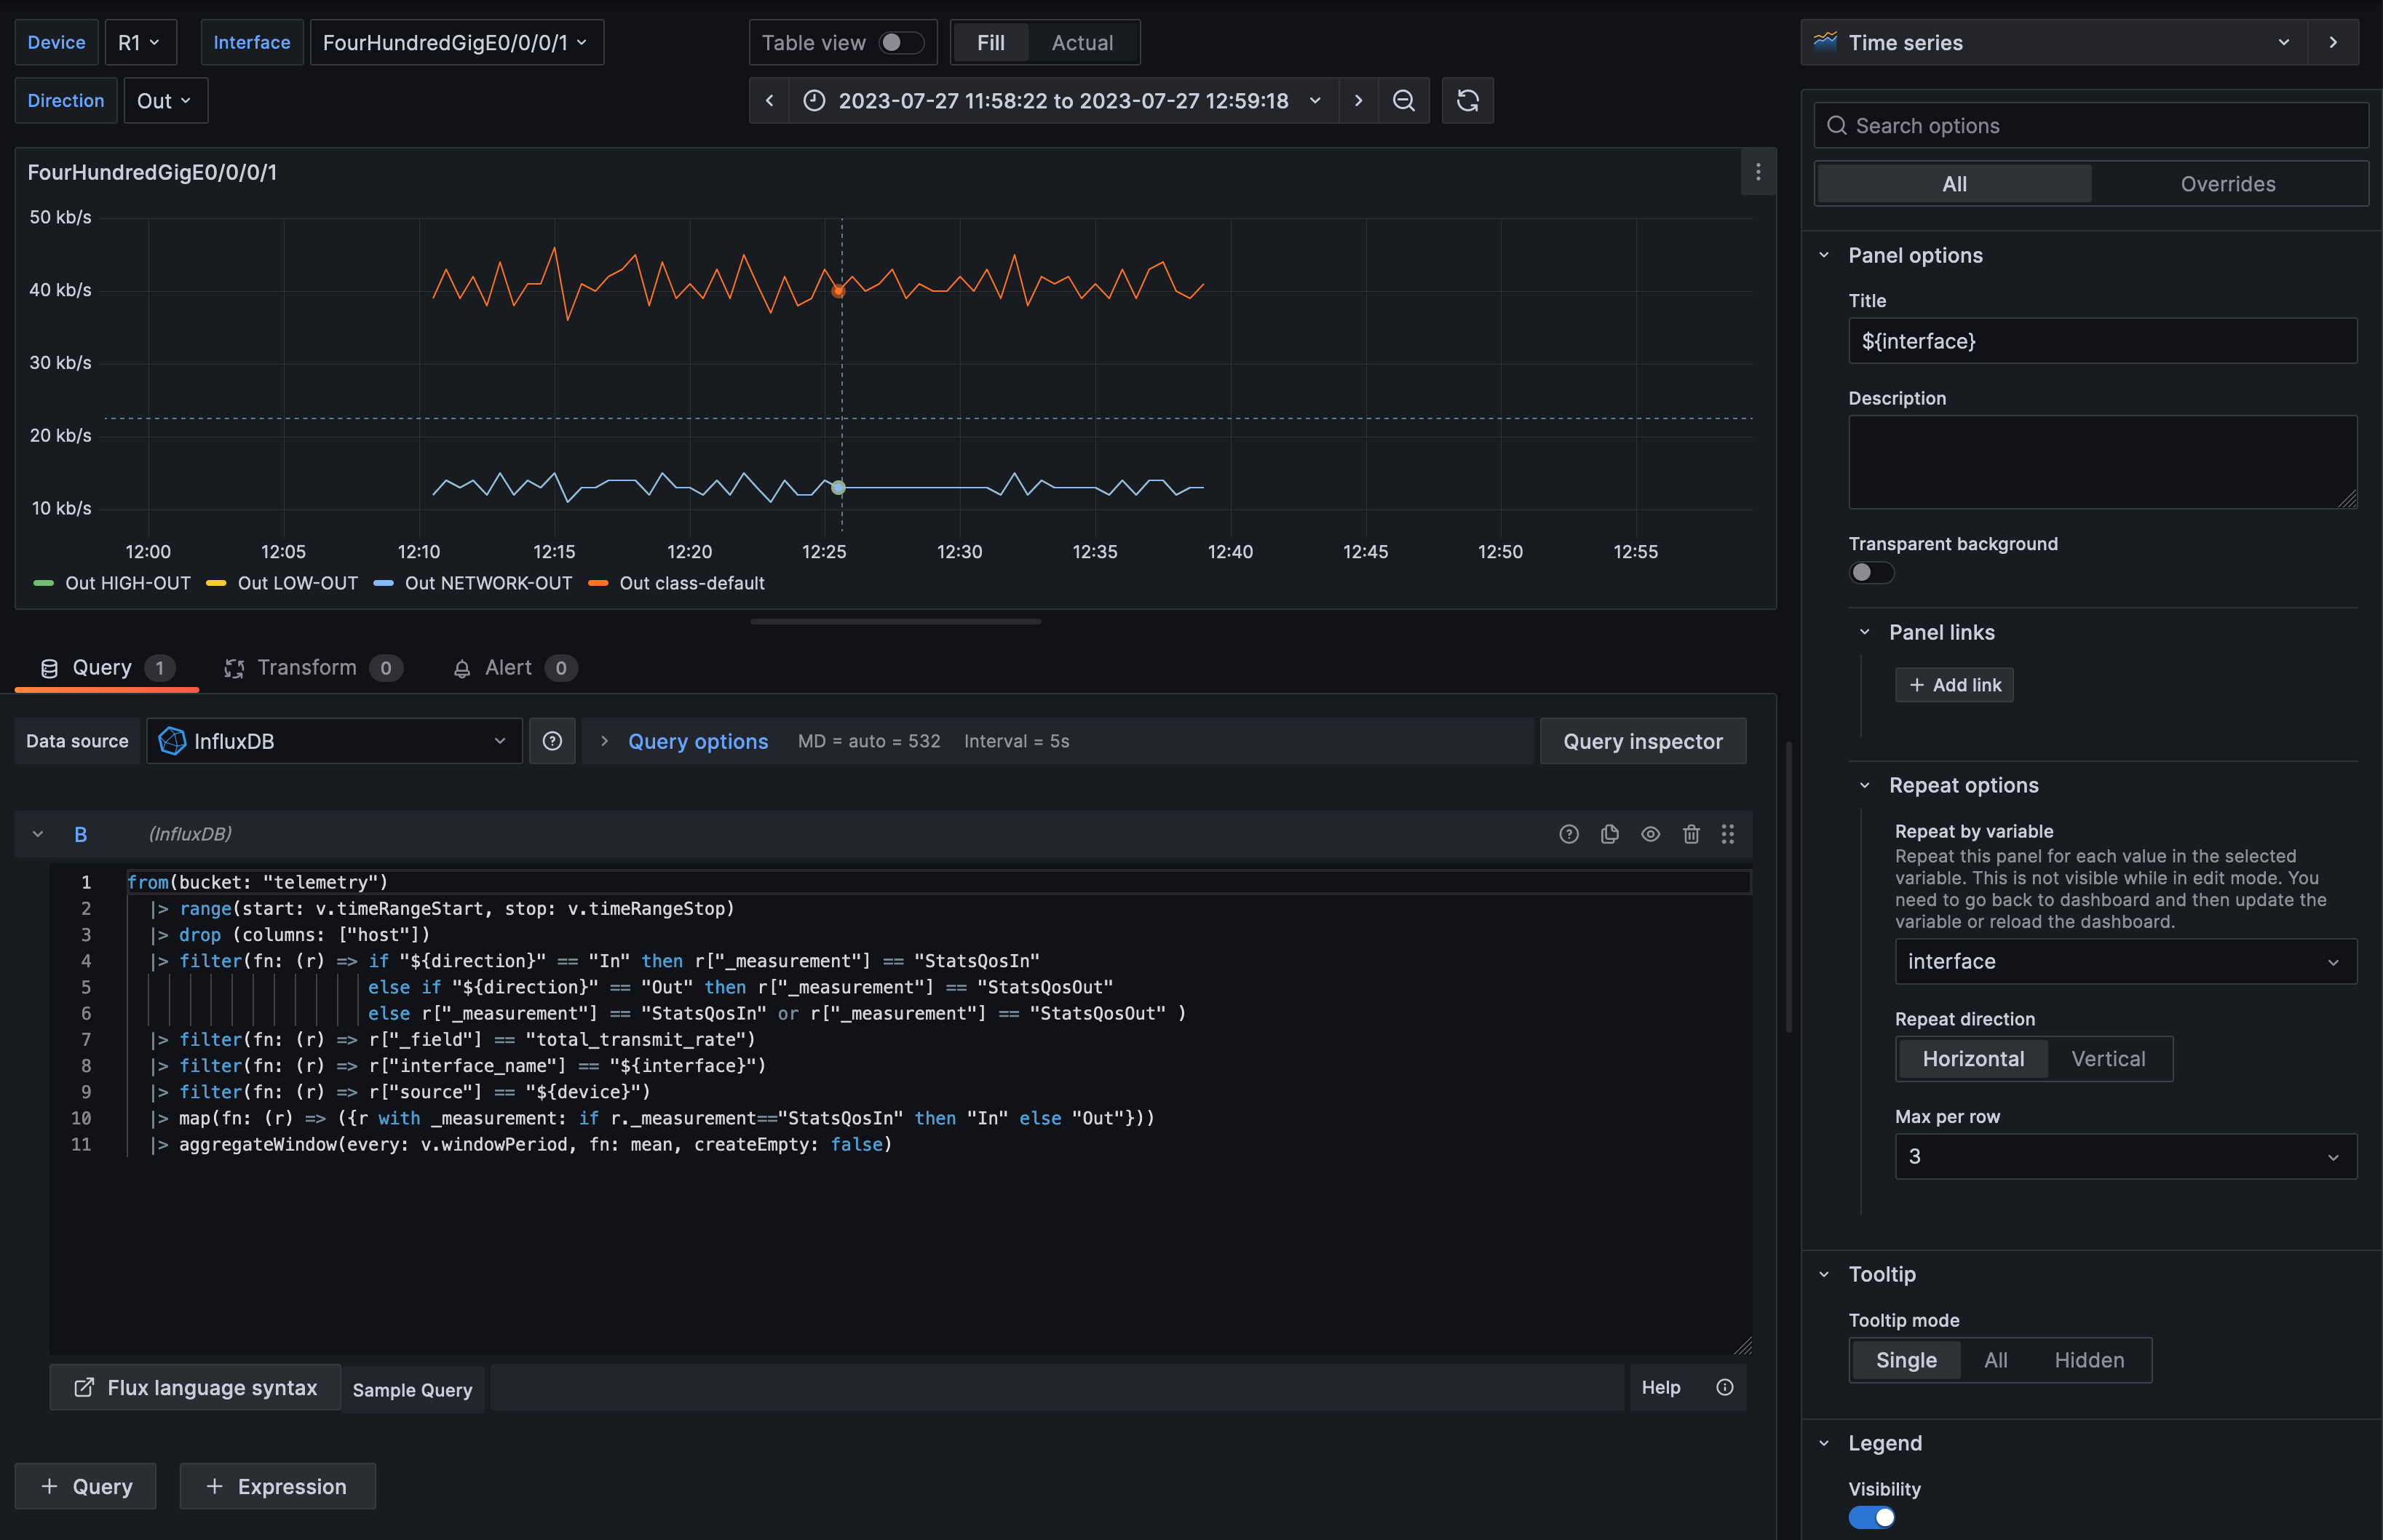
The dashboard has been built with variables for interfaces, device and direction. It allows to have panels created dynamically depending on what have been selected.
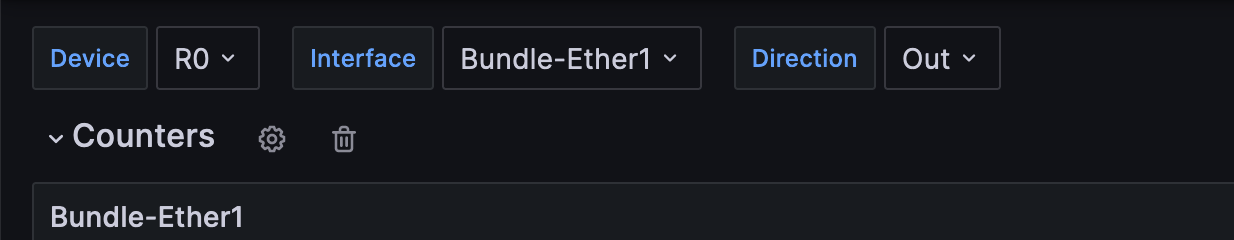
The dashboard can be displayed for one specific device and one or more interfaces can be selected for this device. The device list and the interface list are queried directly from the database. Finally, the direction can be select to have only input or output statistics or both. Those variables can be found in the variables panel of the dashboard settings. Those settings can be explored to better understand how it has been built.
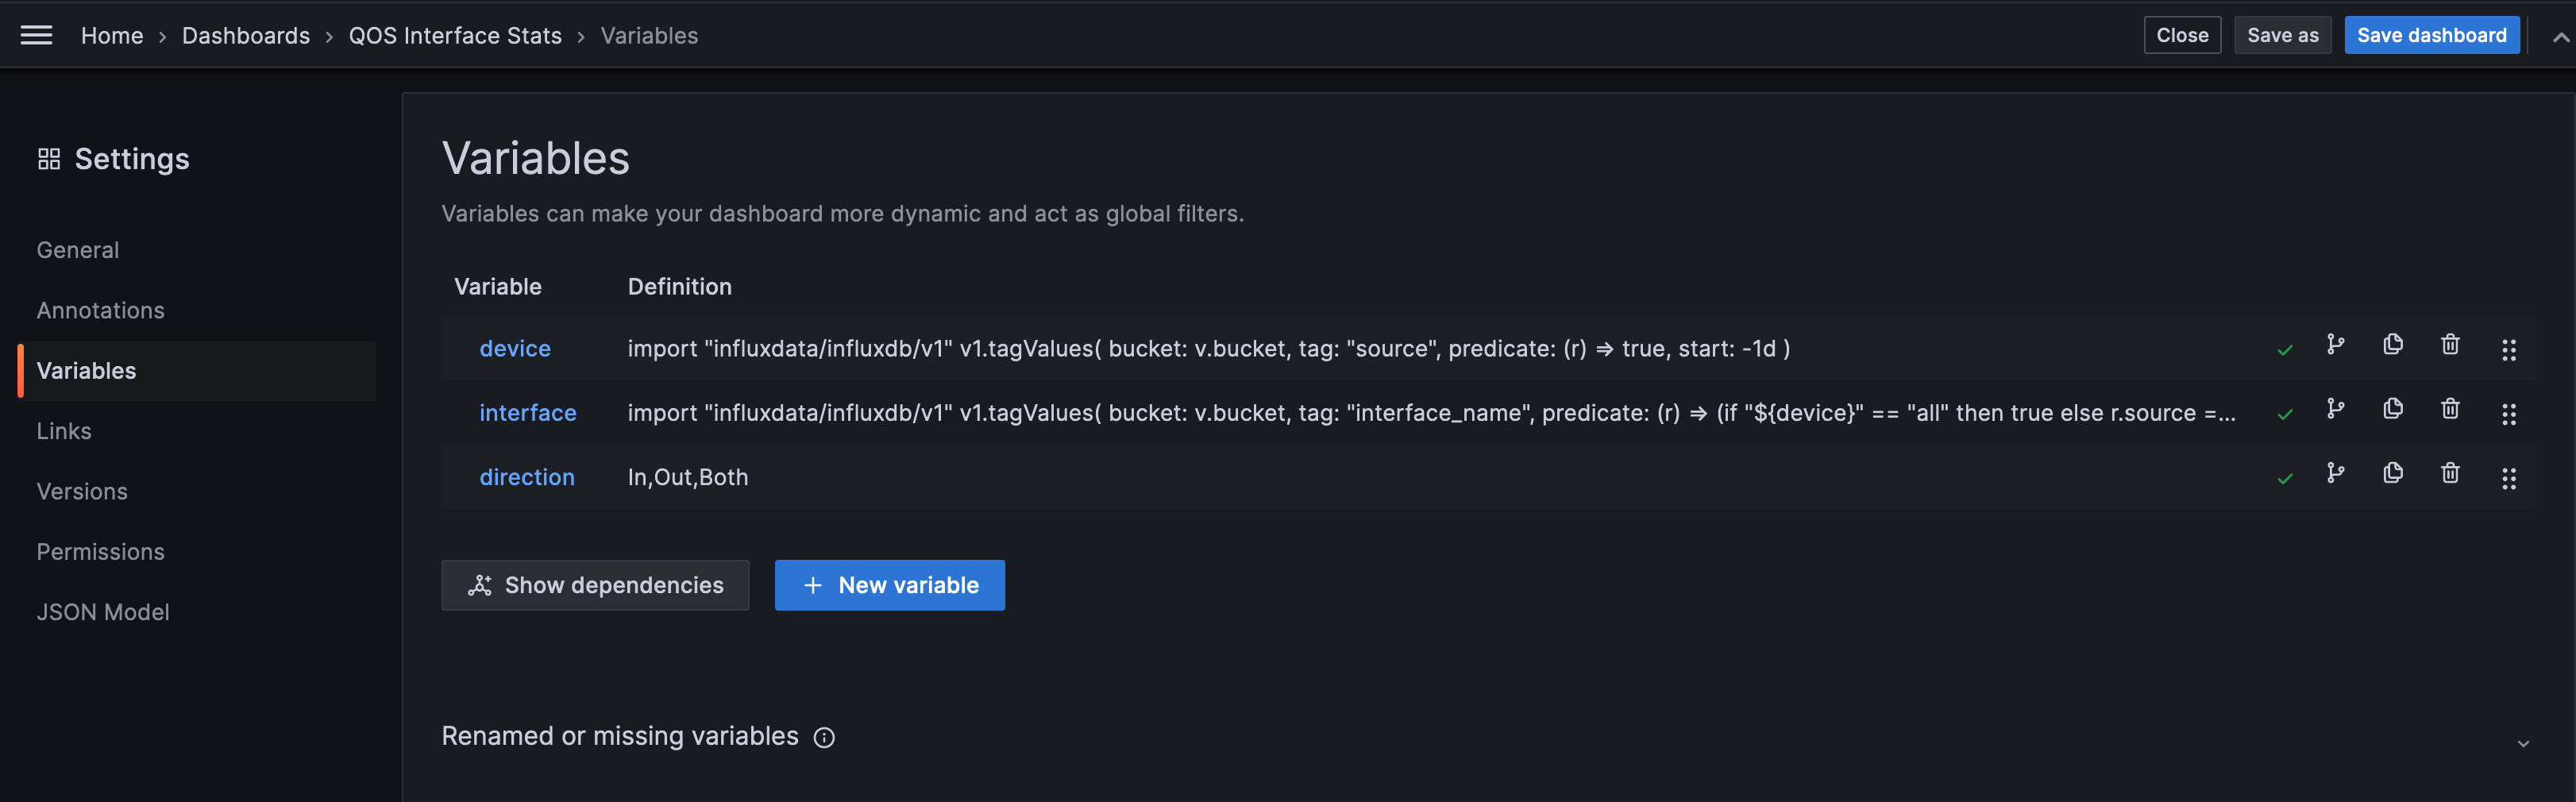
The variables are then used in the queries to filter the result. For example this is how to filter for a specific device using the value of the ${device} variable. |> filter(fn: (r) => r["source"] == "${device}")
Conclusion
Hopefully, this case was practical enough for you to get started with Telemetry. Retrieving telemetry data does not always work on the first try, but with some understanding of the telemetry stack and with a few tweaks, it can work like a charm.
Leave a Comment