
Cisco 8000 NPU Traps Monitoring
Introduction
On Cisco 8000 routers, Network Processing Unit (NPU) traps are raised in response to the type of packets received by the router. Monitoring those counters can be interesting to detect packet loss or to measure deviation from production baseline.
This post will describe how to retrieve Cisco 8000 NPU traps counters through telemetry using gNMI interface.
Cisco 8000 NPU Traps
There are 3 NPU traps categories:
- Exception packets. For example, glean adjacency traffic or packets with IPv4 options.
- Error packets. For example, IPv4 packet with bad checksum or IPv6 packets with a hop count of zero.
- non-LPTS control packets. For example, packets that do not get processed through LPTS (like LACP, LLDP and other L2 control packets).
Each of the NPU traps are policed at a rate that is pre-programmed by the operating system. Packets are policed per NPU within the router and there can be several NPUs per system. Some NPU trap packets allowed by NPU policers are sent to the CPU (Linecard or RP CPU for distributed systems, RP CPU for fixed and centralized systems) if they need additional processing. Others that exceed the NPU policer rate are simply dropped by the NPU.
NPU trap statistics can be retrieved with following CLI:
show controllers npu stats traps-all instance NPU-Number|all location RP|LC
Info: It’s important to understand the system architecture to know which NPU instance should be checked, especially when dealing with linecards in Cisco 8800 distributed systems. Following article written by CS Lee covers port assignment and will help identifying NPU instance for a given interface.
It’s possible to use all keyword both for NPU instance and location to display all NPU traps statistics for every single NPU on every single linecard in the system:
sh controllers npu stats traps-all instance all location all
This is a sample output taken from a Cisco 8200 series router (fixed system: single NPU instance, single location):
RP/0/RP0/CPU0:8202-1#sh controllers npu stats traps-all instance all location all
Trap stats for 0/RP0/CPU0
Traps marked (D*) are punted (post policing) to the local CPU internal VLAN 1586 for debugging
They can be read using "show captured packets traps" CLI
Traps marked (D) are dropped in the NPU
Traps punted to internal VLAN 1538 are processed by the process "spp" on the "Punt Dest" CPU
They can also be read using "show captured packets traps" CLI
"Configured Rate" is the rate configured by user (or default setting) in pps at the LC level
"Hardware Rate" is the actual rate in effect after hardware adjustments
Policer Level:
NPU: Trap meter is setup per NPU in packets per second
IFG: Trap meter is setup at every IFG in bits per second
The per IFG meter is converted from the user configured/default rate (pps)
based on the "Avg-Pkt Size" into bps.
Due to hardware adjustments, the "Configured Rate" and
"Hardware Rate" differ in values.
Trap Type NPU Trap Punt Punt Punt Punt Configured Hardware Policer Avg-Pkt Packets Packets
ID ID Dest VoQ VLAN TC Rate(pps) Rate(pps) Level Size Accepted Dropped
====================================================================================================================================================================
ETHERNET_ACL_DROP(D) 0 0 NPU_DROP --- --- --- ---------- ---------- --- N/A 0 0
ETHERNET_ACL_FORCE_PUNT(D*) 0 1 RPLC_CPU 200 1586 0 67 135 IFG 64 0 0
ETHERNET_VLAN_MEMBERSHIP(D*) 0 2 RPLC_CPU 200 1586 0 67 135 IFG 64 0 0
ETHERNET_ACCEPTABLE_FORMAT 0 3 RPLC_CPU 205 1538 5 67 135 IFG 64 0 0
UNKNOWN_VLAN_OR_BUNDLE_MEMBER(D*) 0 4 RPLC_CPU 200 1586 0 67 135 IFG 64 0 4
NOT_MY_MAC(D*) 0 5 RPLC_CPU 200 1586 0 67 135 IFG 64 0 318
ETHERNET_NO_SIP_MAPPING(D*) 0 6 RPLC_CPU 200 1586 0 67 135 IFG 64 0 0
ETHERNET_NO_VNI_MAPPING(D*) 0 7 RPLC_CPU 200 1586 0 67 135 IFG 64 0 0
ETHERNET_NO_VSID_MAPPING(D*) 0 8 RPLC_CPU 200 1586 0 67 135 IFG 64 0 0
ARP 0 9 RPLC_CPU 207 1538 7 542 474 NPU N/A 192 0
ETHERNET_SA_ERROR(D*) 0 11 RPLC_CPU 200 1586 0 67 135 IFG 64 0 0
ETHERNET_DA_ERROR(D*) 0 12 RPLC_CPU 200 1586 0 67 135 IFG 64 0 0
ETHERNET_SA_MULTICAST(D*) 0 13 RPLC_CPU 200 1586 0 67 135 IFG 64 0 0
DHCPV4_SERVER 0 14 RPLC_CPU 201 1538 1 542 474 NPU N/A 0 0
DHCPV4_CLIENT 0 15 RPLC_CPU 201 1538 1 200 193 IFG 560 0 0
ETHERNET_INGRESS_STP_BLOCK(D*) 0 18 RPLC_CPU 200 1586 0 67 135 IFG 64 0 2
PTP_OVER_ETHERNET 0 19 RPLC_CPU 206 1538 6 4000 3836 IFG 1520 0 0
LLDP 0 21 RPLC_CPU 206 1538 6 4000 3836 IFG 1520 388 0
PFC 0 22 NPU_HOST 200 0 0 500000 146163 IFG 1520 0 0
MSTP 0 23 RPLC_CPU 206 1538 6 4000 3836 IFG 1520 0 0
MACSEC_FIPS_POST 0 24 RPLC_CPU 206 1538 6 4000 3836 IFG 1520 0 0
CFM 0 25 RPLC_CPU 206 1538 6 4000 3836 IFG 1520 0 0
PVST 0 26 RPLC_CPU 206 1538 6 4000 3836 IFG 1520 0 0
ETHERNET_L2CP6(D*) 0 27 RPLC_CPU 200 1586 0 67 135 IFG 64 0 0
ETHERNET_L2CP7(D*) 0 28 RPLC_CPU 200 1586 0 67 135 IFG 64 0 0
SLOW_PROTO (LACP/SYNCE/EOAM) 0 29 RPLC_CPU 207 1538 7 4000 3836 IFG 1520 0 0
CISCO PROTOCOLS (CDP, VTP, DTP, PAGP, UDLD) 0 30 RPLC_CPU 206 1538 6 4000 3836 IFG 1520 0 0
MACSEC 0 31 RPLC_CPU 205 1538 5 4000 3836 IFG 1520 0 0
UNKNOWN_L3_PROTOCOL(D*) 0 32 RPLC_CPU 200 1586 0 67 135 IFG 64 0 0
CFM L2 AC 0 33 RPLC_CPU 206 1538 6 4000 3836 IFG 1520 0 0
ETHERNET_TEST_OAM_AC_MIP(D*) 0 34 RPLC_CPU 200 1586 0 67 135 IFG 64 0 0
CFM MCAST 0 35 RPLC_CPU 206 1538 6 4000 3836 IFG 1520 0 0
ETHERNET_SYSTEM_MYMAC(D*) 0 36 RPLC_CPU 200 1586 0 67 135 IFG 64 0 0
ETHERNET_UNKNOWN_BC(D*) 0 37 RPLC_CPU 200 1586 0 67 135 IFG 64 0 0
ETHERNET_UNKNOWN_MC(D*) 0 38 RPLC_CPU 200 1586 0 67 135 IFG 64 0 0
ETHERNET_UNKNOWN_UC(D*) 0 39 RPLC_CPU 200 1586 0 67 135 IFG 64 0 0
ETHERNET_LEARN 0 40 RPLC_CPU 205 1570 5 16384 16272 IFG 64 22 0
ETHERNET_SMAC_MISS(D*) 0 43 RPLC_CPU 200 1586 0 67 135 IFG 64 0 0
ETHERNET_MC_SNOOP_LOOKUP_MISS(D*) 0 45 RPLC_CPU 200 1586 0 67 135 IFG 64 0 0
ETHERNET_L2_DLP_NOT_FOUND(D*) 0 46 RPLC_CPU 200 1586 0 67 135 IFG 64 0 0
ETHERNET_SAME_INTERFACE(D) 0 47 NPU_DROP --- --- --- ---------- ---------- --- N/A 0 7376
ETHERNET_DSPA_MC_TRIM(D*) 0 48 RPLC_CPU 200 1586 0 67 135 IFG 64 0 0
ETHERNET_EGRESS_STP_BLOCK(D*) 0 49 RPLC_CPU 200 1586 0 67 135 IFG 64 0 0
ETHERNET_SPLIT_HORIZON(D) 0 50 NPU_DROP --- --- --- ---------- ---------- --- N/A 0 0
ETHERNET_DISABLED(D*) 0 51 RPLC_CPU 200 1586 0 67 135 IFG 64 0 0
ETHERNET_INCOMPATIBLE_EVE_CMD(D*) 0 52 RPLC_CPU 200 1586 0 67 135 IFG 64 0 0
ETHERNET_PADDING_RESIDUE_IN_SECOND_LINE(D*) 0 53 RPLC_CPU 200 1586 0 67 135 IFG 64 0 0
ETHERNET_SVI_EGRESS_DHCP(D*) 0 55 RPLC_CPU 200 1586 0 67 135 IFG 64 0 0
ETHERNET_NO_PWE_L3_DEST(D*) 0 56 RPLC_CPU 200 1586 0 67 135 IFG 64 0 0
V4_MCAST_DISABLED(D*) 0 57 RPLC_CPU 205 1586 5 67 135 IFG 64 0 0
V4_UCAST_DISABLED(D*) 0 58 RPLC_CPU 200 1586 0 67 135 IFG 64 0 0
V4_CHECKSUM_ERROR(D*) 0 59 RPLC_CPU 200 1586 0 67 135 IFG 64 0 0
V4_HEADER_ERROR_OR_TTL0(D*) 0 60 RPLC_CPU 200 1586 0 67 135 IFG 64 0 0
GRE_NEXT_PROTO_UNKNOWN(D*) 0 61 RPLC_CPU 200 1586 0 67 135 IFG 64 0 0
V4_OPTIONS 0 62 RPLC_CPU 205 1538 5 1000 949 IFG 64 0 0
IPV4_NON_COMP_MC(D*) 0 63 RPLC_CPU 200 1586 0 67 135 IFG 64 0 0
V6_MCAST_DISABLED(D*) 0 64 RPLC_CPU 200 1586 0 67 135 IFG 64 0 0
V6_UCAST_DISABLED(D*) 0 65 RPLC_CPU 200 1586 0 67 135 IFG 64 0 0
V6_HOP_BY_HOP 0 66 RPLC_CPU 205 1538 5 67 135 IFG 64 0 0
V6_HEADER_ERROR_OR_HOPCOUNT0(D*) 0 67 RPLC_CPU 200 1586 0 67 135 IFG 64 0 0
IPV6_ILLEGAL_DIP(D*) 0 68 RPLC_CPU 200 1586 0 67 135 IFG 64 0 0
IPV6_ZERO_PAYLOAD(D*) 0 69 RPLC_CPU 200 1586 0 67 135 IFG 64 0 0
IPV6_NEXT_HEADER_CHECK(D*) 0 70 RPLC_CPU 200 1586 0 67 135 IFG 64 0 0
IPV6_NON_COMP_MC(D*) 0 71 RPLC_CPU 200 1586 0 67 135 IFG 64 0 0
IPV6_SRV6_TERM_UNKNOWN_PROT(D*) 0 72 RPLC_CPU 200 1586 0 67 135 IFG 64 0 0
MPLS_UNKNOWN_PROTOCOL_AFTER_BOS(D*) 0 73 RPLC_CPU 200 1586 0 67 135 IFG 64 0 0
MPLS_TTL_0(D*) 0 74 RPLC_CPU 200 1586 0 67 135 IFG 64 0 0
MPLS_MPLS_TP_OVER_PWE(D*) 0 75 RPLC_CPU 200 1586 0 67 135 IFG 64 0 0
MPLS_MPLS_TP_OVER_LSP(D*) 0 76 RPLC_CPU 200 1586 0 67 135 IFG 64 0 0
MPLS_OAM_ALERT_LABEL 0 77 RPLC_CPU 205 1538 5 67 135 IFG 64 0 0
MPLS_EXTENSION_LABEL(D*) 0 78 RPLC_CPU 200 1586 0 67 135 IFG 64 0 0
MPLS_ROUTER_ALERT_LABEL 0 79 RPLC_CPU 205 1538 5 67 135 IFG 64 0 0
UNEXPECTED_RESERVED_LABEL(D*) 0 80 RPLC_CPU 200 1586 0 67 135 IFG 64 0 0
MPLS_DISABLED(D*) 0 81 RPLC_CPU 200 1586 0 67 135 IFG 64 0 0
LABEL_LOOKUP_FAIL(D*) 0 82 RPLC_CPU 200 1586 0 67 135 IFG 64 0 0
MPLS_IPV4_OVER_IPV6_EXPLICIT_NULL(D*) 0 83 RPLC_CPU 200 1586 0 67 135 IFG 64 0 0
MPLS_TTL_EXPIRED 0 84 RPLC_CPU 200 1538 0 67 135 IFG 64 0 0
MPLS_TE_MIDPOPINT_LDP_LABELS_MISS(D*) 0 85 RPLC_CPU 200 1586 0 67 135 IFG 64 0 0
MPLS_ILM_VRF_LABEL_MISS(D*) 0 86 RPLC_CPU 200 1586 0 67 135 IFG 64 0 0
MPLS_PWE_PWACH 0 87 RPLC_CPU 205 1538 5 67 135 IFG 64 0 0
MPLS_VPN_TTL_ONE(D*) 0 88 RPLC_CPU 200 1586 0 67 135 IFG 64 0 0
MPLS_MISSING_FWD_LABEL_AFTER_POP(D*) 0 89 RPLC_CPU 200 1586 0 67 135 IFG 64 0 0
L3_IP_UNICAST_RPF(D*) 0 90 RPLC_CPU 200 1586 0 67 135 IFG 64 0 0
L3_IP_MULTICAST_RPF 0 91 RPLC_CPU 205 1538 5 67 135 IFG 64 0 0
L3_IP_MC_DROP(D*) 0 92 RPLC_CPU 200 1586 0 67 135 IFG 64 0 0
L3_IP_MC_PUNT_DC_PASS(D*) 0 93 RPLC_CPU 200 1586 0 67 135 IFG 64 0 0
L3_IP_MC_PUNT_RPF_FAIL 0 96 RPLC_CPU 205 1538 5 1000 949 IFG 64 0 0
L3_IP_MULTICAST_NOT_FOUND(D*) 0 98 RPLC_CPU 200 1586 0 67 135 IFG 64 0 0
L3_IP_MC_S_G_PUNT_MEMBER 0 99 RPLC_CPU 205 1538 5 67 135 IFG 64 0 0
L3_IP_MC_G_PUNT_MEMBER 0 100 RPLC_CPU 205 1538 5 67 135 IFG 64 0 0
L3_IP_MC_EGRESS_PUNT 0 101 RPLC_CPU 205 1538 5 67 135 IFG 64 0 0
ISIS/L3 0 102 RPLC_CPU 207 1538 7 10000 9866 IFG 1520 1930 0
L3_ISIS_DRAIN(D) 0 103 NPU_DROP --- --- --- ---------- ---------- --- N/A 0 0
L3_NO_HBM_ACCESS_DIP(D*) 0 104 RPLC_CPU 200 1586 0 67 135 IFG 64 0 0
L3_NO_HBM_ACCESS_SIP(D*) 0 105 RPLC_CPU 200 1586 0 67 135 IFG 64 0 0
L3_LPM_ERROR(D*) 0 106 RPLC_CPU 200 1586 0 67 135 IFG 64 0 0
L3_LPM_DROP(D*) 0 107 RPLC_CPU 200 1586 0 67 135 IFG 64 0 0
L3_LOCAL_SUBNET 0 108 RPLC_CPU 200 1538 0 67 135 IFG 64 0 0
L3_NO_LP_OVER_LAG_MAPPING(D*) 0 110 RPLC_CPU 200 1586 0 67 135 IFG 64 0 0
L3_EGRESS_MONITOR(D*) 0 112 RPLC_CPU 200 1586 0 67 135 IFG 64 0 0
L3_ACL_DROP(D) 0 113 NPU_DROP --- --- --- ---------- ---------- --- N/A 0 0
L3_ACL_FORCE_PUNT 0 114 RPLC_CPU 205 1538 5 67 135 IFG 64 0 0
L3_ACL_FORCE_PUNT1 0 115 RPLC_CPU 205 1538 5 67 135 IFG 64 0 0
L3_ACL_FORCE_PUNT2 0 116 RPLC_CPU 205 1538 5 67 135 IFG 64 0 0
L3_ACL_FORCE_PUNT3 0 117 RPLC_CPU 205 1538 5 67 135 IFG 64 0 0
L3_ACL_FORCE_PUNT4 0 118 RPLC_CPU 205 1538 5 67 135 IFG 64 0 0
L3_ACL_FORCE_PUNT5 0 119 RPLC_CPU 205 1538 5 67 135 IFG 64 0 0
L3_ACL_FORCE_PUNT6 0 120 RPLC_CPU 205 1538 5 67 135 IFG 64 0 0
L3_ACL_FORCE_PUNT7 0 121 RPLC_CPU 205 1538 5 67 135 IFG 64 0 0
GLEAN_ADJACENCY 0 122 RPLC_CPU 205 1538 5 67 135 IFG 64 0 0
INJECT_UP_L3_LOOKUP_FAIL 0 123 RPLC_CPU 206 1538 6 3000 2923 IFG 1520 1 0
L3_ROUTE_LOOKUP_FAILED 0 124 RPLC_CPU 201 1538 1 67 67 IFG 64 0 0
L3_NULL_ADJ(D*) 0 125 RPLC_CPU 200 1586 0 67 135 IFG 64 0 0
L3_USER_TRAP1(D*) 0 126 RPLC_CPU 200 1586 0 67 135 IFG 64 0 0
L3_USER_TRAP2(D*) 0 127 RPLC_CPU 200 1586 0 67 135 IFG 64 0 0
L3_LPM_DEFAULT_DROP(D*) 0 128 RPLC_CPU 200 1586 0 67 135 IFG 64 0 0
L3_LPM_INCOMPLETE0(D*) 0 129 RPLC_CPU 200 1586 0 67 135 IFG 64 0 0
L3_LPM_INCOMPLETE2(D*) 0 130 RPLC_CPU 200 1586 0 67 135 IFG 64 0 0
L3_BFD_MICRO_IP_DISABLED 0 131 RPLC_CPU 206 1538 6 500000 146163 IFG 1520 0 0
L3_NO_VNI_MAPPING(D*) 0 132 RPLC_CPU 200 1586 0 67 135 IFG 64 0 0
L3_NO_HBM_ACCESS_OG_SIP(D*) 0 133 RPLC_CPU 200 1586 0 67 135 IFG 64 0 0
L3_NO_HBM_ACCESS_OG_DIP(D*) 0 134 RPLC_CPU 200 1586 0 67 135 IFG 64 0 0
L3_NO_L3_DLP_MAPPING(D*) 0 135 RPLC_CPU 200 1586 0 67 135 IFG 64 0 0
L3_L3_DLP_DISABLED(D*) 0 136 RPLC_CPU 200 1586 0 67 135 IFG 64 0 0
L3_SPLIT_HORIZON(D*) 0 137 RPLC_CPU 200 1586 0 67 135 IFG 64 0 0
L3_MC_SAME_INTERFACE(D*) 0 138 RPLC_CPU 200 1586 0 67 135 IFG 64 0 0
L3_NO_VPN_LABEL_FOUND(D*) 0 139 RPLC_CPU 200 1586 0 67 135 IFG 64 0 0
TTL_OR_HOP_COUNT_1 0 140 RPLC_CPU 205 1538 5 67 135 IFG 64 0 0
MTU_EXCEEDED 0 141 RPLC_CPU 205 1538 5 2000 1898 IFG 64 0 0
L3_TX_FRR_DROP(D*) 0 142 RPLC_CPU 200 1586 0 67 135 IFG 64 0 0
L3_ENCAP_TABLE_MISS(D*) 0 143 RPLC_CPU 200 1586 0 67 135 IFG 64 0 0
OAMP_ETH_UNKNOWN_PUNT_REASON(D*) 0 144 RPLC_CPU 200 1586 0 67 135 IFG 64 0 0
OAMP_ETH_MEP_MAPPING_FAILED(D*) 0 145 RPLC_CPU 200 1586 0 67 135 IFG 64 0 0
OAMP_ETH_MP_TYPE_MISMATCH(D*) 0 146 RPLC_CPU 200 1586 0 67 135 IFG 64 0 0
OAMP_ETH_MEG_LEVEL_MISMATCH(D*) 0 147 RPLC_CPU 200 1586 0 67 135 IFG 64 0 0
OAMP_ETH_BAD_MD_NAME_FORMAT(D*) 0 148 RPLC_CPU 200 1586 0 67 135 IFG 64 0 0
OAMP_ETH_UNICAST_DA_NO_MATCH(D*) 0 149 RPLC_CPU 200 1586 0 67 135 IFG 64 0 0
OAMP_ETH_MULTICAST_DA_NO_MATCH(D*) 0 150 RPLC_CPU 200 1586 0 67 135 IFG 64 0 0
OAMP_ETH_WRONG_MEG_ID_FORMAT(D*) 0 151 RPLC_CPU 200 1586 0 67 135 IFG 64 0 0
OAMP_ETH_MEG_ID_NO_MATCH(D*) 0 152 RPLC_CPU 200 1586 0 67 135 IFG 64 0 0
OAMP_ETH_CCM_PERIOD_NO_MATCH(D*) 0 153 RPLC_CPU 200 1586 0 67 135 IFG 64 0 0
OAMP_ETH_CCM_TLV_NO_MATCH(D*) 0 154 RPLC_CPU 200 1586 0 67 135 IFG 64 0 0
OAMP_ETH_LMM_TLV_NO_MATCH(D*) 0 155 RPLC_CPU 200 1586 0 67 135 IFG 64 0 0
OAMP_ETH_NOT_SUPPORTED_OAM_OPCODE(D*) 0 156 RPLC_CPU 200 1586 0 67 135 IFG 64 0 0
OAMP_BFD_TRANSPORT_NOT_SUPPORTED(D*) 0 157 RPLC_CPU 200 1586 0 67 135 IFG 64 0 0
OAMP_BFD_SESSION_LOOKUP_FAILED(D*) 0 158 RPLC_CPU 200 1586 0 67 135 IFG 64 0 0
OAMP_BFD_INCORRECT_TTL(D*) 0 159 RPLC_CPU 200 1586 0 67 135 IFG 64 0 0
OAMP_BFD_INVALID_PROTOCOL(D*) 0 160 RPLC_CPU 200 1586 0 67 135 IFG 64 0 0
OAMP_BFD_INVALID_UDP_PORT(D*) 0 161 RPLC_CPU 200 1586 0 67 135 IFG 64 0 0
OAMP_BFD_INCORRECT_VERSION(D*) 0 162 RPLC_CPU 200 1586 0 67 135 IFG 64 0 0
OAMP_BFD_INCORRECT_ADDRESS(D*) 0 163 RPLC_CPU 200 1586 0 67 135 IFG 64 0 0
OAMP_BFD_MISMATCH_DISCR 0 164 RPLC_CPU 206 1538 6 500000 485992 IFG 64 0 0
OAMP_BFD_STATE_FLAG_CHANGE 0 165 RPLC_CPU 206 1538 6 500000 146163 IFG 1520 0 0
OAMP_BFD_SESSION_RECEIVED(D) 0 166 NPU_DROP --- --- --- ---------- ---------- --- N/A 0 0
OAMP_PFC_LOOKUP_FAILED(D*) 0 167 RPLC_CPU 200 1586 0 67 135 IFG 64 0 0
OAMP_PFC_DROP_INVALID_RX(D*) 0 168 RPLC_CPU 200 1586 0 67 135 IFG 64 0 0
APP_SGACL_DROP(D*) 0 170 RPLC_CPU 200 1586 0 67 135 IFG 64 0 0
APP_SGACL_LOG(D*) 0 171 RPLC_CPU 200 1586 0 67 135 IFG 64 0 0
Telemetry Configuration
For this article, dial-in Model-Driven Telemetry is used with gNMI.
gNMI is gRPC Network Management Interface developed by Google. It provides the mechanism to install, manipulate, and delete the configuration of network devices, but also to view operational data. The content provided through gNMI can be modeled using YANG.
gNMI supports a dial-in session where a client connects to the router via gRPC server with the gNMI specification. Cisco 8000 can act as a gRPC server with following minimal configuration:
grpc
 no-tls
 address-family ipv4
By default, gRPC listens on port 57400:
RP/0/RP0/CPU0:8202-1#sh grpc

Address family              : ipv4
Port                        : 57400
DSCP                        : Default
VRF                         : global-vrf
Server                      : enabled
TLS                         : disabled
TLS mutual                  : disabled
Trustpoint                  : none
Maximum requests            : 128
Maximum requests per user   : 10
Maximum streams             : 32
Maximum streams per user    : 32

TLS cipher suites
  Default                   : none
  Enable                    : none
  Disable                   : none

  Operational enable        : none
  Operational disable       : none
Info: It’s possible to activate gRPC in a VRF, with TLS, enable IPv6 or change gRPC port. Please refer to the Cisco 8000 programmability configuration guide.
As usual with telemetry, 3 pieces are needed:
- Telegraf, an open-source agent, is used for this lab demonstration. Telegraf collects metrics from the Cisco 8000 and sends them to a Time Series Database (TSDB).
- InfluxDB is used here to store the counters.
- Last, a visualization engine is required to display and analyze the metrics. Grafana is probably the most popular tool used for this role today.
Those 3 tools are often referred as the TIG stack (Telegraf, InfluxDB, and Grafana).
Warning: This article will not describe telemetry stack installation, optimization, or maintenance.
Telegraf has a built-in gNMI input plugin with documentation available here. Cisco 8000 NPU traps counters are exposed through the Open Forwarding Abstraction (OFA) operational YANG model: Cisco-IOS-XR-ofa-npu-stats-oper.
Here is the telegraf.conf configuration used for this demo:
[[inputs.gnmi]]
  ## Address and port of the gNMI GRPC server (Cisco 8000)
  addresses = ["10.89.202.78:57400"]
  ## define credentials
  username = "cisco"
  password = "lab123"
  ## gNMI encoding requested (one of: "proto", "json", "json_ietf", "bytes")
  encoding = "proto"
  ## redial in case of failures after
  redial = "10s"
  ## enable client-side TLS and define CA to authenticate the device
  enable_tls = false
  insecure_skip_verify = true

  [[inputs.gnmi.subscription]]
    ## Name of the measurement that will be emitted
    name = "NPU-TRAPS"
    ## Origin and path of the subscription
    origin = "Cisco-IOS-XR-ofa-npu-stats-oper"
    path = "/ofa/stats/nodes/node/npu-numbers/npu-number/display/trap-ids/trap-id"
    # Subscription mode (one of: "target_defined", "sample", "on_change") and interval
    subscription_mode = "sample"
    sample_interval = "10s"
If JSON IETF is used for encoding, some counters might show as strings, which could prevent their visualization later in Grafana. This behavior is compliant with RFC 7951 - JSON Encoding of Data Modeled with YANG , section 6.1 (Numeric Types):
“A value of the “int64”, “uint64”, or “decimal64” type is represented as a JSON string”.
In this case, it’s required to use a Telegraf processor to transform a field from string to integer. Extra telegraf.conf can be used to change packet-accepted and packet-dropped fields:
[[processors.converter]]
  [processors.converter.fields]
    integer = ["packet-*"]
Once Telegraf starts collection, following log can be seen from the router:
RP/0/RP0/CPU0:Apr 19 06:56:26.915 UTC: emsd[1099]: %MGBL-EMS-6-TELEMETRY_SUBSCRIBE : gNMI: Start of request 1 from client 1.63.51.21:38332
Additional subscription details can be retrieved through CLI:
RP/0/RP0/CPU0:8202-1#sh telemetry model-driven subscription
Subscription:  GNMI__16189630622979593403  State: ACTIVE
-------------
  Sensor groups:
  Id                               Interval(ms)        State
  GNMI__16189630622979593403_0     10000               Resolved

  Destination Groups:
  Id                 Encoding            Transport   State   Port    Vrf                               IP
  GNMI_1001          gnmi-proto          dialin      Active  38332                                     1.63.51.21
    TLS :             False

RP/0/RP0/CPU0:8202-1#sh telemetry model-driven sensor-group
  Sensor Group Id:GNMI__16189630622979593403_0
    Sensor Path:        Cisco-IOS-XR-ofa-npu-stats-oper:ofa/stats/nodes/node/npu-numbers/npu-number/display/trap-ids/trap-id
    Sensor Path State:  Resolved
Dashboard Creation
An interesting dashboard would be to graph evolution of accepted and dropped packets over a period of time to get a packet-per-second rate.
Before creating the dashboard, verification must be done to ensure counters are properly stored in the TSDB. Influx client is used to interact directly with the database:
# influx
Connected to http://localhost:8086 version 1.8.3
InfluxDB shell version: 1.8.3
> connect 8000-jump.sp-tme-lab.com
> use telemetry
Using database telemetry
> show MEASUREMENTS
name: measurements
name
----
Cisco-IOS-XR-fib-common-oper:fib/nodes/node/protocols/protocol/fib-summaries/fib-summary
Cisco-IOS-XR-platforms-ofa-oper:ofa/stats/nodes/node/Cisco-IOS-XR-8000-platforms-npu-resources-oper:hw-resources-datas/hw-resources-data
NPU-TRAPS
>    show FIELD KEYS FROM "NPU-TRAPS"
name: NPU-TRAPS
fieldKey        fieldType
--------        ---------
avg_pkt_size    integer
cfg_rate        integer
cir_hw_rate     integer
encap_id        integer
fec_id          integer
gport           integer
id              integer
mc_group        integer
npu_id          integer
offset          integer
packet_accepted integer
packet_dropped  integer
policer_id      integer
priority        integer
punt_tc         integer
punt_vlan       integer
punt_vo_q       integer
stats_id        integer
trap_id_xr      integer
trap_strength   integer
trap_string     string
Each NPU trap is uniquely defined within the system with a (Trap ID, NPU ID, Node Name) triplet. To get a packet rate, Influx QL derivative function is used.
To achieve this, following InfluxDB query can be used:
`>` SELECT derivative("packet_accepted", 1s) FROM "NPU-TRAPS" WHERE ("source" = '10.89.202.78' AND "node_name" = '0/RP0/CPU0' AND "npu_id" = 0) GROUP BY "trap_id"

name: NPU-TRAPS
tags: trap_id=0
time                derivative
----                ----------
1650398267529000000 0
1650398277529000000 0
1650398287529000000 0
-snip-
Info: Derivative function is also available with Flux language. This is out of this article scope.
Warning: npu_id filter doesn’t use double quotes marks. Reason is npu_id is stored as integer, not a string.
On Grafana, a new dashboard can be created. By default legend is automatically generated with the measurement name, the function applied and the NPU trap ID. To make it shorter, trap_id will be used instead and extra configuration must be added in the ‘Alias by’ box: [[tag_trap_id]].
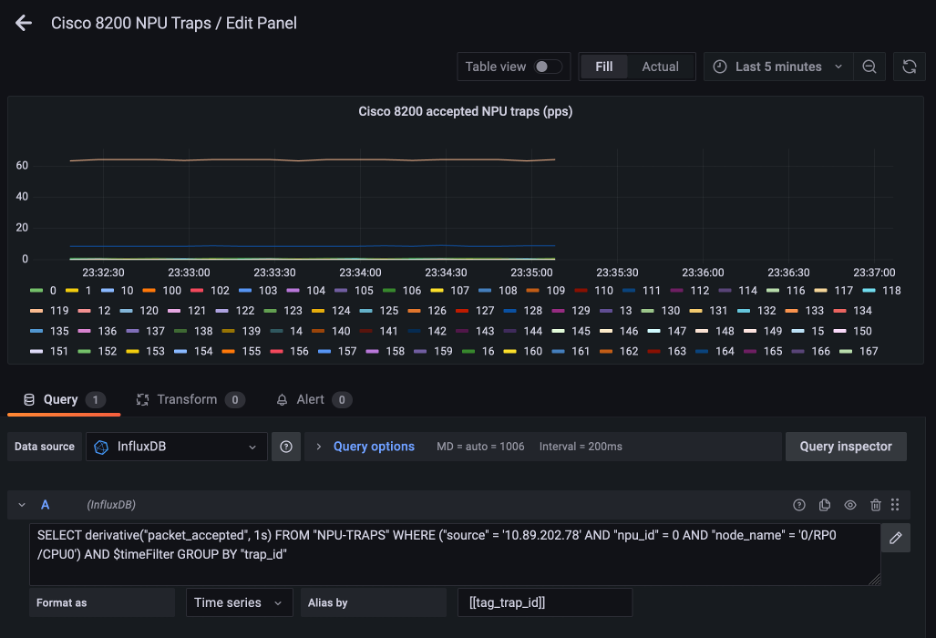
Grafana ‘alias by’ feature requires utilization of a tag. Unfortunately the NPU trap string from the OFA model is not a tag and cannot be used to generate the legend automatically with the trap name:
>    show TAG KEYS FROM "NPU-TRAPS"
name: NPU-TRAPS
tagKey
------
host
node_name
npu_id
path
source
trap_id
As of today, there is no equivalent of [[embedded_tag]] on Telegraf for gNMI plugin. While gNMI dynamic tagging should provide similar feature, ‘tag_only = true’ extra config doesn’t work for this model. Issue #11007 was raised.
To get NPU traps name in the legend, another option is to use Grafana Transformation and provide a hard-mapping between trap-id and trap-string inside the dashboard. A sample dashboard JSON example is attached here.
NPU Traps Policing in Action
To hit NPU traps and see policing in action, an IPv6 ACL dropping all traffic is configured on a lab router interface. A traffic generator is used to send 1M pps of IPv6 traffic. This is what can be observed on the dashboard:
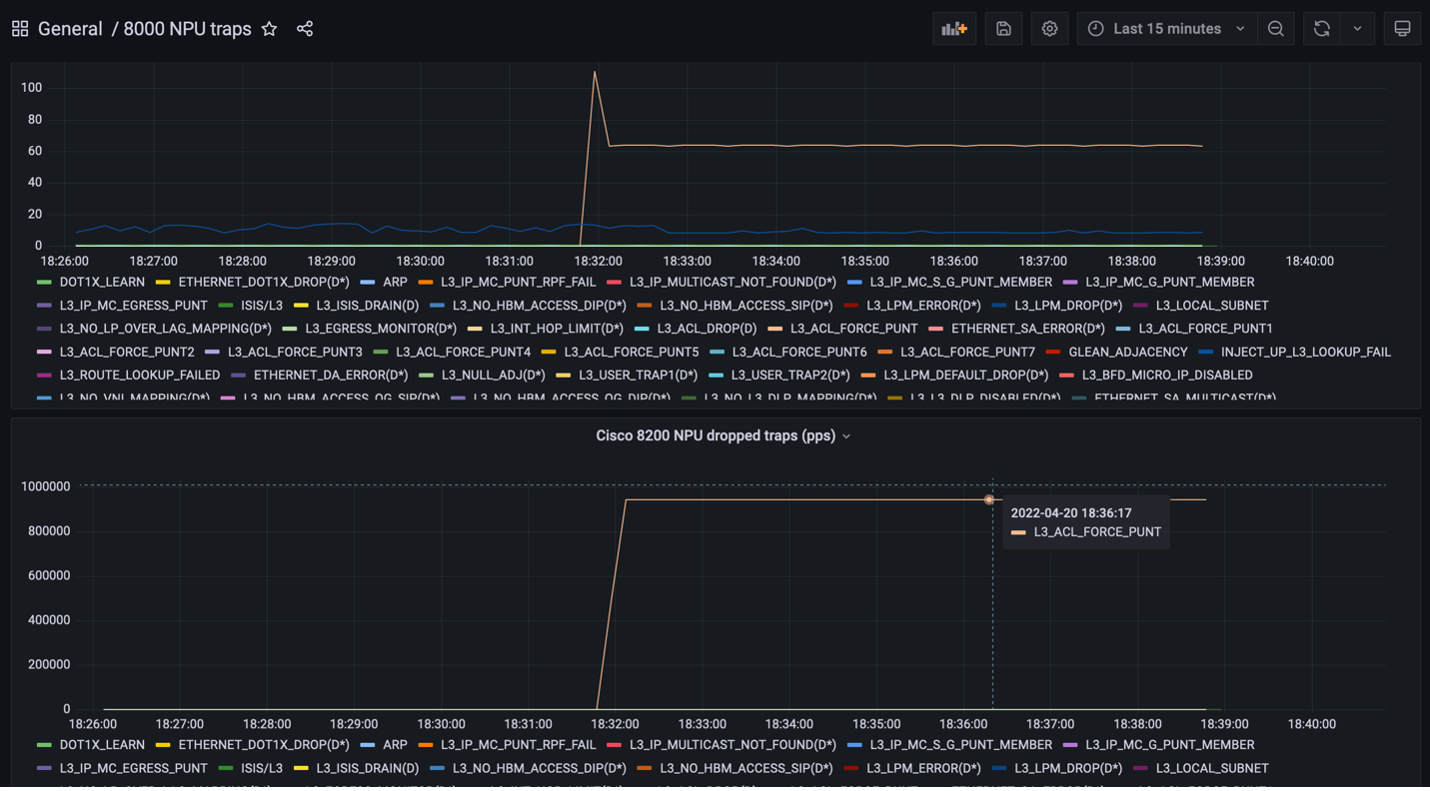
Traffic hits L3_ACL_FORCE_PUNT NPU trap. 67pps of traffic is accepted and punted to the CPU while the rest is dropped by the policer. This is expected and aligned with what’s programmed on router:
RP/0/RP0/CPU0:GW-3#sh controllers npu stats traps-all instance all location all | i "Type|pps|L3_ACL_FORCE_PUNT"
Wed Apr 20 16:46:49.040 UTC
"Configured Rate" is the rate configured by user (or default setting) in pps at the LC level
        The per IFG meter is converted from the user configured/default rate (pps)
Trap Type                                     NPU  Trap  Punt       Punt  Punt  Punt Configured Hardware   Policer Avg-Pkt Packets              Packets
                                              ID   ID    Dest       VoQ   VLAN  TC   Rate(pps)  Rate(pps)  Level   Size    Accepted             Dropped
L3_ACL_FORCE_PUNT                             0    119  RPLC_CPU    205   1538  5    67         135        IFG     64      58130                846169055
-snip-
Conclusion and Acknowledgement
This article covered how to collect Cisco 8000 NPU traps using telemetry. The post went through Telegraf gNMI configuration and Grafana dashboard construction. Last, a lab scenario demonstrated the telemetry solution and NPU traps mechanism in action.
I would like to thanks Chetan Francis Pinto, Jeffrey Liang, Nick Corra, Lokesh Khanna who provided support for this post and last but not least, Cristina Precup who spent precious time debugging with me.
Leave a Comment