
On-box Telemetry: Running Pipeline and Kafka on IOS-XR (6.2.1+)
Streaming Telemetry
If you haven’t checked out the great set of tutorials from Shelly Cadora and team on the Telemetry page of xrdocs: https://xrdocs.github.io/telemetry/tutorials, it’s time to dive in.
Streaming Telemetry in principle is tied to our need to evolve network device monitoring, above and beyond the capabilities that SNMP can provide.
To get started, check out the following blogs:
The running theme through the above set of blogs is clear: We need a consistent, model-driven method of exposing operational data from Network devices (read Yang Models: Openconfig, Vendor specific, and IETF) and PUSH the data over industry accepted transport protocols like GRPC or plain TCP/UDP to external Telemetry receivers. This is where IOS-XR really excels.
The move from pull (SNMP style) to a push-based model for gathering Telemetry data is crucial to understand. It allows operational data to be collected at higher rates and higher scale (been shown and tested to be nearly 100x more effective than SNMP).
Consequently, there is greater focus on tools that can help consume this large amount of data off-box. There are a variety of tools (opensource and otherwise) available for big data consumption: Apache Kafka, Prometheus, influxDB stack, SignalFX etc.
A tool we recently open-sourced in this space with complete support for Model Driven Telemetry on IOS-XR (6.0.1+) that, as the name suggests, serves as a pipe/conduit between IOS-XR (over TCP, UDP or GRPC) on the input side and a whole host of tools (Kafka, influxDB, prometheus etc.) on the output side is called Pipeline. You can find it on Github. Find more about it here and here.
What is on-box Telemetry?
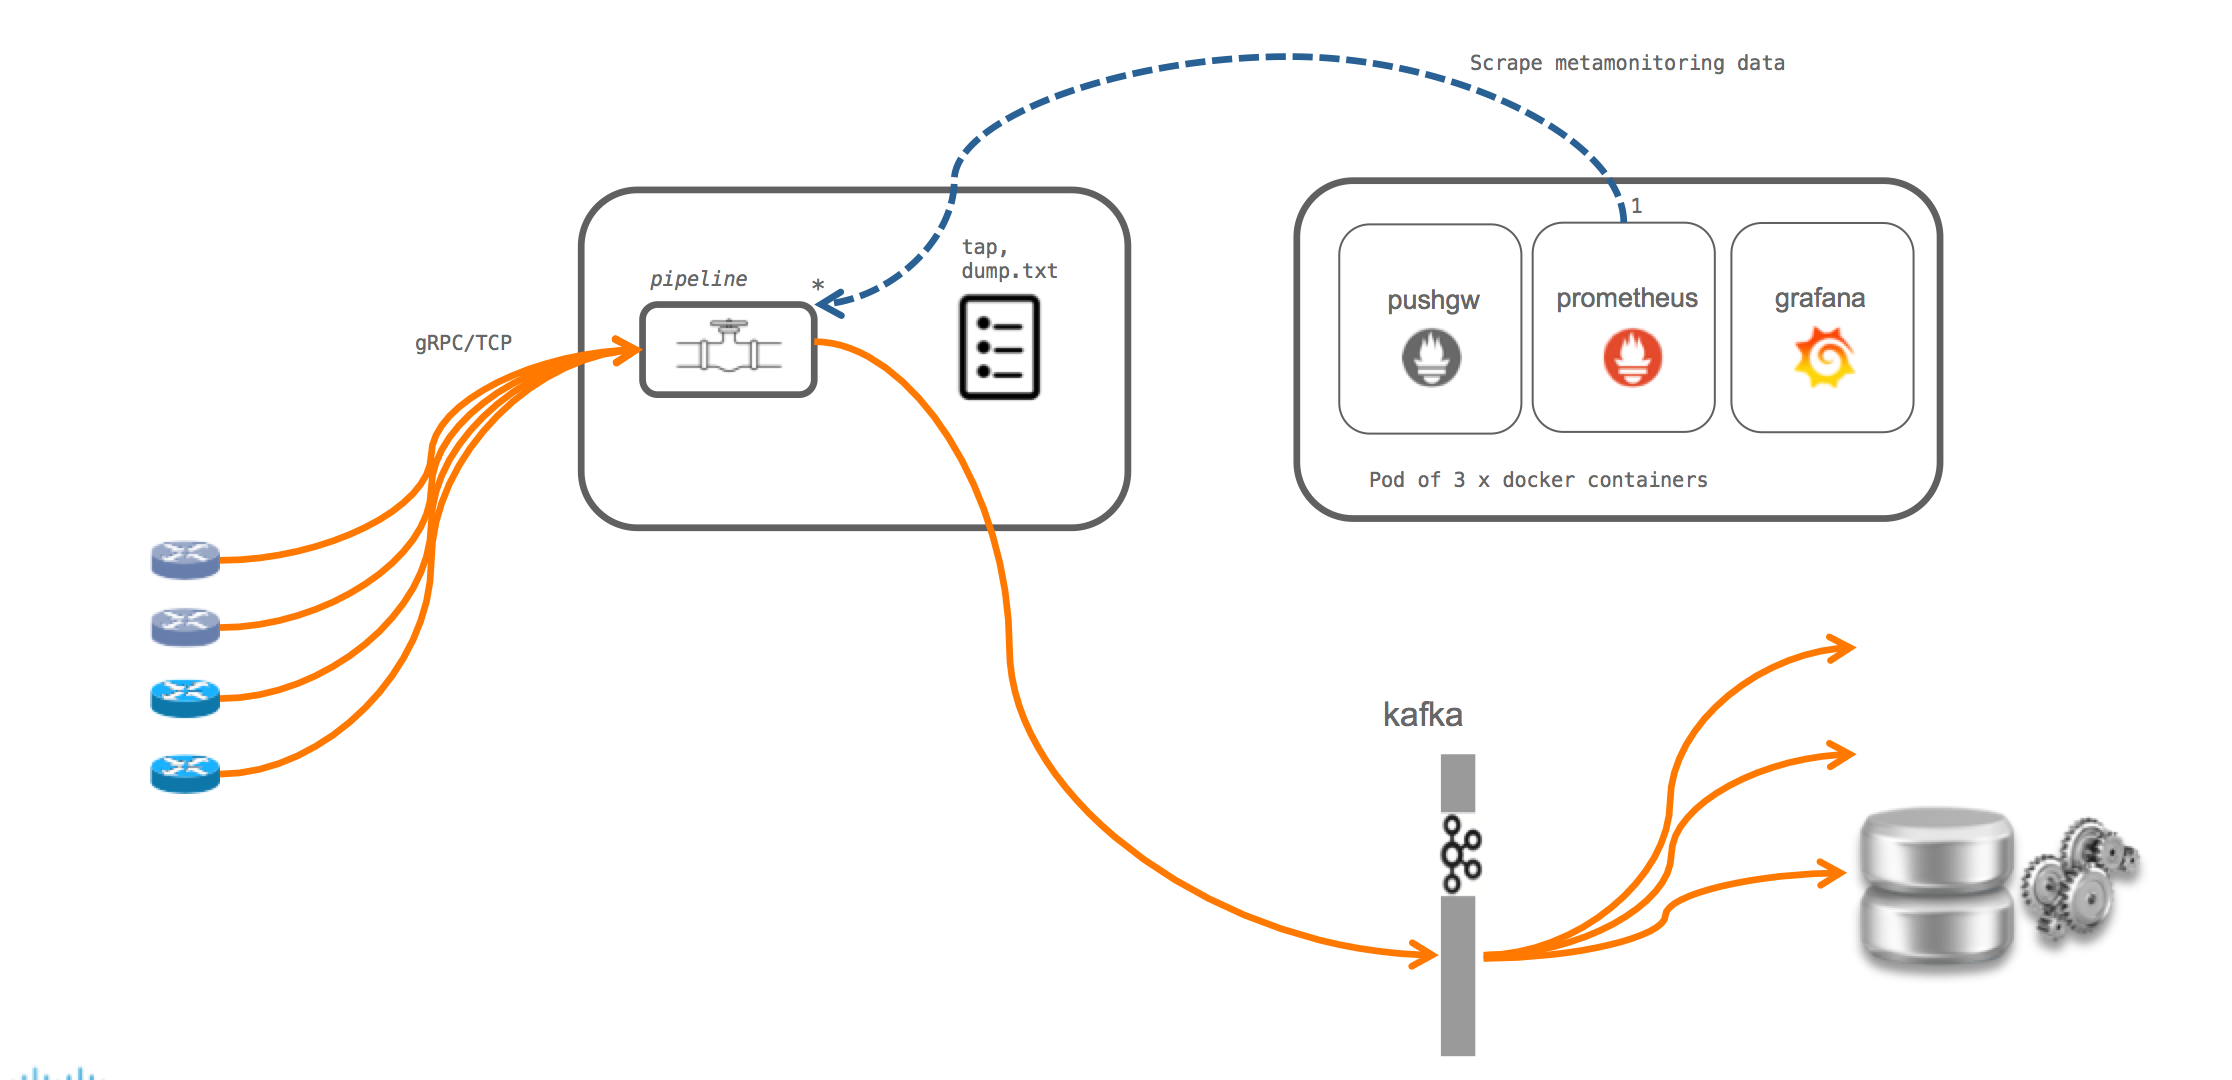
There is no one-size-fits-all technique for monitoring and managing network devices. There are a lot of network operators that will follow the typical approach: Set up the Model Driven Telemetry on IOS-XR and stream operational data to an external receiver or set of receivers. This is shown below. Pipeline as mentioned earlier, is used as a conduit to a set of tools like Kafka,prometheus etc.
However, quite a few of our users have come and asked us if it’s possible to have a telemetry receiver run on the router inside a container (lxc or docker) so that applications running locally inside the container can take actions based on Telemetry data.
This may be done for different reasons:
Users may choose to simplify their server environment and not run external services (like
Kafka, influxDB stack or prometheus/Grafana etc.). Typically, some
background in devops engineering is often important to understand how to scale out these services and process large amounts of data coming from all routers at the same time.The alerts or the remediation actions that a user intends to perform based on the Telemetry data received may be fairly simplistic and can be done on box.
Bear in mind that running onbox does come with its own concerns. Network devices typically have limited compute capacity (CPU/RAM) and limited disk capacity. While CPU/RAM isolation can be achieved using Containers on box, managing the disk space on each individual router does require special care when dealing with Streaming Telemetry applications.
Docker container to host Pipeline + Kafka
In this tutorial, we look at using a Docker container to host Pipeline and Kafka (with zookeper) as a Telemetry receiver. Further a simple Kafka consumer is written in python to interact with Kafka and take some sample action on a Telemetry data point.
If you haven’t had a chance to learn how we enable hosting for Docker containers on IOS-XR platforms and how we set up routing capabilities within the container, take a look at the following section of our detailed Docker guide for IOS-XR:
As shown in the platform specific sections below, the pipeline-kafka combination runs as a Docker container onbox. Some specifics on the setup:
In IOS-XR 6.2.1 (before 6.3.1) only global-vrf is supported in the linux kernel.
The docker container is launched with the global-vrf network namespace mounted inside the container.
The pipeline and kafka instances are launched inside the global-vrf network namespace and listen on all visible XR IP addresses in the kernel (Data ports in global-vrf, Management port in Global-vrf, loopback interfaces in global-vrf).
The ports and listening IP selected by pipeline can be changed by the user during docker bringup itself by mounting a custom pipeline.conf (shown in subsequent sections).
The XR telemetry process is configured to send Telemetry data to pipeline over
- Transport = UDP (only UDP is supported for onbox telemetry) and
- Destination address = listening IP address (some local XR IP) for pipeline.
NCS5500/Vagrant On-Box Telemetry Setup
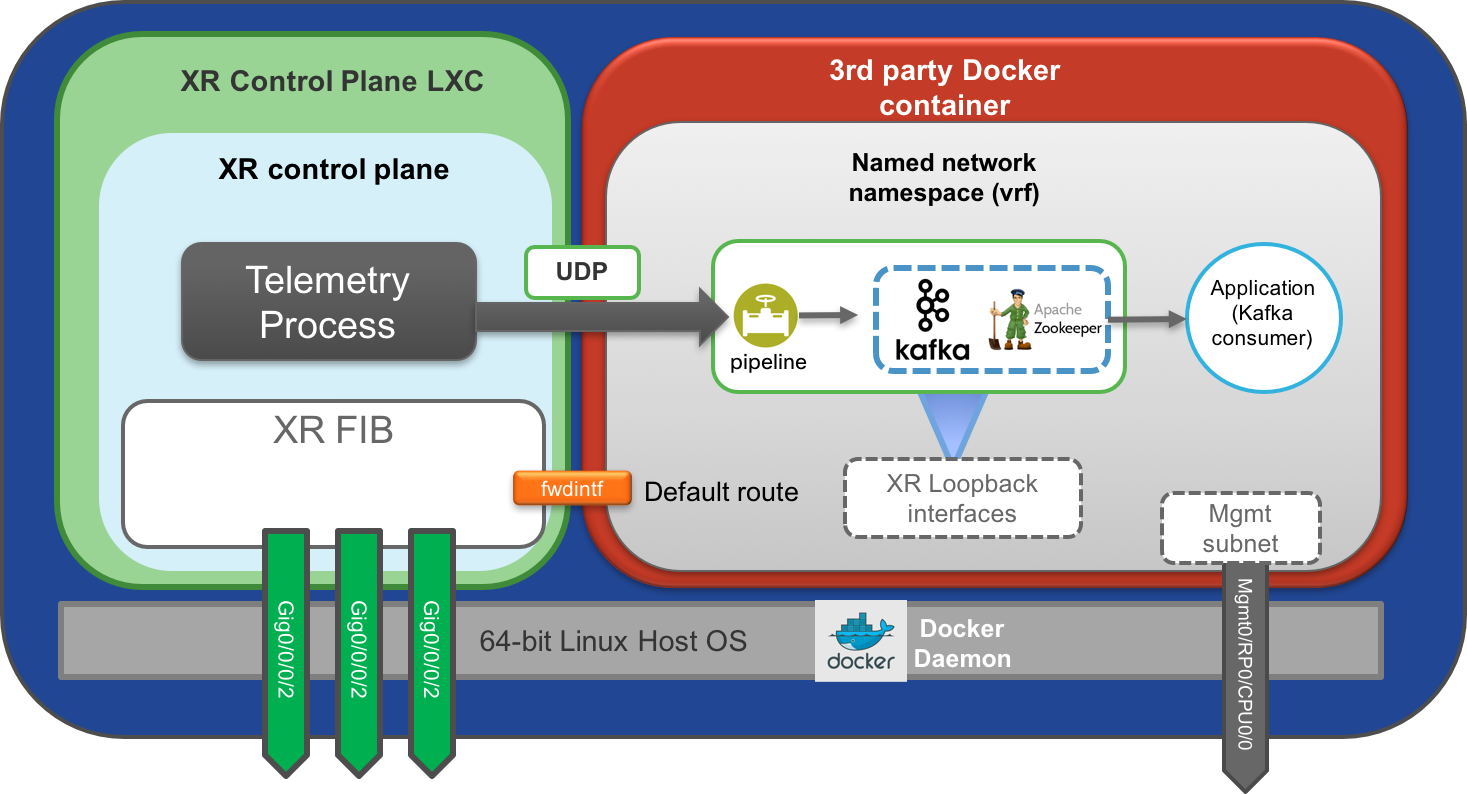
The docker daemon on NCS5500, NCS5000, XRv9k and Vagrant XR (IOS-XRv64) platforms runs on the Host layer at the bottom. The onbox telemetry setup will thus look something like:
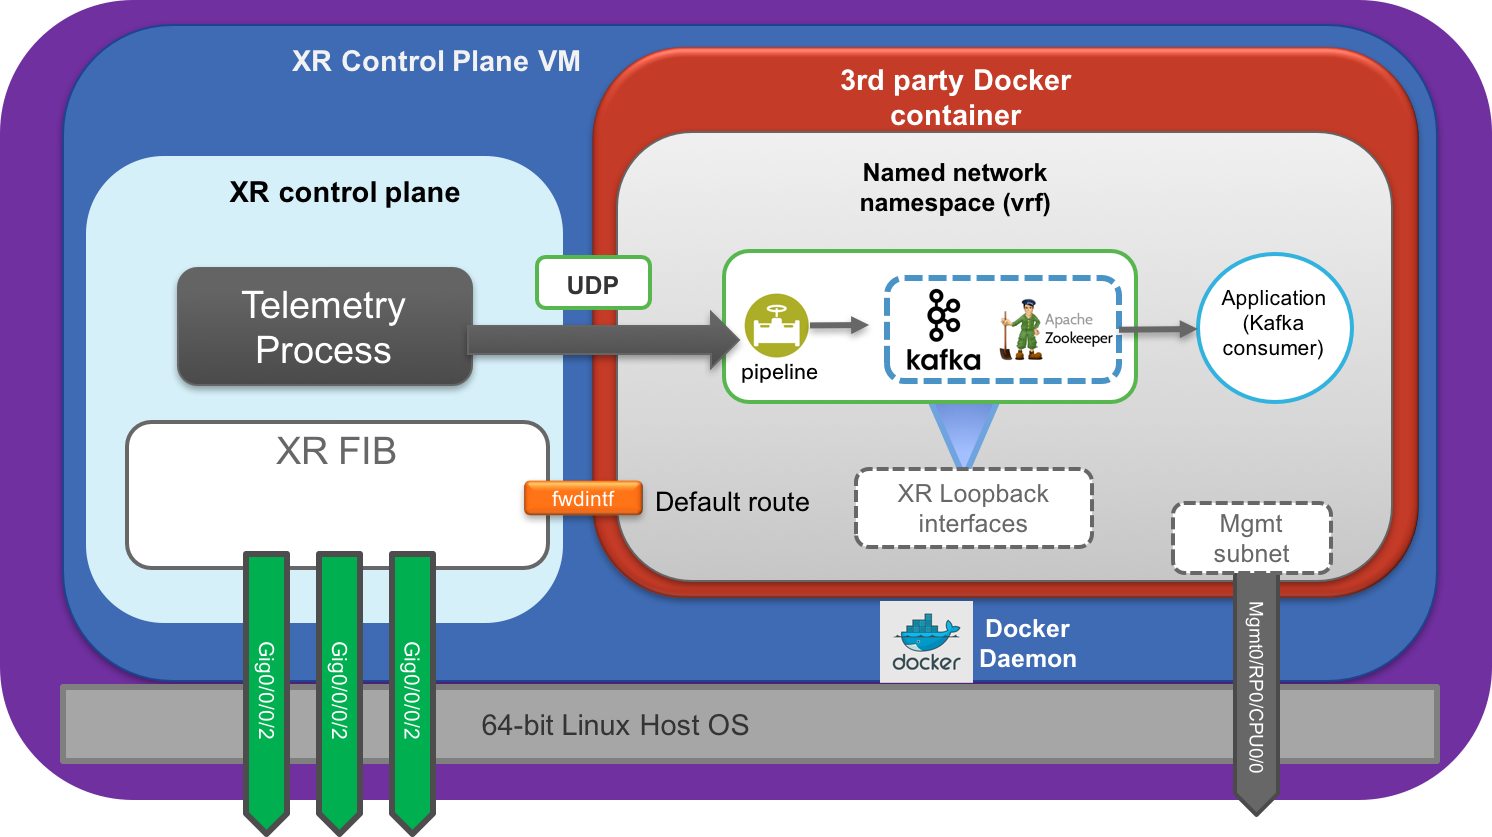
ASR9k On-Box Telemetry Setup
On ASR9k, the setup is the same from the user perspective. But for accuracy, the Docker daemon runs inside the XR VM in this case, as is shown below.
It is recommended to host onbox daemons (in this case Kafka, pipeline, zookeeper) on either the all IP address (0.0.0.0) or on XR loopback IP addresses. This makes sure that these daemons stay up and available even when a physical interface goes down.
Docker image for Pipeline+Kafka
While a user is welcome to build their own custom Docker images, we have a base image that can take care of installation of pipeline and Kafka+zookeeper for you and is already available on Docker hub:
This image is built out automatically from the following github repo:
We will utilize this image and build our own custom variant to run on an IOS-XR box for onbox telemetry.
Building a Pipeline-kafka Docker image for IOS-XR
To build our own Docker image, you need a development environment with Docker engine installed.
This is basically the devbox environment that we have setup in earlier tutorials. To understand how to do this, follow the steps below (in order) from the Docker guide for IOS-XR:
Pre-requisites: Setup your Vagrant environment and/or physical boxes (ASR9k, NCS5500 etc.)
**Important:** If you're using the Vagrant setup for this tutorial, bear in mind that the default Vagrant image runs in 4G RAM. Since the docker image we host on the router is relatively resource intensive, we will need to increase the memory for our Vagrant IOS-XR instance to atleast 5G (5120 MB). This can be done easily by modifying the `Vagrantfile` in your directory and adding the following:config.vm.define "rtr" do |node| ############## SNIP ############# node.vm.provider "virtualbox" do |v| v.memory = 5120 end end config.vm.define "devbox" do |node| node.vm.box = "ubuntu/trusty64" ############## SNIP ##############Set up your topology: Understand the Topology
Set up the Devbox environment: Install docker-engine on the devbox
Clone Github repo
Now that you have a running devbox environment, let’s clone the github-repo for the pipeline-kafka project:
we use –recursive to make sure all the submodules get pulled as well. The submodules are actual github repos for the standalone pipeline and docker-kafka projects.
vagrant@vagrant-ubuntu-trusty-64:~$
vagrant@vagrant-ubuntu-trusty-64:~$ git clone --recursive https://github.com/ios-xr/pipeline-kafka
Cloning into 'pipeline-kafka'...
remote: Counting objects: 38, done.
remote: Compressing objects: 100% (30/30), done.
remote: Total 38 (delta 15), reused 20 (delta 4), pack-reused 0
Unpacking objects: 100% (38/38), done.
Checking connectivity... done.
Submodule 'bigmuddy-network-telemetry-pipeline' (https://github.com/cisco/bigmuddy-network-telemetry-pipeline) registered for path 'bigmuddy-network-telemetry-pipeline'
Submodule 'docker-kafka' (https://github.com/spotify/docker-kafka) registered for path 'docker-kafka'
Cloning into 'bigmuddy-network-telemetry-pipeline'...
remote: Counting objects: 14615, done.
remote: Compressing objects: 100% (8021/8021), done.
remote: Total 14615 (delta 3586), reused 0 (delta 0), pack-reused 3349
Receiving objects: 100% (14615/14615), 43.97 MiB | 2.02 MiB/s, done.
Resolving deltas: 100% (4012/4012), done.
Checking connectivity... done.
Submodule path 'bigmuddy-network-telemetry-pipeline': checked out 'a57e87c59ac220ad7725b6b74c3570243e1a4ac3'
Cloning into 'docker-kafka'...
remote: Counting objects: 98, done.
remote: Total 98 (delta 0), reused 0 (delta 0), pack-reused 98
Unpacking objects: 100% (98/98), done.
Checking connectivity... done.
Submodule path 'docker-kafka': checked out 'fc8cdbd2e23a5cac21e7138d07ea884b4309c59a'
vagrant@vagrant-ubuntu-trusty-64:~$
vagrant@vagrant-ubuntu-trusty-64:~$
vagrant@vagrant-ubuntu-trusty-64:~$ cd pipeline-kafka/iosxr_dockerfile/
vagrant@vagrant-ubuntu-trusty-64:~/pipeline-kafka/iosxr_dockerfile$ ls
Dockerfile  kafka_consumer.py
vagrant@vagrant-ubuntu-trusty-64:~/pipeline-kafka/iosxr_dockerfile$
Understand the Dockerfile
Let’s take a look at the Dockerfile under the iosxr_dockerfile folder:
vagrant@vagrant-ubuntu-trusty-64:~/pipeline-kafka/iosxr_dockerfile$ cat Dockerfile
FROM akshshar/pipeline-kafka:latest

Maintainer akshshar

# Specify the "vrf" you want to run daemons in during build time
# By default, it is global-vrf

ARG vrf=global-vrf

# Set up the ARG for use by Entrypoint or CMD scripts
ENV vrf_exec "ip netns exec $vrf"

# Add a sample kafka_consumer.py script. User can provide their own
ADD kafka_consumer.py /kafka_consumer.py


CMD $vrf_exec echo "127.0.0.1 localhost" >> /etc/hosts && $vrf_exec supervisord -n
Let’s break it down:
All the references below to Dockerfile instructions are derived from official Dockerfile Documentation:
https://docs.docker.com/engine/reference/builder/#known-issues-run
ARG vrf=global-vrf
We setup the script to accept arguments from the user during build time. This will allow us to be flexible in specifying the vrf (network namespace) to spin up the daemons in, in the future. Today in 6.2.1 (before 6.3.1), only global-vrf is supported.
ENV vrf_exec "ip netns exec $vrf"
In Dockerfiles, the ARG variables are rejected in the ENTRYPOINT or CMD instructions. So we set up an ENV variable (which is honored) to create a command prefix necessary to execute a command in a given network namespace (vrf).
ADD kafka_consumer.py /kafka_consumer.py
We place the sample application (in this case written in python) inside the image to act as a consumer of the Telemetry data pushed to Kafka. This application can contain custom triggers to initiate alerts or other actions. For this tutorial, we will initiate the script manually post launch of the container. The user can choose to start the application by default as part of the ENTRYPOINT or CMD instructions in the dockerfile.
CMD $vrf_exec echo "127.0.0.1 localhost" >> /etc/hosts && $vrf_exec supervisord -n
This specifies the command that will be run inside the container post boot. The first part of the command $vrf_exec echo "127.0.0.1 localhost" >> /etc/hosts sets up /etc/hosts with an entry for localhost making it easier for kafka and applications to talk to each other locally. The second part of the command $vrf_exec supervisord -n is used to start all the services in the correct vrf (hence the $vrf_exec).
We use supervisord to easily specify multiple daemons that need to be launched (pipeline, kafka, zookeeper). You can get more details on supervisord here: http://supervisord.org/
Build the Docker image
Issue a docker build in the same folder and let’s tag it as pipeline-kafka-xr:latest
vagrant@vagrant-ubuntu-trusty-64:~/pipeline-kafka/iosxr_dockerfile$ sudo docker build -t pipeline-kafka-xr .
Sending build context to Docker daemon  3.584kB
Step 1/6 : FROM akshshar/pipeline-kafka:latest
latest: Pulling from akshshar/pipeline-kafka
5040bd298390: Pull complete
fce5728aad85: Pull complete
c42794440453: Pull complete
0c0da797ba48: Pull complete
7c9b17433752: Pull complete
114e02586e63: Pull complete
e4c663802e9a: Pull complete
efafcf20d522: Pull complete
b5a0de42a291: Pull complete
e36cca8778db: Pull complete
c3626ac93375: Pull complete
3b079f5713c1: Pull complete
2ac62e83a2a3: Pull complete
5fe3b4ab290e: Pull complete
08b6bc2f514b: Pull complete
b86ae3d2d58d: Pull complete
Digest: sha256:164adfb0da7f5a74d3309ddec4bc7078a81dcd32591cdb72410eccaf1448d88c
Status: Downloaded newer image for akshshar/pipeline-kafka:latest
 ---> 0f131a6f1d8c
Step 2/6 : MAINTAINER akshshar
 ---> Running in 4da444d1b027
 ---> e21b468c12b5
Removing intermediate container 4da444d1b027
Step 3/6 : ARG vrf=global-vrf
 ---> Running in 5cdb3d4eecdf
 ---> e347fe8cd7d9
Removing intermediate container 5cdb3d4eecdf
Step 4/6 : ENV vrf_exec "ip netns exec $vrf"
 ---> Running in 6601c66ff5fb
 ---> 6104847fbe17
Removing intermediate container 6601c66ff5fb
Step 5/6 : ADD kafka_consumer.py /kafka_consumer.py
 ---> 6cf31ccbf679
Removing intermediate container 72d2b0320cf2
Step 6/6 : CMD $vrf_exec echo "127.0.0.1 localhost" >> /etc/hosts && $vrf_exec supervisord -n
 ---> Running in 8c44808a44e6
 ---> d9c6ec3671c0
Removing intermediate container 8c44808a44e6
Successfully built d9c6ec3671c0
vagrant@vagrant-ubuntu-trusty-64:~/pipeline-kafka/iosxr_dockerfile$
You should now have the docker image available on the devbox:
vagrant@vagrant-ubuntu-trusty-64:~/pipeline-kafka/iosxr_dockerfile$ sudo docker images
REPOSITORY                TAG                 IMAGE ID            CREATED              SIZE
pipeline-kafka-xr         latest              d9c6ec3671c0        About a minute ago   676MB
akshshar/pipeline-kafka   latest              0f131a6f1d8c        5 hours ago          676MB
vagrant@vagrant-ubuntu-trusty-64:~/pipeline-kafka/iosxr_dockerfile$
Pull Docker image on the router
There are multiple ways in which the freshly created Docker image could be transferred to the IOS-XR router. These methods are discussed in detail in the Docker Guide for IOS-XR. Choose your poison :) :
Launch the Docker container
Let’s assume you chose one of the above methods and pulled the docker container onto the router. In the end, you should see on the router’s linux shell:
[xr-vm_node0_RP0_CPU0:~]$ sudo -i
[xr-vm_node0_RP0_CPU0:~]$ docker images
REPOSITORY          TAG                 IMAGE ID            CREATED             SIZE
pipeline-kafka-xr   latest              d9c6ec3671c0        34 minutes ago      676.4 MB
[xr-vm_node0_RP0_CPU0:~]$
The name of the image may be different based on the “docker pull” technique you use.
Create a custom pipeline.conf
Before we spin up the container, let’s create a custom pipeline.conf file.
A sample pipeline.conf can be found here: https://github.com/cisco/bigmuddy-network-telemetry-pipeline/blob/master/pipeline.conf
On-box telemetry in 6.2.1 only works over UDP as transport. Support for TCP and GRPC dial-in/dial-out will come soon
Considering the above limitation, we modify pipeline.conf to only enable UDP as an input transport. Further, we’ll point pipeline to Kafka as an output stage. In the end, the relevant lines in my custom pipeline.conf are shown below:
[xr-vm_node0_RP0_CPU0:~]$ grep -v "^#" /misc/app_host/pipeline.conf
[default]

id = pipeline


[mykafka]
stage = xport_output
type = kafka
encoding = json
brokers = localhost:9092
topic = telemetry
datachanneldepth = 1000


[udpin]
type = udp
stage = xport_input
listen = 1.1.1.1:5958
encap = st
logdata = off

[xr-vm_node0_RP0_CPU0:~]$
Let me break down the above output:
[udpin] specifies UDP as the input transport for pipeline and forces pipeline to listen on 1.1.1.1:5958. What is 1.1.1.1 : Address of one of the loopbacks in IOS-XR config as shown below:
RP/0/RSP1/CPU0:asr9k#show  running-config  int loopback 0
Thu Apr 13 16:21:57.749 UTC
interface Loopback0
 ipv4 address 1.1.1.1 255.255.255.255
!
RP/0/RSP1/CPU0:asr9k#
Be a little careful here. Do not select loopback1 IP address or any explicitly configured east- west interface for TPA. To understand more on TPA east-west IP addresses, see here: https://xrdocs.github.io/application-hosting/blogs/2016-06-28-xr-app-hosting-architecture-quick-look/
[mykafka] stage describes the output stage of pipeline pointing to Kafka running inside the container. Pipeline is instructed to deliver data in a josn format to Kafka running at localhost:9092
Notice the location in which we create the customer pipeline.conf file:
/misc/app_host/pipeline.conf
This is important because the docker daemon runs on the underlying host layer in case of NCS5500/NCS5000/XRv9k and Vagrant IOS-XR platforms. /misc/app_host is a shared volume between the host layer and the XR LXC in these platforms.
As for ASR9k, there is no issue placing the file anywhere since docker daemon runs inside the XR VM itself. But for consistency we’ll stick to the /misc/app_host location.
Finally, launch the docker container by mounting /misc/app_host/pipeline.conf to /data/pipeline.conf inside the container where it will be picked up by the pipeline process.
[xr-vm_node0_RP0_CPU0:~]$
[xr-vm_node0_RP0_CPU0:~]$
[xr-vm_node0_RP0_CPU0:~]$ docker run -itd --name pipeline-kafka -v /var/run/netns/global-vrf:/var/run/netns/global-vrf -v /misc/app_host/pipeline.conf:/data/pipeline.conf --hostname localhost  --cap-add=SYS_ADMIN pipeline-kafka-xr:latest
e42e7e2526253e37b28362bf70c98550ca9ac108dc2aaa667da1290e44c2a035
[xr-vm_node0_RP0_CPU0:~]$
[xr-vm_node0_RP0_CPU0:~]$ docker ps
CONTAINER ID        IMAGE                      COMMAND                  CREATED             STATUS              PORTS               NAMES
e42e7e252625        pipeline-kafka-xr:latest   "/bin/sh -c '$vrf_exe"   2 minutes ago       Up 2 minutes                            pipeline-kafka
[xr-vm_node0_RP0_CPU0:~]$
[xr-vm_node0_RP0_CPU0:~]$
[xr-vm_node0_RP0_CPU0:~]$ docker exec -it pipeline-kafka bash
root@localhost:/#
root@localhost:/#
root@localhost:/# ip netns exec global-vrf bash
root@localhost:/#
root@localhost:/#
root@localhost:/# ps -ef | grep -E "pipeline|kafka|zookeeper"
root         9     6  0 02:05 ?        00:00:00 /pipeline --config=/data/pipeline.conf --log=/data/pipeline.log
root        10     6  0 02:05 ?        00:00:00 /usr/bin/java -Dzookeeper.log.dir=/var/log/zookeeper -Dzookeeper.root.logger=INFO,ROLLINGFILE -cp /etc/zookeeper/conf:/usr/share/java/jline.jar:/usr/share/java/log4j-1.2.jar:/usr/share/java/xercesImpl.jar:/usr/share/java/xmlParserAPIs.jar:/usr/share/java/netty.jar:/usr/share/java/slf4j-api.jar:/usr/share/java/slf4j-log4j12.jar:/usr/share/java/zookeeper.jar org.apache.zookeeper.server.quorum.QuorumPeerMain /etc/zookeeper/conf/zoo.cfg
root        11     6  0 02:05 ?        00:00:00 /bin/sh /usr/bin/start-kafka.sh
root        12    11  3 02:05 ?        00:00:02 /usr/lib/jvm/java-8-openjdk-amd64/jre/bin/java -Xmx256M -Xms256M -server -XX:+UseG1GC -XX:MaxGCPauseMillis=20 -XX:InitiatingHeapOccupancyPercent=35 -XX:+DisableExplicitGC -Djava.awt.headless=true -Xloggc:/opt/kafka_2.11-0.10.1.0/bin/../logs/kafkaServer-gc.log -verbose:gc -XX:+PrintGCDetails -XX:+PrintGCDateStamps -XX:+PrintGCTimeStamps -Dcom.sun.management.jmxremote -Dcom.sun.management.jmxremote.authenticate=false -Dcom.sun.management.jmxremote.ssl=false -Dkafka.logs.dir=/opt/kafka_2.11-0.10.1.0/bin/../logs -Dlog4j.configuration=file:/opt/kafka_2.11-0.10.1.0/bin/../config/log4j.properties -cp :/opt/kafka_2.11-0.10.1.0/bin/../libs/aopalliance-repackaged-2.4.0-b34.jar:/opt/kafka_2.11-0.10.1.0/bin/../libs/argparse4j-0.5.0.jar:/opt/kafka_2.11-0.10.1.0/bin/../libs/connect-api-0.10.1.0.jar:/opt/kafka_2.11-0.10.1.0/bin/../libs/connect-file-0.10.1.0.jar:/opt/kafka_2.11-0.10.1.0/bin/../libs/connect-json-0.10.1.0.jar:/opt/kafka_2.11-0.10.1.0/bin/../libs/connect-runtime-0.10.1.0.jar:/opt/kafka_2.11-0-

########################  SNIP Output #########################################

9.2.15.v20160210.jar:/opt/kafka_2.11-0.10.1.0/bin/../libs/jetty-server-9.2.15.v20160210.jar:/opt/kafka_2.11-0.10.1.0/bin/../libs/jetty-servlet-9.2.15.v20160210.jar:/opt/kafka_2.11-0.10.1.0/bin/../libs/jetty-servlets-9.2.15.v20160210.jar:/opt/kafka_2.11-0.10.1.0/bin/../libs/jetty-util-9.2.15.v20160210.jar:/opt/kafka_2.11-0.10.1.0/-locator-1.0.1.jar:/opt/kafka_2.11-0.10.1.0/bin/../libs/reflections-0.9.10.jar:/opt/kafka_2.11-0.10.1.0/bin/../libs/rocksdbjni-4.9.0.jar:/opt/kafka_2.11-0.10.1.0/bin/../libs/scala-library-2.11.8.jar:/opt/kafka_2.11-0.10.1.0/bin/../libs/scala-
root       314   312  0 02:06 ?        00:00:00 grep -E pipeline|kafka|zookeeper
root@localhost:/#
Perfect! As we can see the required services: Pipeline, Kafka and Zookeeper were started in the correct network namespace ( notice we did an exec into the global-vrf network namespace) before checking if the processes are running.
Testing the on-box Telemetry receiver
To test out the setup, let us first configure IOS-XR to send model-driven Telemetry data to the local pipeline receiver. Remember, in our custom pipeline.conf we set up pipeline to listen on UDP port 5958 on IP=1.1.1.1
The configuration required on IOS-XR is:
RP/0/RSP1/CPU0:asr9k#
RP/0/RSP1/CPU0:asr9k#show  running-config  interface  loopback 0
Thu Apr 13 18:11:33.729 UTC
interface Loopback0
 ipv4 address 1.1.1.1 255.255.255.255
!

RP/0/RSP1/CPU0:asr9k#show  running-config  telemetry model-driven
Thu Apr 13 18:11:39.862 UTC
telemetry model-driven
 destination-group DGroup1
 address family ipv4 1.1.1.1 port 5958
   encoding self-describing-gpb
 protocol udp
  !
 !
 sensor-group SGroup1
  sensor-path Cisco-IOS-XR-infra-statsd-oper:infra-statistics/interfaces/interface/latest/generic-counters
 !
 subscription Sub1
  sensor-group-id SGroup1 sample-interval 30000
  destination-id DGroup1
 !
!

RP/0/RSP1/CPU0:asr9k#
Notice the highlighted configurations:
We configure the destination to be 1.1.1.1:5958 over UDP, where 1.1.1.1 = loopback0 ip address of XR. Could be any Loopback or interface IP (Except any east-west interface IP address under tpa)
We select the following sensor path:
Cisco-IOS-XR-infra-statsd-oper:infra-statistics/interfaces/interface/latest/generic-counters. This sensor path is used to export interface stats for all interfaces on the box using the Cisco IOS-XR infra-statsd-oper YANG model.
To learn more about how to configure model-driven telemetry, check out this great tutorial by Shelly: https://xrdocs.github.io/telemetry/tutorials/2016-07-21-configuring-model-driven-telemetry-mdt/
Query the local Kafka instance
As soon as you configure Model-Driven Telemetry as shown above, the router will start streaming statistics to the local pipeline instance. Pipeline will then push the stats to Kafka running locally to the topic = ‘telemetry’ ( We configured this in our custom pipeline.conf file).
Finally purely for test purposes, the docker build process includes a sample python script that uses the python-kafka library to act as a kafka consumer.
You can find this inside the running docker container under / :
[asr9k:~]$ docker exec -it pipeline-kafka bash
root@localhost:/# ip netns exec global-vrf bash
root@localhost:/#
root@localhost:/# pwd
/
root@localhost:/# ls kafka_consumer.py
kafka_consumer.py
This is what the sample query script looks like:
from kafka import KafkaConsumer
import json

if __name__ == "__main__":

    consumer = KafkaConsumer('telemetry', bootstrap_servers=["1.1.1.1:9092"])

    for msg in consumer:
        telemetry_msg =  msg.value
        telemetry_msg_json = json.loads(telemetry_msg)

        print "\nTelemetry data Received:\n "

        print json.dumps(telemetry_msg_json, indent=4, sort_keys=True)

        if "Rows" in telemetry_msg_json:
            content_rows = telemetry_msg_json["Rows"]
            for row in content_rows:
                if row["Keys"]["interface-name"] == 'MgmtEth0/RSP1/CPU0/0':
                    pkt_rcvd = row["Content"]["packets-received"]
                    input_drops = row["Content"]["input-drops"]

                    print("\nParsed fields for interface  MgmtEth0/RSP1/CPU0/0:\
                            \n  Packets Received = %s,\
                            \n  Input Drops = %s" %(pkt_rcvd, input_drops))
As you can guess from the output above we’re executing the commands on an ASR9k. The script above has been built to dump the Telemetry stats in json format in realtime and also parse them to based on the interface key = "MgmtEth0/RSP1/CPU0/0". If you want this piece of code to work for the Vagrant setup, you will have to use an interface key based on the Vagrant IOS-XR interface naming convention (MgmtEth0/RP0/CPU0/0, GigabitEthernet0/0/0/0 etc.)
When we run the script, we get:
root@localhost:/# python kafka_consumer.py

Telemetry data Received:

{
    "Rows": [
        {
            "Content": {
                "applique": 0,
                "availability-flag": 0,
                "broadcast-packets-received": 0,
                "broadcast-packets-sent": 0,
                "bytes-received": 0,
                "bytes-sent": 0,
                "carrier-transitions": 0,
                "crc-errors": 0,
                "framing-errors-received": 0,
                "giant-packets-received": 0,
                "input-aborts": 0,
                "input-drops": 0,
                "input-errors": 0,
                "input-ignored-packets": 0,
                "input-overruns": 0,
                "input-queue-drops": 0,
                "last-data-time": 1492110984,
                "last-discontinuity-time": 1484314261,
                "multicast-packets-received": 0,
                "multicast-packets-sent": 0,
                "output-buffer-failures": 0,
                "output-buffers-swapped-out": 0,
                "output-drops": 0,
                "output-errors": 0,
                "output-queue-drops": 0,
                "output-underruns": 0,
                "packets-received": 0,
                "packets-sent": 0,
                "parity-packets-received": 0,
                "resets": 0,
                "runt-packets-received": 0,
                "seconds-since-last-clear-counters": 0,
                "seconds-since-packet-received": 4294967295,
                "seconds-since-packet-sent": 4294967295,
                "throttled-packets-received": 0,
                "unknown-protocol-packets-received": 0
            },
            "Keys": {
                "interface-name": "Null0"
            },
            "Timestamp": 1492110987184
        },
        {
            "Content": {
                "applique": 0,
                "availability-flag": 0,
                "broadcast-packets-received": 5894231,
                "broadcast-packets-sent": 0,
                "bytes-received": 2413968971,
                "bytes-sent": 830100769,
                "carrier-transitions": 15,
                "crc-errors": 0,
                "framing-errors-received": 0,
                "giant-packets-received": 0,
                "input-aborts": 0,
                "input-drops": 0,
                "input-errors": 0,
                "input-ignored-packets": 0,
                "input-overruns": 0,
                "input-queue-drops": 0,
                "last-data-time": 1492110987,
                "last-discontinuity-time": 1484314243,
                "multicast-packets-received": 24,
                "multicast-packets-sent": 0,
                "output-buffer-failures": 0,
                "output-buffers-swapped-out": 0,
                "output-drops": 0,
                "output-errors": 0,
                "output-queue-drops": 0,
                "output-underruns": 0,
                "packets-received": 8712938,
                "packets-sent": 2328185,
                "parity-packets-received": 0,
                "resets": 0,
                "runt-packets-received": 0,
                "seconds-since-last-clear-counters": 0,
                "seconds-since-packet-received": 0,
                "seconds-since-packet-sent": 3,
                "throttled-packets-received": 0,
                "unknown-protocol-packets-received": 0
            },
            "Keys": {
                "interface-name": "MgmtEth0/RSP1/CPU0/0"
            },
            "Timestamp": 1492110987184
        }
    ],
    "Source": "1.1.1.1:18046",
    "Telemetry": {
        "collection_end_time": 0,
        "collection_id": 12254,
        "collection_start_time": 1492110987176,
        "encoding_path": "Cisco-IOS-XR-infra-statsd-oper:infra-statistics/interfaces/interface/latest/generic-counters",
        "msg_timestamp": 1492110987176,
        "node_id_str": "asr9k",
        "subscription_id_str": "Sub1"
    }
}

Parsed fields for interface  MgmtEth0/RSP1/CPU0/0:
  Packets Received = 8712938,
  Input Drops = 0

Telemetry data Received:

{
    "Source": "1.1.1.1:18046",
    "Telemetry": {
        "collection_end_time": 1492110987186,
        "collection_id": 12254,
        "collection_start_time": 0,
        "encoding_path": "Cisco-IOS-XR-infra-statsd-oper:infra-statistics/interfaces/interface/latest/generic-counters",
        "msg_timestamp": 1492110987186,
        "node_id_str": "asr9k",
        "subscription_id_str": "Sub1"
    }
}
Works Great! Now that you’re able to capture Telemetry messages in realtime through a python script and are able to parse through the fields, you should be able to create your own conditions and actions based on the value of the fields. There you have it! Your own standalone pipeline and Kafka based Telemetry receiver running on the box.
Leave a Comment