
Logging on IOS-XR guest OS with rsyslog and Elastic stack
Intro
Have you ever worried about logging in the IOS-XR Linux environment? With Linux adoption, we can align our techniques and operational flows with the server world. There should be as little as possible difference in operations.
In this tutorial, we are going to cover routers configuration to stream Syslog message and accept those messages on an Ubuntu machine with Syslog-ng and Elastic stack.
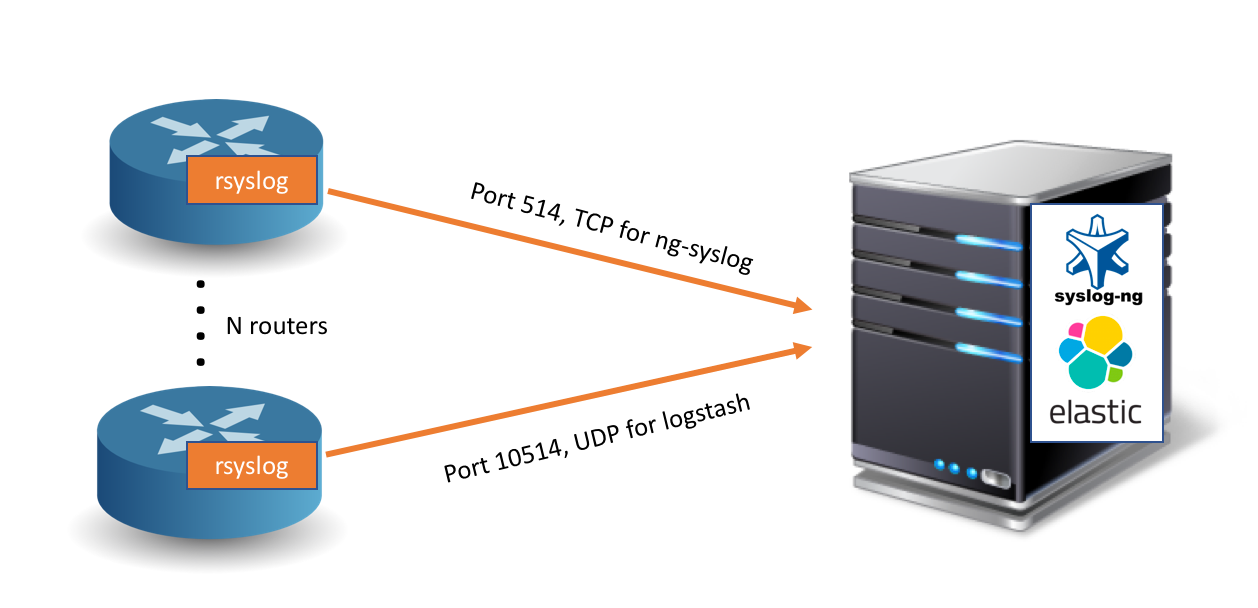 Figure 1 - Logging concepts
Requirements
You can run this tutorial on your computer using Vagrant and virtualization technologies. Topology consists of Ubuntu VM and IOS-XRv instance.
You will need following resources:
- 5 GB of RAM;
- 2 vCPU;
- Virtualbox, Vagrant and git installed;
- IOS-XRv instance. Follow this tutorial to request it.
Steps to spin up Vagrant setup
$git clone https://github.com/Maikor/IOS-XR-logging-tutorial.git
Cloning into 'IOS-XR-logging-tutorial'...
remote: Counting objects: 14, done.
remote: Compressing objects: 100% (12/12), done.
remote: Total 14 (delta 1), reused 8 (delta 0), pack-reused 0
Unpacking objects: 100% (14/14), done.
Checking connectivity... done.
$ cd IOS-XR-logging-tutorial
$ vagrant up

$ vagrant port xr
The forwarded ports for the machine are listed below. Please note that
these values may differ from values configured in the Vagrantfile if the
provider supports automatic port collision detection and resolution.

 22 (guest) => 2223 (host)
 57722 (guest) => 2200 (host)

# to access IOS-XR (password for access vagrant):
$ ssh -p 2223 [email protected]
Password:
RP/0/RP0/CPU0:xr#
# to access ubuntu
vagrant ssh ubuntu
Welcome to Ubuntu 16.04.4 LTS (GNU/Linux 4.4.0-127-generic x86_64)
vagrant@ubuntu-xenial:~$
rsyslog
What is rsyslog and why should we care?
rsyslog is the Rocket-fast SYStem for LOG processing.
It offers high-performance, excellent security features, and a modular design. While it started as regular syslogd, rsyslog has evolved into a kind of swiss army knife of logging, being able to accept inputs from a wide variety of sources, transform them, and output the results to a variety of destinations.
RSYSLOG can deliver over one million messages per second to local destinations when limited processing is applied (based on v7, December 2013). Even with remote destinations and more elaborate processing the performance is usually considered impressive. The crucial advantage over traditional syslog – the capability to send messages to remote receivers.
There are of course, several other advantages:
- Multi-threading
- TCP, SSL, TLS, RELP
- MySQL, PostgreSQL, Oracle and more
- Filter any part of syslog message
- Fully configurable output format
Package installation on IOS-XR
By default, syslog is utilized in the IOS-XR Linux environment. We will replace it with rsyslog. To do it, we will need to get the package installed on the router.
There are two options to get rpm on the box:
- SCP
- Installation via YUM
SCP option
If you are going to use SCP, you can grab package directly and copy it to the router. Use yum with option localonly to proceed with the installation:
[Canonball:~]$ yum install localonly -y rsyslog-7.4.4-r0.0.core2_64.rpm
YUM installation from public repo
If you want to use YUM and your router has external connectivity, you may setup a yum repository and install the package via yum. Based on your setup, few extra steps may be required, such as DNS configuration and setting proxy environment.
Let’s configure DNS servers on the router.
RP/0/RP0/CPU0:Canonball#conf t
Mon May 28 00:56:06.322 UTC
RP/0/RP0/CPU0:Canonball(config)#domain name-server 1.1.1.1
RP/0/RP0/CPU0:Canonball(config)#domain name-server 8.8.8.8
RP/0/RP0/CPU0:Canonball(config)#commit
Mon May 28 00:56:25.687 UTC
Once name-server applied in XR CLI config, it will be represented in XR Linux shell:
RP/0/RP0/CPU0:Canonball#bash
Mon May 28 00:57:19.519 UTC
[Canonball:~]$ cat /etc/resolv.conf
domain local
search local
nameserver 1.1.1.1
nameserver 8.8.8.8
If your device is behind a proxy, configure it in XR Linux shell:
[Canonball:~]$ export http_proxy=http://proxy.custom.com:80/
[Canonball:~]$ export https_proxy=http://proxy.custom.com:80/
Now your external connectivity should be good, proceed with YUM for package installation.
In the beginning we need to add the repo via config manager:
[Canonball:~]$ yum-config-manager --add-repo https://devhub.cisco.com/artifactory/xr600/3rdparty/x86_64/
adding repo from: https://devhub.cisco.com/artifactory/xr600/3rdparty/x86_64/

[devhub.cisco.com_artifactory_xr600_3rdparty_x86_64_]
name=added from: https://devhub.cisco.com/artifactory/xr600/3rdparty/x86_64/
baseurl=https://devhub.cisco.com/artifactory/xr600/3rdparty/x86_64/
enabled=1
Enable new repo:
[Canonball:~]$ yum-config-manager --enable    https://devhub.cisco.com/artifactory/xr600/3rdparty/x86_64/
[Canonball:~]$ yum check-update
Loaded plugins: downloadonly, protect-packages, rpm-persistence
localdb                                                                                                      |  951 B     00:00 ...
devhub.cisco.com_artifactory_xr600_3rdparty_x86_64_                                                          | 1.3 kB     00:00
devhub.cisco.com_artifactory_xr600_3rdparty_x86_64_/primary                                                  | 1.1 MB     00:01
devhub.cisco.com_artifactory_xr600_3rdparty_x86_64_                                                                       5912/5912
Proceed with installation:
[Canonball:~]$
[Canonball:~]$ yum install rsyslog

Loaded plugins: downloadonly, protect-packages, rpm-persistence
Setting up Remove Process
Resolving Dependencies
--> Running transaction check

***Omitted output***

Installed:
  rsyslog.core2_64 0:7.4.4-r0.0

Complete!
If you are facing issues with specific build versions or installation doesn’t go smoothly for you, rpm could be utilized directly, like in snippet below (rpm is already located on device hard drive).
[Macrocarpa:~]$ rpm -ivh rsyslog-7.4.4-r0.0.core2_64.rpm
Preparing...                ########################################### [100%]
Stopping system log daemon...0
update-rc.d: /etc/init.d/syslog exists during rc.d purge (continuing)
 Removing any system startup links for syslog ...
  /etc/rc0.d/K20syslog
  /etc/rc1.d/K20syslog
  /etc/rc2.d/S20syslog
  /etc/rc3.d/S20syslog
  /etc/rc4.d/S20syslog
  /etc/rc5.d/S20syslog
  /etc/rc6.d/K20syslog
   1:rsyslog                ########################################### [100%]
update-alternatives: Linking //sbin/syslogd to /usr/sbin/rsyslogd
update-alternatives: Linking //etc/syslog.conf to /etc/rsyslog.conf
update-alternatives: Linking //etc/logrotate.d/syslog to /etc/logrotate.rsyslog
update-alternatives: Linking //etc/init.d/syslog to /etc/init.d/syslog.rsyslog
 Adding system startup for /etc/init.d/syslog.
starting rsyslogd ... done
To send messages to the remote server, we will need to configure rsyslog, in particular, modify its configuration file /etc/rsyslog.conf
For TCP we will use @@
For UDP we will use @
String below will allow us to send all messages via TCP:
*.* @@<remote_ip>:514
If there is an intention to offload messages to Elasticsearch, we will need to convert them to JSON format. There are two ways how to do that:
- Format incoming messages received on the server side;
- Send messages directly in JSON format.
We will elaborate on example with the second option. To convert a message to JSON format we will add the template to rsyslog configuration file.
template(name="JsonFormat"
  type="list") {
    constant(value="{")
      constant(value="\"@timestamp\":\"")     property(name="timereported" dateFormat="rfc3339")
      constant(value="\",\"@version\":\"1")
      constant(value="\",\"message\":\"")     property(name="msg" format="json")
      constant(value="\",\"sysloghost\":\"")  property(name="hostname")
      constant(value="\",\"severity\":\"")    property(name="syslogseverity-text")
      constant(value="\",\"facility\":\"")    property(name="syslogfacility-text")
      constant(value="\",\"programname\":\"") property(name="programname")
      constant(value="\",\"procid\":\"")      property(name="procid")
    constant(value="\"}\n")
}
The template is defined, next step to apply it:
*.* @<remote_ip>:10514;JsonFormat
With such configuration, the router will send messages to 2 destinations, one in the plain text format to port 514 and another in JSON format to port 10514.
Out of box Logstash supports UDP, TCP available via “TCP input plugin”. Not to ample our guide, we will stick to UDP for now.
Validate the rsyslog config. No errors? All set!
rsyslogd -N1
Some extra commands, which will help you to do the health check on your setup. To check rsyslog version running:
rsyslogd -version
Check the Linux system log for rsyslog errors. You should see an event that it it has started with no errors. Some logs may also be in /var/log/syslog.
sudo cat /var/log/messages | grep rsyslog
Restart rsyslog to enable the changes applied to the configuration:
[Macrocarpa:~]$ service syslog restart
stopping rsyslogd ... done
starting rsyslogd ... done
If you decide to utilize rsyslog version 8+, make sure you have library libestr version 1.9+
Filters
rsyslog provides the comprehensive set of filters and rules. By specifying dot (“.”) in the config file, we determine that all information from all facilities would be sent to the remote location.
What if we want to exclude some facilities from sending process? Adding ; should solve this case.
*.*;mail
# will match all facilities, except mail

auth.warn
# will match facility auth, with security level 'warning' or higher
What could be a filter example? Let’s say we want to search msg property of the incoming Syslog message, for a specific string and pipe it to the custom file. All messages with substring pam_unix(crond:session): now logged to ncs-custom.log
:msg, contains, "pam_unix(crond:session)" -/var/log/syslog-ng/ncs-custom.log
Keep in mind, that filters are case-sensitive. ‘Pam’ or ‘PAM’ will not be filtered.
Official documentation with notification levels and more on filters here.
Configuring server side
On a server side (aka receiver) we will run syslog-ng to get messages from routers in plain text. Syslog-ng would be run natively (the docker image also available) and Elastic (Logstash + Elasticsearch) would start in docker container for easier deployment.
syslog-ng
If you have Ubuntu, apt-get should be used to install syslog-ng.
sudo apt-get install syslog-ng -y
Check that installation was successful. With apt, you will not get the latest version of software, but it will serve our purpose without limitations.
% syslog-ng --version
syslog-ng 3.5.6
Installer-Version: 3.5.6
Revision: 3.5.6-2.1 [@416d315] (Ubuntu/16.04)
Compile-Date: Oct 24 2015 03:49:19
Next step would be to modify Syslog configuration file /etc/syslog-ng/syslog-ng.conf. Following config lines will open port for listening and write all messages to file ncs.log
source s_net {
    tcp(ip(0.0.0.0), port(514));
    udp(ip(0.0.0.0), port(514));
};

destination logfiles {
   file("/var/log/syslog-ng/ncs.log");
};

log {
    source(s_net);
    destination(logfiles);
};
The syslog-ng service should listen on all IP addresses, because we specify 0.0.0.0 and TCP/UDP port 514. If you want to listen to specific IP, just replace 0.0.0.0 with your required ip address.
$ netstat -tulpn | grep 514
tcp        0      0 0.0.0.0:514             0.0.0.0:*               LISTEN      -
udp        0      0 0.0.0.0:514             0.0.0.0:*                           -
Elastic stack
Open source software, such as Elasticsearch and Logstash provide you the tools to transform and store our log data.
We can verify the messages in JSON format are received on the server side, before proceeding with the installation. netcat is used for that.
nc -ul server_ip 10514

{"@timestamp":"2018-06-03T19:10:01.524244+00:00","@version":"1","message":" pam_unix(crond:session): session opened for user root by (uid=0)","sysloghost":"Red_Pine","severity":"info","facility":"authpriv","programname":"crond","procid":"21501"}
{"@timestamp":"2018-06-03T19:10:01.524813+00:00","@version":"1","message":" (root) CMD (/usr/bin/logrotate /etc/logrotate.conf >/dev/null 2>&1)","sysloghost":"Red_Pine","severity":"info","facility":"cron","programname":"CROND","procid":"21502"}
To proceed with the installation, pull the images:
docker pull docker.elastic.co/logstash/logstash:6.2.4
docker pull docker.elastic.co/elasticsearch/elasticsearch:6.2.4
To let Logstash be aware of incoming rsyslog messages, we should provide configuration file logstash.conf:
# Logstash will wait for input on port 10514;
# server_ip -> ip of our machine;
# codec, specifies "json" receiving format
# "rsyslog" type used for identification messaging streams in the pipeline.
input {
  udp {
    host => "server_ip"
    port => 10514
    codec => "json"
    type => "rsyslog"
  }
}
# Filter block is empty, could be used in future
filter { }
output {
  if [type] == "rsyslog" {
    elasticsearch {
      hosts => [ "server_ip:9200" ]
    }
  }
}
Run the containers! For the Logstash container you can mount the whole folder with the config files, or specify the files directly.
docker run -itd --rm --name=logstash -v ~/Documents/elastic/:/usr/share/logstash/pipeline/ docker.elastic.co/logstash/logstash:6.2.4

docker run -itd -p 9200:9200 -p 9300:9300 --name=elasticsearch  -e "discovery.type=single-node" docker.elastic.co/elasticsearch/elasticsearch:6.2.4
To verify, that Logstash is sending data to Elasticsearch, open a browser http://server_ip:9200/_all/_search?q=*&pretty.
You should see the output from rsyslog:
{
      "_index" : ".monitoring-logstash",
      "_type" : "rsyslog",
      "_id" : "d9tyx2MBc17MjdSrF223",
      "_score" : 1.0,
      "_source":{"@timestamp":"2018-06-03T21:00:44.739673+00:00","@version":"1","message":" + /dev/pts/8 root:root","sysloghost":"Red_Pine","severity":"info","facility":"authpriv","programname":"su","procid":"24267"}
    },
Congratulations, all your software is up and running!
logrotate
It’s worth to mention one critical component for logging solution. The space on your hard drive is finite. It’s worth investing some amount of time to configure proper rules for your machine to free up space. Logrorate is a perfect solution for that. Let’s take a look at configuration excerpts for ncs.log:
cisco@walnut ~ % cat /etc/logrotate.d/apt
/var/log/syslog-ng/ncs.log {
  rotate 24
  monthly
  compress
  missingok
  notifempty
}
- rotate 24 - 24 old log files saved;
- monthly - rotation frequency;
- compress - gzip used by default, to compress old log files;
- missingok - no errors if log file is missing;
- notifempty - skip rotate, if log file is empty.
With such a simple addition, your hard drive capacity will last longer.
Conclusion
Your logs streamed via rsyslog to multiple destinations: syslog-ng and Logstash. Consider visualization with some tools like Kibana or another application and elevate your logging techniques.
Leave a Comment