
Service Assurance: A Guide for the Perplexed, Part Two
In Part One of this series on Service Assurance, I discussed what and why Service Providers need it. In Part Two, I take a closer look at the specific protocols and tools you have to accomplish the task.
Active Assurance at Layer 3
The original form of active assurance are old friends to most network engineers: ping and traceroute. Both rely on ICMP messages to report availability, latency and path information. Ubiquitous as they are, ICMP-based utilities face real headwinds as assurance tools. For one, ICMP can travel a different path through the network and, indeed, through a device, than normal customer traffic, thus resulting in inaccurate reports of the actual performance. In addition, more SPs are enhancing security policies to drop ICMP traffic altogether, rendering these tools less useful.
To enhance these stalwart tools, Cisco developed a set of performance measurement features collectively referred to as “IP-SLA.” IP-SLA enabled measurements of loss, delay and jitter to IP endpoints using a variety of operations, including ICMP, UDP, HTTP and more. IP-SLA is a form of active assurance that sends and receives probes from the router itself.
The obvious usefulness of performance measurement made it an excellent candidate for standardization. In 2006, the IETF standardized One-Way Active Measurement Protocol (OWAMP). OWAMP provided the precision of one-way measurements but the requirement for network-wide clock synchronization limited its adoption.
In 2008, RFC 5357 introduced Two-Way Active Measurement Protocol (TWAMP) to extend OWAMP to allow for two-way and round-trip measurements (with or without clock synchronization). Because TWAMP defined multiple logical roles for session establishment, most vendors ended up implementing a simpler architecture, “TWAMP Light”, that only needed a Sender and Responder.
Unfortunately, TWAMP Light was only an appendix to RFC 5357 and not sufficiently specified to prevent interoperability issues. Hence we have RFC 8762, Simple Two Way Active Measurement Protocol (STAMP), which codified and extended TWAMP Light. STAMP is extensible and backwards compatible with TWAMP-Light, so hopefully it will stick around for a while.
Other work is ongoing in the IETF to standardize STAMP extensions in order to leverage the forwarding capabilities of Segment Routing networks (sometimes called Segment Routing Performance Measurement or SR-PM).
Insider Tip: In Cisco, “SR-PM” is sometimes used as a shorthand term for the superset of all L3 performance management features (SR and IP). So if you’re interested in TWAMP-Light and a Cisco person is talking to you about SR-PM, don’t worry, you’re both talking about the same thing.
Active Assurance at Layer 2
A different set of standards governs service assurance in Layer 2 networks (think L2VPN, VPLS, EVPN VPWS, etc). The building blocks of Ethernet Operation, Administration and Management (OAM) began with IEEE 802.1ag, which defined Connectivity Fault Management (CFM). The ITU came out with its own Ethernet OAM standard, Y.1731. Both 802.1ag and Y.1731 cover fault management, while performance management is solely covered by ITU-T Y.1731. Nowadays, IEEE 802.1ag is considered a subset of ITU-T Y.1731.
Service Activation Testing Methodologies
In addition to the “AMPs” and Y.1731, you may run across a few other measurement standards.
Y.1564 is an out-of-service ethernet test methodology that validates the proper configuration and performance of an ethernet service before it is handed over to the end customer.
RFC 6349 defines a methodology for TCP throughput testing.
These methods are not suitable for on-going service assurance since they are only intended to be used during offline service activation or active troubleshooting.
Where to Run: Embedded or External?
Active assurance methods like TWAMP and Y.1731 require a sender and receiver/responder. The functionality can be embedded in an existing router or it can be a dedicated external device.
Embedded: Simple But Effective
There are many reasons to take advantage of active probing capabilities built in to your routers. First of all, it’s free! You’ve already paid for the device to forward traffic, so if it can also do active assurance, then by all means, try this first. Operationally, it’s also a slam dunk. Whatever tools you use to manage your router config can also manage probe configuration. There are no new systems to manage or integrate.
Embedded probes have a unique advantage in that they can test the internals of the network infrastructure. SR-PM, IOS XR’s performance measurement toolkit, includes the capability to test link performance as well as end-to-end traffic engineering paths. Emerging measurement techniques like Path Tracing bring ECMP awareness to performance measurement. These are things external probes can’t do.
One common argument against embedded probes is performance. And that was certainly true in the past, when probes were punted to the RP for processing. If the punt path was congested, the probe would report poor performance when the actual datapath was fine. In modern systems, however, hardware timestamping ensures that the NPU stamps the probes in the datapath, giving a much more accurate measurement of network delay. In addition, many systems can support “hardware offload” which pushes the entire process of probe generation into the NPU, giving you a high fidelity measurement of the actual datapath and much higher performance than was possible in the past. So if you looked at IP-SLA a decade ago and dismissed it because of performance, you should take another look at modern implementations.
Another consideration is interoperability. If you’re using embedded probes in a multi-vendor network, then you have to ensure interoperability between the vendors’ implementations of the protocol. This was especially painful with TWAMP-Light, since the lack of specificity in the RFC made it easy to interpret differently. This will get better as STAMP becomes the industry standard.
Functionality is the final consideration for embedded probes. The limited memory and compute on a router means that more elaborate customer experience tests (e.g. page download or MOS scoring) are really not well-suited. Moreover, your upgrade cycle for assurance features is tied to the upgrade cycle of the entire router which can be measured in months or years. That’s a long time to wait for a new assurance feature.
In sum, embedded probes offer an inexpensive way to get simple, scalable measurements of services, traffic engineered and ECMP paths and physical links with excellent fidelity to the actual data path and better performance than ever before. But if interoperability is a problem or you need more complex and/or end-to-end tests, then you may have to consider an external probing system.
External: Extensive But Expensive
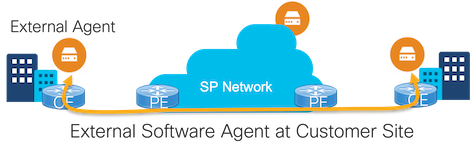
External probing devices come in all shapes and sizes, from Network Interface Devices (NIDs) to pluggable SFPs to containerized agents running in generic compute. They can be deployed at any place in the network that a service provider has a presence, including the end customer site (if the SP has deployed a managed service) and in the cloud. Network vendor interoperability is not an issue since the probes are generated and received by the external probing devices, not the networking devices.
Physical probe generators can be deployed in-line which measures the service exactly as the end customer experiences it. This is very accurate but also very expensive, as you need one device for every service. Other deployment models place the NID, SFP or containerized agent at a place in the network where probes can be injected into multiple service paths (e.g. on a trunk port with many VLANs associated with many different VRFs).
Unlike routers, whose primary function is to forward traffic, external probes are dedicated to the sole purpose of measuring the network. The breadth of functionality they support can be much wider, encompassing Ethernet OAM, TWAMP, and service activation protocols as well as detailed insight into Layer 7 transactions (e.g. HTTP, DNS, TCP, SSL, etc) and high-level path analysis (e.g. using traceroute). Taken together, the information from external probes deployed at the right places in the network can give a good snapshot of the end customer’s digital experience.
While external probes give good insight into end-to-end performance all the way up to the application layer, they can’t dig into the internals of the service provider network. The network is a black box to external probes. Things like link performance, path performance, and ECMP paths are essentially invisible to external probes.
Probably the biggest drawback to external probes is cost, both capex and opex. Hardware probes, whether NIDs or SFPs, are expensive. Once service provider reported spending as much on NIDs as on routers in their edge deployment! But operational costs can also be of concern. Every external probe represents one more network element to manage: hardware has to be deployed and monitored, software has to be upgraded and maintained. Adding thousands or tens of thousands probes to your network is not a project to be taken lightly.
Conclusion
There are a couple of things to take away from this brief overview of protocols and probes. First, use the right protocol for the service layer you need to test (typically TWAMP for Layer 3, Y.1731 for Layer 2). Second, your use case will determine whether embedded or external probes will serve you best. The closer you want to get to the network infrastructure, the more sense it makes to use the specialized, embedded probe capabilities you’ve already paid for. The closer you get to the end-to-end customer experience, the more you’ll want to look at external probing capabilities. To help think through those gray areas where either option could work, I’ll dig into some more design considerations in Part Three of this series.
Leave a Comment