
Monitoring Digital Coherent Optics in IOS-XR
Revision History
| Version | Date | Comments |
|---|---|---|
| 1.0 | 02/10/2024 | Initial Publication |
Document Overview
In this blog we will focus on the ongoing monitoring of digital coherent optics (DCO) once they are deployed in the network. More information on the installation and provisioning of DCO optics can be found in the above locations. We will look at the types of Performance Measurement data important to be monitored and how to monitoring the PM data through several interfaces including the router CLI interface, using streaming telemetry, and using Cisco’s Crosswork family of network automation products.
Routed Optical Networking
Routed Optical Networking introduced by Cisco in 2020 introduced a fundamental shift in how IP+Optical networks are built. Collapsing previously disparate network layers and services into a single unified domain, Routed Optical Networking simplifies operations and lowers overall network TCO. More information on Routed Optical Networking can be found at the following locations:
- https://www.cisco.com/c/en/us/solutions/service-provider/routed-optical-networking.html
- https://xrdocs.io/latest-routed-optical-networking-hld
Pluggable Digital Coherent Optics Overview
One of the foundations of Routed Optical Networking is the use of small form factor pluggable digital coherent optics. These optics can be used in a wide variety of network applications, reducing CapEx/OpEx cost and reducing complexity vs. using traditional external transponder equipment.
OIF 400ZR and OpenZR+ Standards using QSFP-DD Transceivers
The networking industry saw a point to improve network efficiency by shifting coherent DWDM functions to router pluggables. Technology advancements have shrunk the DCO components into the standard QSFP-DD form factor, meaning no specialized hardware and the ability to use the highest capacity routers available today. ZR/OpenZR+ QSFP-DD optics can be used in the same ports as the highest speed 400G non-DCO transceivers.
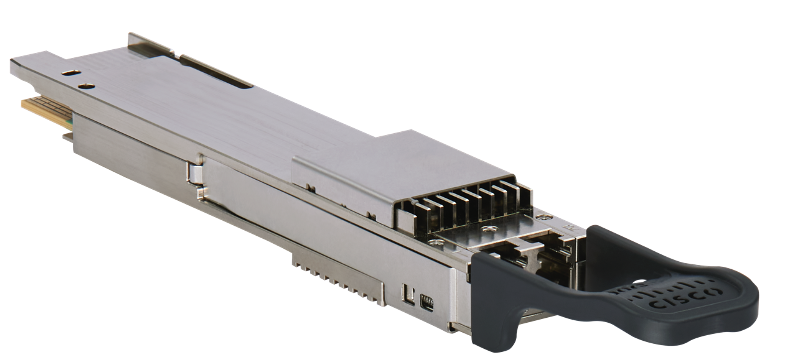
Cisco High-Power OpenZR+ “Bright” Transceiver (DP04QSDD-HE0)
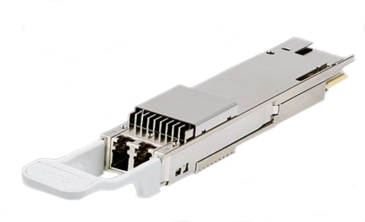
Cisco OpenZR+ Transceiver (QDD-400G-ZRP-S)
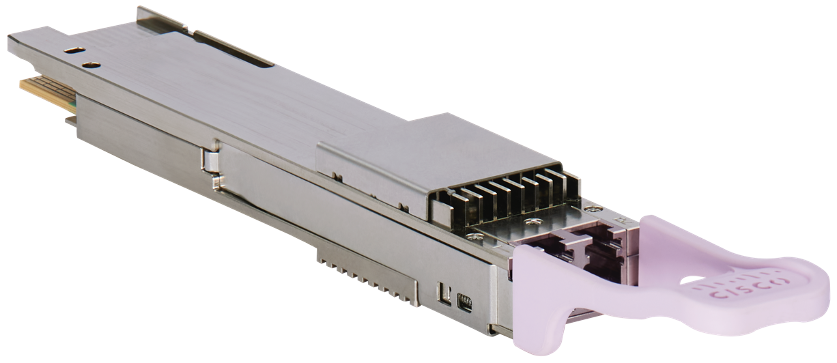
Cisco OIF 400ZR Transceiver (QDD-400G-ZR-S)
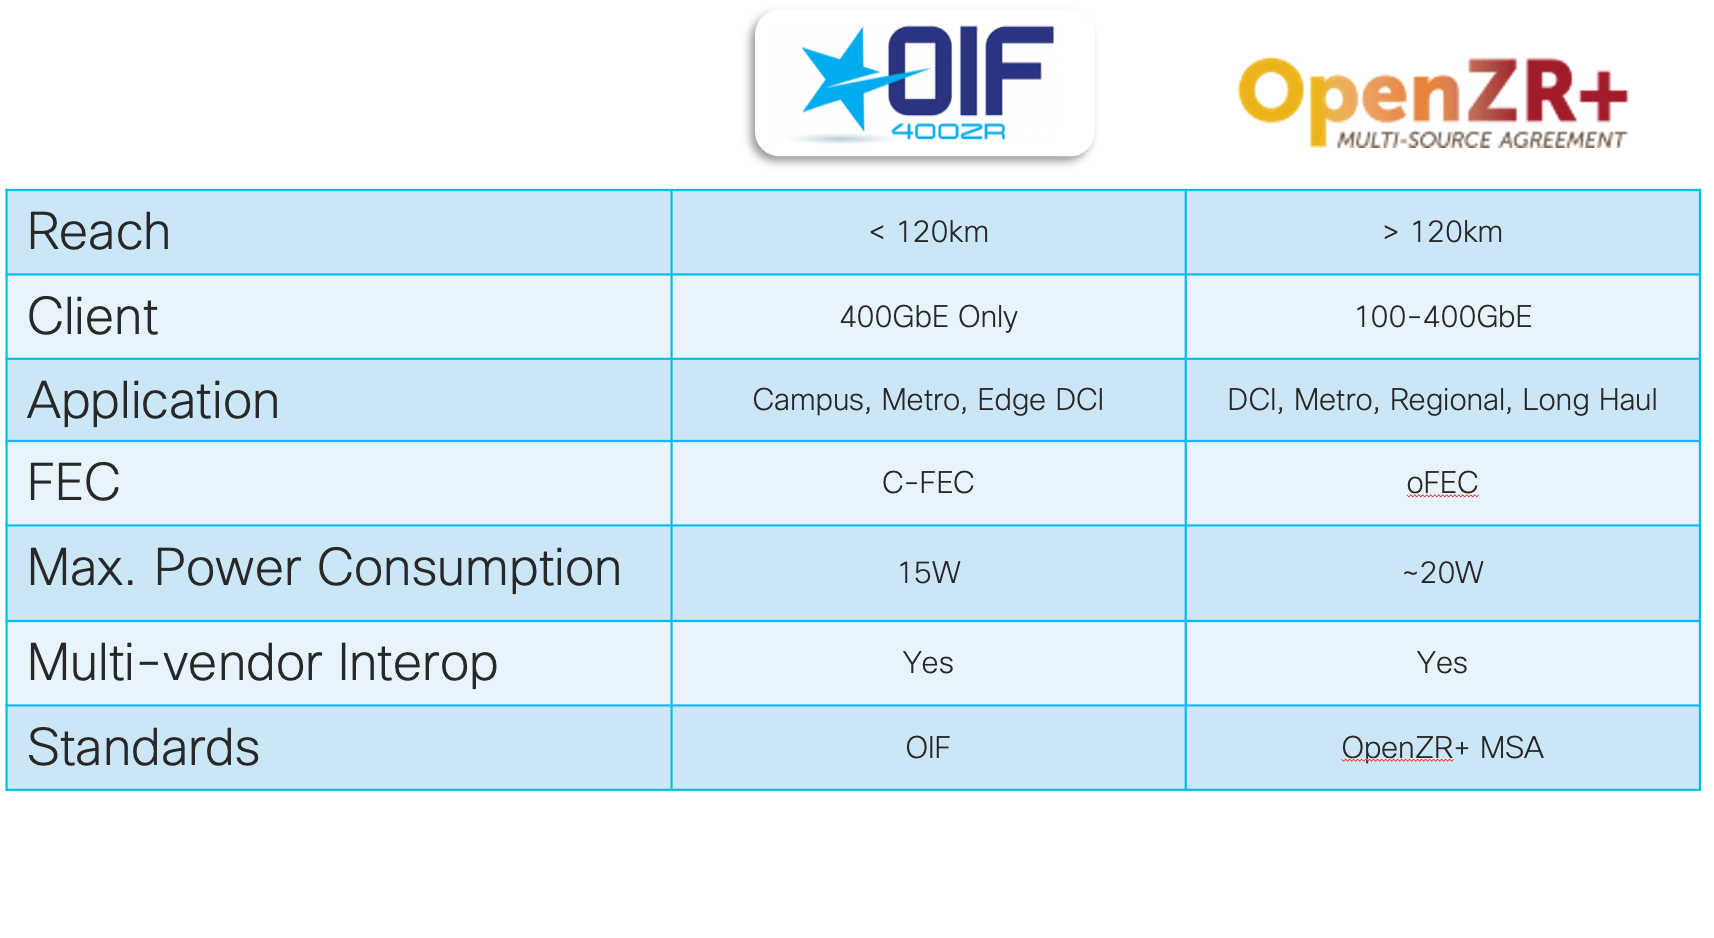
Two industry optical standards have emerged to cover a variety of use cases. The OIF created the 400ZR specification, https://www.oiforum.com/technical-work/hot-topics/400zr-2 as a 400G interopable standard for metro reach coherent optics. The industry saw the benefit of the approach, but wanted to cover longer distances and have flexibility in wavelength rates, so the OpenZR+ MSA was created, https://www.openzrplus.org. The following table outlines the specs of each standard. ZR400 and OpenZR+ transceivers are tunable across the ITU C-Band, 196.1 To 191.3 THz.
The following part numbers are used for Cisco’s ZR400 and OpenZR+ MSA transceivers
| Standard | Part |
|---|---|
| 400ZR | QDD-400G-ZR-S |
| OpenZR+ | QDD-400G-ZRP-S |
| OpenZR+ High-Power (Bright) | DP04QSDD-HE0 |
The Cisco datasheet for these transceivers can be found at https://www.cisco.com/c/en/us/products/collateral/interfaces-modules/transceiver-modules/datasheet-c78-744377.html and https://www.cisco.com/c/en/us/products/collateral/interfaces-modules/transceiver-modules/400g-qsfp-dd-high-power-optical-module-ds.html
Cisco Hardware Support for 400G ZR/ZR+ DCO Transceivers
Cisco supports the OpenZR+ and OIF ZR transceivers across all IOS-XR product lines with 400G QSFP-DD ports, including the ASR 9000, NCS 540, NCS 5500, NCS 5700, and Cisco 8000. Please see the Routed Optical Networking Design or the individual product pages below for more information on each platform.
Cisco 8000
NCS 500
Cisco ASR 9000
NCS 5500 and NCS 5700
https://www.cisco.com/c/en/us/products/collateral/routers/network-convergence-system-5500-series/datasheet-c78-736270.html
https://www.cisco.com/c/en/us/products/collateral/routers/network-convergence-system-5500-series/datasheet-c78-744698.html
Pluggable Digital Coherent Optics Detail
Digital Coherent Optics are complex technology. In this blog we will not go into low level detail of the inner workings of the optics, but look at some of the basic components to help understand where specific performance measurement data is derived from and how best to monitor the optics.
Component Diagram
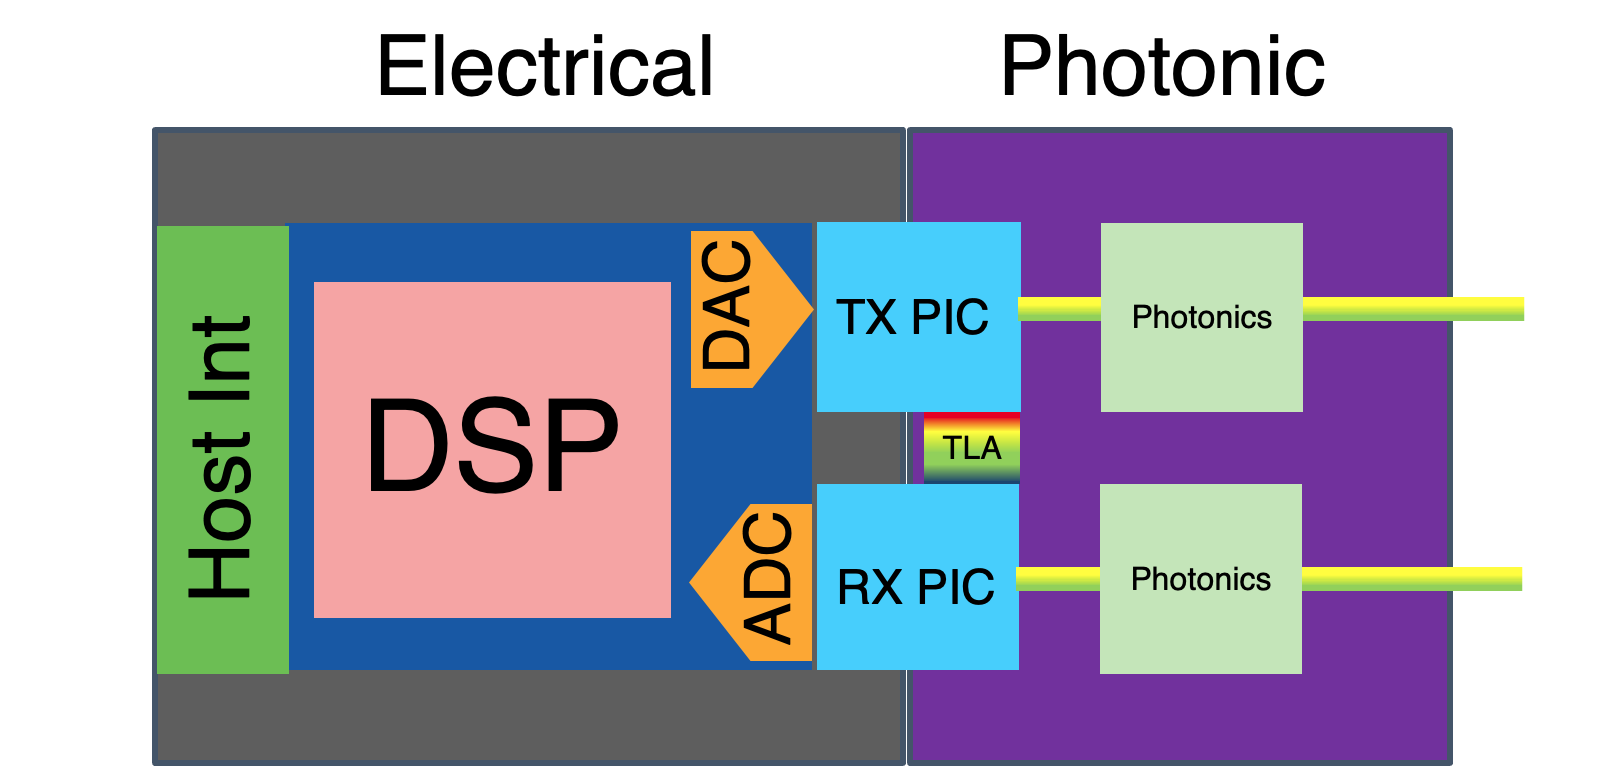
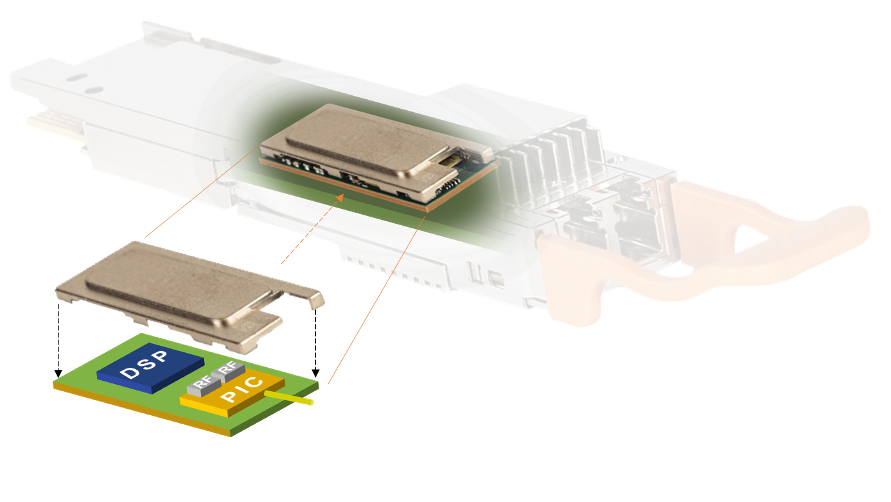
Component Packaging
On modern DCO like Cisco’s ZR/ZR+ multiple elements are co-packaged leading to simpler design and greater power efficiency.
Coherent DSP
At the heart of “Digital” coherent optics is a Digital Signal Processor (DSP). The definition of a DSP is in the nane, the DSP analyzes an incoming signal, typically performs some type of manipulation, and then passes that signal onto another element. DSPs can be very simple, such as one re-sampling digital audio signals, or complex DSPs can perform many functions.The input interface into the DSP and the output interface may or may not be the same format, requiring the DSP to perform the conversion. Signal conversion is just one of many jobs performed by the DSP in a DCO. It is a bit of a stretch to only call the processing component inside the DCO a “DSP” due to the number of functions it performs.
We will consider the Analog to Digital Conversion (ADC) and Digital to Analog Conversion (DAC) components part of the “DSP” since they are typically packaged with the actual signal processor and associated digital components. The ADC/DAC is responsible for converting electrical analog to digital, not converting electrical analog to an optical signal.
Photonic (Optical) Components
While the DSP takes on many functions performed by photonic components in the past, we still need photonic components to send/receive light across fiber. The optical components within the DCO are similar to those found in non-DCO applications. Common components are the TLA (Tunable Laser Assembly) generating the signal along with TOFs (Tunable Optical Filter) and other pure photonic components such as splitters, combiners, and waveguides. In higher power optics, an integrated EDFA is used to amplify the signal before it leaves the DCO.
Photonic Integrated Circuit (PIC)
At some point in the signal path a translation between the electrical signal to the optical signal must take place. This is done through the use of modulators and receivers built using Photonic Integrated Circuits in modern DCO. TThese are commonly referred to as opto-electric modules because they span both signal domains. The electrical signal generated by the DSP and then the DAC is used to modulate the transmit optical laser to match the data being sent.
Receivers are likewise responsible for processing the optical signal into electrical domain signals which after some pre-processing can be processed by the DSP.
IOS-XR DCO Conventions
As we have seen the DCO has both Digital and Optical components, IOS-XR represents the optics in a similar manner as a way to better manage each layer, including the PM data we gather and analyze.
Optics Controller
The optics controller on a IOS-XR router represents the physical pluggable faceplate port on the router. Whether the pluggable is DCO or not, there will be an optics controller. The optics controller is used to manage and monitor the physical layer characteristics of an optic. A plug and play gray pluggable optic doesn’t require any physical layer configuration since it’s built into the standard and can only be configured one way. However, there are a number of optical properties which can still be monitored on the optics, such as per-lane receive power.
In the case of the DCO, the optics controller is where we configure physical layer properties such as the frequency and output power. It’s also where we monitor physical layer alarms and PM data.
CoherentDSP Controller
The CoherentDSP controller matches the naming conventions of the optics controller.
It represents the digital layer of the DCO and is responsible for alarms and PM data associated with the digital signal.
DCO Performance Measurement Data
Overview
In this section we will introduce the performance measurement data available with an explanation of what each component is, why it’s important, and what is considered an ideal range of values.
TL;DR What PM values to monitor and what to look for?
The rest of the document goes into detail about the PM data available and how to monitor them. These however are the key values which should be monitored.
- Totcal Optical Receive Power (RX Power)
- Optical Signal Receive Power (RX Signal Power)
- Q-Factor
- Q-Margin
RX power, Q-Factor, and Q-Margin will be have some absolute value once the circuit is operational. Each of these values have known minimums based on the DCO specifications, but will be different for every operational circuit. It’s important to monitor the values for changes.
Note changes may occur due to other network changes such as adding more channels on the same fiber span.
Optical Layer PM Data
Optical Power - Transmit
Transmit power, or TX power represents the strength of the optical signal leaving the DCO. It can be adjusted by user configuration. In most cases leaving the TX power to the default value is advised. On the QDD-400G-ZR-S and QDD-400G-ZRP-S the default power for 400G mode is -10dBm. On the DP04QSDD-HE0 the default power for 400G mode is 0dBm. Changes in the TX power can help identify hardware issues. The TX power will fluctuate slightly but changes of more than .2 dBm may indicate an issue.
Optical Power (Total) - Receive
Receive power, or RX power represents the strength of the optical signal entering the DCO from the line side. There is a direct correlation between the RX power and the quality of the signal. The DCO has a defined receiver sensitivity range. If the RX power drops below the minimum RX sensitivity value, it may not be able to process the incoming signal. It is difficult to give a specific acceptable range for RX power since other impairments such as noise may also degrade the signal even at acceptable RX power levels. However, in practice the signal should always be above -20 dBm. The total optical power is measured at the ingress point into the optic.
**Note in IOS-XR the minimum reported power is -40dBm indicating there is no signal present.
Optical Power (Signal) - Receive
Receive signal power represents the signal strength of the coherent channel the DCO is tuned to receive. it’s important to represent both the total power and the signal power since total power indicates there is some optical signal being received from the far end, and the RX signal power indicates the correct wavelength is being received. If the total RX power is in the normal range and the RX signal power is very low it indicates a frequency configuration issue.
**Note in IOS-XR the minimum reported power is -40dBm indicating there is no signal present.
Optical Signal to Noise Ratio
OSNR is one of the key PM values in monitoring an optical signal. Background noise is inherent in almost all analog signals. It can also be introduced into the signal by different photonic elements. Amplifiers can introduce and increase noise. As the primary signal is amplified so is the noise inherent in analog signals. Measuring the true optical signal to noise ratio requires test measurement equipment which cannot be packaged in the size of a DCO. The DCO estimates the OSNR based on DSP compensation and are not precise in all conditions.
Chromatic Dispersion
Chromatic Dispersion is a linear optical impairment which degrades the overall signal and must be corrected by the DCO. Different wavelengths travel at different speeds, this can commonly be seen using a prism. 400G signals use 75Ghz of spectrum which covers a wide band of frequencies so they do not all travel together. As the signal travels along the fiber the signal spreads out meaning the receive end must compensate for the delay between the beginning and end of the signal. The spread of the signal is measured in picoseconds/nanometer or ps/nm.
In IOS-XR the user can configure the “sweep” range used to compensate for the chromatic dispersion using the cd-min and cd-max threshold values.
The user can also monitor the current estimated Chromatic Dispersion values. These values are derived from calculations done by the DSP during its CD compensation.
Polarization Mode Dispersion
PMD is another type of signal dispersion or spread. PMD is unique to coherent signals and measures the spread in time between the X and Y polarized signals comprising the coherent signal. We don’t measure PMD directly but several of the following PM values are used to measure the effect of PMD. PMD is typically introduced via imperfections in the fiber or mechanical manipulation of the fiber such as bending.
Differential Group Delay
DGD is the measure of PMD and is used to express the difference in arrival time of the two orthogonal signals. DGD can also be known as First Order PMD or FOPMD. DGD is measured in picoseconds. Perfect fiber has no PMD/DGD but fiber used in the field is not perfect. Modern SM fiber can introduce .5-1ps of DGD over 100km, it is directly related to fiber length. Optical components can also introduce DGD. DGD is wavelength dependent so may be different for different wavelengths, it can also be introduced by temperature fluctuations in the fiber.
Polarization Dependent Loss
Signal polarization can also have another effect in introducing signal loss as the signal propagates through the fiber. The value is dependent on fiber length and is compensated for by the coherent DSP. The value should remain low in most instances and is measured in dB. Keep in mind this is dB and not the dBm that optical power is expressed in.
Second-Order Polarization Mode Dispersion
SOPMD is a measure of the PMD rates of change related to signal frequency. The name is due to SOPMD being the second order diffeential with respect to PMD. The DGD value does not remain static so the DSP must compensate not only for the DGD value but the rates of change in DGD. This value is measured in picoseconds squared or ps^2.
Polarization Change Rate
As the polarized signals travel through the fiber, the fiber can cause changes in the polarization state or SOP (State of Polarization). The coherent DSP must compensate for these changes to properly decode the signal. The PCR is measured in radians/second or rad/s since the state change is rotational. On shorter fiber spans this value should be 0 but longer spans or poor fiber may introduce higher values.
General guidelines for acceptable values
The following represents the range of values for each optical PM metric and what is considered a “good” value. The “range” represents the range of reporting on Cisco ZR/ZR+ DCO.
| Metric | Units | Range | Healthy range | Comment |
|---|---|---|---|---|
| Optical Power - Receive | dBm or mW | -33 to +15 | -14 to +8 | High alarm is set to +10, low to -24 |
| Optical Signal Power - Receive | dBm or mW | -33 to +15 | -14 to +8 | High alarm is set to +10, low to -24 |
| Optical Signal Power - Transmit | dBm or mW | -15 to +5 | -12 to +2 | Healthy depends on DCO model and mode |
| OSNR | dB | 16.5 to 28.5 | need comment | Healthy range changes dependent on mode |
| CD | ps/nm | -100 to 100 | need comment | |
| DGD | ps | -10 to 10 | need comment | |
| PCR | rad/s | 0-50 | need comment | |
| PDL | dB |
Digital Layer PM Data
We’ve covered optical impairments in the analog optical domain. Ultimately any type of signal degradation can lead to errors at the digital layer.
Pre-FEC Bit Error Rate
High speed coherent optics expect transmission errors at the bit level due to optical signal impairments. Forward error correction uses an algorithm to send extra data with the signal so it can be used to “correct” the original signal when information is lost or incorrect. Modern algorithms are used to minimize the amount of extra data which needs to be sent.
The Pre-FEC BER is expressed in a ratio of bit errors per samples bits, and at the rates being used for ZR/ZR+ optics is very small. It’s expressed in scientific notation such as 3.7E-04, which is .00037. It’s difficult to monitor this as an absolute value, but can be monitored for change over time to help identify issues with the fiber. Q-Margin explained below is an easier value to monitor.
Post-FEC BER and Uncorrectable Words
Post-FEC BER measures the amount of bits which are unable to be corrected, and ultimately lead to UCs or uncorrectable words/bytes.
Any value other than 0 means there is a critical issue with the signal, and in most cases due to the sharp FEC cliff it’s unlikely the interface will be up if you are receiving bit errors.
Quality Factor (Q-Factor)
The Q-Factor is a DSP calculated value closely related to the Pre-FEC BER and OSNR. The Q-Factor provides a minimum SNR value required to meet a certain BER requirement. Based on the properties of the DCO optics we know at a certain BER we require a specific SNR, if the BER is very high then we need a higher SNR. The Q-Factor expressed this relationship via a single value. On the DCO the value is based on measured BER over a specific time period.
Quality Margin (Q-Margin)
The Q-Margin is a calculated value used to convey the health of the overall signal after being processed. It indicates how much signal margin exists and if degradation occurs how much it can degrade before the signal is lost. A Q-Margin less than 0.5dB is considered unhealthy. The Q-Margin is useful during both circuit turn-up as well as checking the ongoing health of the circuit.
General guidelines for acceptable values
The following table highlights some general acceptable values and how the OSNR, Pre-FEC BER, and Q-margin relate to each other.
| Q-margin | Pre-FEC BER | OSNR margin | Optical channel health |
|---|---|---|---|
| < 0.5dB | > 1.5E-2 | < 1dB | Unhealthy |
| 0.5dB to 1dB | 1.5E-2 to 1.0E-2 | 1dB to 2.2dB | Acceptable |
| 1.0dB to 1.5dB | 1.0E-2 to 7.0E-3 | 2.2dB to 3.4dB | Healthy |
| > 1.5dB | <7.0E-3 | > 3.4dB | Very Healthy |
Environmental PM
Temperature
Modern DCO have multiple temperature sensors. The “temperature” reading reported by the operating system may be the case temperature or the DSP temperature. The laser component typically has its own temperature sensor and is reported as the laser temperature.
Voltage
The voltage supplied to the DCO is specified by various standards such as the QSFP-DD MSA specifications. The voltage should be approximately 3.3v but can vary. Larger fluctuations in the voltage indicate a hardware problem.
Laser Bias Current (LBC)
The LBC is a measure of the bias current applied to the transmit laser used to maintain stable optical transmit power. This value may change due to fluctuations in voltage and temperature. The value can be measured either as an absolute value in milliamps or a percentage of the operating threshold of the laser.
IOS-XR DCO Monitoring
The PM values we’ve introduced will be used in monitoring the health of our DCO circuit. We’ll focus on IOS-XR as the network operating system, but similar methods are usually available with other network operating systems.
“Current” Performance Data
When the user issues show commands such as “show controller optics” and “show controller coherentdsp” what is shown for PM data is the last read or “current” value or the metric. Certain data is collected at different intervals but in general all data shown has an update interval below 30s. The following tables list the instant PM data available via different methods.
CLI “show controller optics” Optical layer PM data
As you can see below the PM data we discussed in the overview section is shown when issuing the command. The “RX Power” is the total optical receive power, the “RX Signal Power” is the power of the specific coherent channel the DCO is tuned to receive.
         Laser Bias Current = 273.1 mA
         Actual TX Power = -9.95 dBm
         Actual TX Power(mW) = 0.10 mW
         RX Power = -2.92 dBm
         RX Power(mW) = 0.51 mW
         RX Signal Power = -3.15 dBm
         Frequency Offset = -1 MHz
         Laser Temperature = 51.48 Celsius
         Laser Age = 0 %
         LBC High Threshold = 98 %
         Chromatic Dispersion 2 ps/nm
         Second Order Polarization Mode Dispersion = 46.00 ps^2
         Optical Signal to Noise Ratio = 35.60 dB
         SNR = 18.80 dB
         Polarization Dependent Loss = 0.60 dB
         Polarization Change Rate = 0.00 rad/s
         Differential Group Delay = 1.00 ps
         Temperature = 52.00 Celsius
         Voltage = 3.29 V
CLI “show controller coherentdsp” Digital layer PM data
As you can see below the PM data we discussed in the overview section is shown when issuing the command.
PREFEC  BER                                     : 3.1E-04
POSTFEC BER                                     : 0.0E+00
Q-Factor                                        : 10.60 dB
Q-Margin                                        : 4.10 dB
YANG data models for “current” PM data retrieval
The following YANG model paths can be used to retrieve all of the data shown in the CLI commands. Interfaces such as NETCONF, gNMI/GRPC, or native Cisco MDT can be used to retrieve the data on demand, on change, or via periodic subscription.
YANG data model for “current” Optical PM data
Cisco-IOS-XR-controller-optics-oper:optics-oper/optics-ports/optics-port/optics-info
YANG data model for “current” Digital PM data
Cisco-IOS-XR-controller-otu-oper:otu/controllers/controller/info
SNMP MIBs for “current” PM data retrieval
In IOS-XR the optics and coherentdsp controllers are modeled as interfaces. The SNMP OIDs used for DCO monitoring will reference the interface ifIndex for the respective controller.
SNMP MIB for “current” Optical PM data
The following Cisco native SNMP MIB can be used to retrieve the current PM data.
CISCO-OPTICAL-MIB (OID 1.3.6.1.4.1.9.9.828)

IF-MIB::ifDescr.27 = STRING: Optics0/0/0/24
CISCO-OPTICAL-MIB::coiOpticalControllerFrequency.27 = Gauge32: 1940000 100 MHz
SNMP MIB for “current” Digital PM data
The following Cisco native SNMP MIB can be used to retrieve the current PM data.
CISCO-OTN-IF-MIB (OID 1.3.6.1.4.1.9.9.639)

IF-MIB::ifDescr.65 = STRING: CoherentDSP0/0/0/24
CISCO-OTN-IF-MIB::coiIfControllerPreFECBERMantissa.65 = INTEGER: 140
CISCO-OTN-IF-MIB::coiIfControllerPreFECBERExponent.65 = INTEGER: -5

Previous values equal PreFEC BER of 1.4e-05
Events and Alarms
There are many alarms associated with the state of the optics. This is not meant to be an exhaustive list of alarms, just highlight some of the more commonly seen alarms during specific events.
Platform alarms generated by DCO events are reported via the system log and output to remote monitoring tools as syslog messages and SNMP traps if enabled. These alarms will show up when executing a “show alarms” command on the CLI and retrieving alarms via YANG models such as openconfig-alarms and Cisco-IOS-XR-alarmgr-server-oper.
Optics Controller Alarm Thresholds
The following PM threshold values are defined for the optics controller. See the table below on user-configurable values. When a threshold is crossed the system will generate an alarm of different severity based on Low vs. High crossing.
It is recommended to leave the values at their defaults unless the user has characterized the optical network closely to determine proper values.
 Parameter                 High Alarm  Low Alarm  High Warning  Low Warning
 ------------------------  ----------  ---------  ------------  -----------
 Rx Power Threshold(dBm)         13.0      -24.0          10.0        -21.0
 Rx Power Threshold(mW)          19.9        0.0          10.0          0.0
 Tx Power Threshold(dBm)          4.0      -18.0           2.0        -16.0
 Tx Power Threshold(mW)           2.5        0.0           1.5          0.0
 LBC Threshold(mA)               0.00       0.00          0.00         0.00
 Temp. Threshold(celsius)       80.00      -5.00         75.00        15.00
 Voltage Threshold(volt)         3.46       3.13          3.43         3.16
 LBC High Threshold = 98 %
 Configured CD High Threshold = 160000 ps/nm
 Configured CD lower Threshold = -160000 ps/nm
 Configured OSNR lower Threshold = 9.00 dB
 Configured DGD Higher Threshold = 80.00 ps
| Parameter | Explanation | User-Configurable |
|---|---|---|
| Rx Power Threshold(dBm) | Receive power in dBm | No |
| Rx Power Threshold(mW) | Receive power in mW | No |
| Tx Power Threshold(dBm) | Transmit power in dBm | No |
| Tx Power Threshold(dBm) | Transmit power in mW | No |
| LBC High Threshold | Laser bias % of max | Yes, lbc-high-threshold command |
| Temp threshold | Case temperature of transceiver | No |
| CD High Threshold | Chromatic dispersion high | Yes, cd-high-threshold command |
| CD Low threshold | Chromatic dispersion low | Yes, cd-low-threshold command |
| OSNR Low threshold | Optical signal to noise ratio | Yes, osnr-low-threshold |
| DGD Low threshold | Differential group delay low value | Yes, dgd-low-threshold command |
Counted Optical Alarms
Based on either an event or built-in PM threshold, specific alarms increment over time. These are seen with the “show controller optics” CLI command or appropriate YANG model.
Alarm Statistics:

         -------------
         HIGH-RX-PWR = 0            LOW-RX-PWR = 0
         HIGH-TX-PWR = 0            LOW-TX-PWR = 0
         HIGH-LBC = 0               HIGH-DGD = 0
         OOR-CD = 0                 OSNR = 18
         WVL-OOL = 0                MEA  = 0
         IMPROPER-REM = 0
         TX-POWER-PROV-MISMATCH = 0
| Alarm | Expansion | Comment |
|---|---|---|
| HIGH-RX-PWR | RX power too high | |
| HIGH-TX-PWR | TX power too high | |
| LOW-RX-PWR | RX power too low | |
| LOW-TX-PWR | TX power too low | |
| HIGH-LBC | Laser bias current too high | |
| HIGH-DGD | Diffeential group delay too high | |
| OOR-CD | Chromatic dispersion out of range | |
| OSNR | Optical signal to noise ratio too low | |
| WVL-OOL | ||
| MEA | Mismatch equipment alarm | Optic speed not supported by port |
| IMPROPER-REM | Improper removal | Not applicable to IOS-XR routers |
| TX-POWER-PROV-MISMATCH | Difference in configured and actual value too large |
Counted Digital Alarms
Based on either an event or built-in PM threshold, specific alarms increment over time. These are seen with the “show controller coherentdsp” CLI command or appropriate YANG model.
Alarm Information:
LOS = 40        LOF = 0 LOM = 0
OOF = 0 OOM = 0 AIS = 0
IAE = 0 BIAE = 0        SF_BER = 0
SD_BER = 0      BDI = 0 TIM = 0
FECMISMATCH = 0 FEC-UNC = 0     FLEXO_GIDM = 0
FLEXO-MM = 0    FLEXO-LOM = 0   FLEXO-RDI = 0
FLEXO-LOF = 35
Detected Alarms                                 : LOS
| Alarm | Expansion | Comment |
|---|---|---|
| LOS | Loss of signal | In IOS-XR <24.1.1 this is based on the RX power being below the sensitivity threshold, but possible for signal to still be up |
| LOF | Loss of frame | Not used for ZR/ZR+ |
| LOM | Loss of multi-frame | Not used for ZR/ZR+ |
| OOF | Out of frame | Not used for ZR/ZR+ |
| OOM | Out of multi-frame | Not used for ZR/ZR+ |
| IAE | Incoming alignment error | Not used for ZR/ZR+ |
| BIAE | Backward incoming alignment error | Not used for ZR/ZR+ |
| SF_BER | Signal fault due to high Bit-Error rate | Not used for ZR/ZR+ |
| SD_BER | Signal degrade due to high Bit-Error rate | Not used for ZR/ZR+ |
| BDI | Backward defect indication | Not used for ZR/ZR+ |
| TIM | Trace identifier mismatch, OTN TTI mismatch | Not used for ZR/ZR+ |
| FECMISMATCH | FEC Mismatch between endpoints | Not used for ZR/ZR+ |
| FEC-UNC | Uncorrectable words | |
| FLEXO-GIDM | FlexO framing group ID mismatch | Not used for ZR/ZR+ |
| FLEXO-MM | FlexO multi-frame mismatch | Not used for ZR/ZR+ |
| FLEXO-LOM | FlexO framing loss of multi-frame | Common alarm |
| FLEXO-RDI | FlexO remote defect indicator | Not used for ZR/ZR+ |
| FLEXO-LOF | FlexO loss of frame | Common alarm |
Common Optical Alarms
%PKT_INFRA-FM-3-FAULT_MAJOR : ALARM_MAJOR :OPTICS RX LOS LANE-0 :DECLARE :0/RP0/CPU0:  Optics0/0/0/10
%PKT_INFRA-FM-3-FAULT_MAJOR : ALARM_MAJOR :OPTICS RX LOL LANE-0 :DECLARE :0/RP0/CPU0:  Optics0/0/0/10
%PKT_INFRA-FM-3-FAULT_MAJOR : ALARM_MAJOR :OPTICS MEDIA RX CHROMATIC DISPERSION LOSS OF LOCK :DECLARE :0/RP0/CPU0:  Optics0/0/0/10
%PKT_INFRA-FM-3-FAULT_MAJOR : ALARM_MAJOR :OPTICS MEDIA RX LOSS OF FRAME  :DECLARE :0/RP0/CPU0:  Optics0/0/0/10
%PKT_INFRA-FM-4-FAULT_MINOR : ALARM_MINOR :OSNR :DECLARE :Optics0/0/0/20
Common Digital Alarms
%PKT_INFRA-FM-3-FAULT_MAJOR : ALARM_MAJOR :OPTICS MEDIA FEC DEGRADED :DECLARE :0/RP0/CPU0:  Optics0/0/0/10
%PKT_INFRA-FM-3-FAULT_MAJOR : ALARM_MAJOR :OPTICS MEDIA FEC EXCESS DEGRADED :DECLARE :0/RP0/CPU0:  Optics0/0/0/10
%PKT_INFRA-FM-2-FAULT_CRITICAL : ALARM_CRITICAL :FLEXO-LOF :DECLARE :CoherentDSP0/0/0/10:
Common Alarms on Fiber Cut
The active alarms on the device can be shown using the “show alarms brief system active”
--------------------------------------------------------------------------------
Active Alarms (Brief) for 0/RP0
--------------------------------------------------------------------------------
Location        Severity     Group            Set Time                 Description
--------------------------------------------------------------------------------
0/RP0/CPU0      Major        Software         11/30/2023 12:11:06 PST   Optics0/0/0/0 - hw_optics:  RX LOS LANE-0 ALARM
0/RP0/CPU0      Major        Software         11/30/2023 12:11:06 PST   Optics0/0/0/0 - hw_optics:  RX POWER LANE-0 LOW ALARM

--------------------------------------------------------------------------------
Conditions (Brief) for 0/RP0
--------------------------------------------------------------------------------
Location        Severity     Group            Set Time                 Description
--------------------------------------------------------------------------------
0/0             Critical     OTN              11/30/2023 12:11:06 PST  CoherentDSP0/0/0/0 - Incoming Payload Signal Absent
IOS-XR Performance Measurement Engine and Threshold Crossing Alerts
Another class of flexible monitoring and alerting is available to the user using IOS-XR’s Performance Measurement Engine feature.
Performance Measurement Engine Overview
Select metric data in IOS-XR is collected and stored at regular intervals for consumption by the user or management systems. The data by default is collected across three different time periods or “bins/buckets”: 10s, 30s, 15m, and 24h. Within each period the min, max, and avg values during the period are stored. This can take some of the burden off the management system as it no longer needs to calculate these values.
The actual collection interval is dependent on the specific metric. As an example even though the storage bucket is 30 seconds, some data is collected at a faster cadence such as every 5 seconds. The “flex-bin” option uses a period of 10s and is not user configurable. The flex-bin period can be used to mimic the behavior of current/instantaneous PM.
Performance Measurement History
Data collected using the PM Engine is stored on the router for a number of time periods. The following table lists how many historical periods are stored for each time period.
Note the data will NOT be retained across a router reload
| Period | History buckets | Max history |
|---|---|---|
| flex-bin (10s) | 1 | NA |
| 30s | 30 | 15m |
| 15m | 32 | 8h |
| 24h | 7 | 7d |
Optics Controller PM Engine metrics
The following table lists all of the available optics controller PM metrics
| Metric | Units | Definition |
|---|---|---|
| LBC | mA | Laser bias current |
| OPT | dBm in .01 increment | Optical power transmit |
| OPR | dBm in .01 increment | Optical power receive |
| CD | ps/nm | Chromatic dispersion |
| DGD | ps | Differential group delay |
| OSNR | dB | Optical signal to noise ratio |
| SOPMD | ps^2 | Second order polarization mode dispersion |
| PDL | dB | Polarization dependent loss |
| PCR | rad/s | Polarization change rate |
| RX_SIG | dBm in .01 increments | Coherent signal power |
| FREQ_OFF | Mhz | Frequency offset, difference between expected and actual receive frequency |
| SNR | dB | Signal to noise ratio (not OSNR) |
Coherent DSP Controller PM Engine metrics
| Metric | Units | Definition |
|---|---|---|
| EC-BITS | NA | Number of error corrected bits in interval |
| UC-WORDS | NA | Uncorrectable words in interval |
| PreFEC BER | Rate | Pre-FEC bit error rate |
| PostFEC BER | Rate | Post-FEC bit error rate |
| Q | dB | Quality factor |
| Q_Margin | Quality margin | |
| Host-Intf-0-FEC-BER | Host side FEC it error rate | |
| Host-Intf-0-FEC-FERC | Host side FEC received corrected |
Note the last two metrics are associated with the electrical connection to the Ethernet PHY/NPU
Displaying and retrieving PM Engine Data
The data being collected by the PM Engine can be displayed using CLI commands or retrieved using the following YANG models and paths.
The CLI command to output the optics controller PM Engine data is the following:
show controllers optics 0/0/0/10 pm <current,history> <flex-bin,30-sec,15-min,24-hour> optics 1
Note the last “1” is the lane, which will always be 1 for DCO.
This results in the following output:
RP/0/RP0/CPU0:ron-poc-8201-1#show controllers optics 0/0/0/10 pm current 30-sec optics 1
Mon Feb 19 09:53:38.238 PST

Optics in the current interval [09:53:30 - 09:53:38 Mon Feb 19 2024]

Optics current bucket type : Valid
             MIN       AVG       MAX      Operational      Configured      TCA   Operational      Configured     TCA
                                          Threshold(min)   Threshold(min) (min) Threshold(max)   Threshold(max) (max)
LBC[mA ]     : 273       273       273      0                 NA              NO   524              NA              NO
OPT[dBm]     : -9.98     -9.98     -9.98    -15.09            NA              NO   5.00             NA              YES
OPR[dBm]     : -2.92     -2.92     -2.91    5.00              5.00            YES  8.00             10.00           YES
CD[ps/nm]    : 2         2         3        -160000           NA              YES  160000           NA              YES
DGD[ps ]     : 1.00      1.00      1.00     0.00              NA              NO   80.00            NA              NO
SOPMD[ps^2]  : 41.00     44.89     48.00    0.00              NA              NO   2000.00          NA              NO
OSNR[dB]     : 35.10     35.38     35.60    0.00              NA              YES  40.00            NA              YES
PDL[dB]      : 0.60      0.66      0.70     0.00              NA              NO   7.00             NA              NO
PCR[rad/s]   : 0.00      0.00      0.00     0.00              NA              NO   2500000.00       NA              NO
RX_SIG[dBm]  : -3.15     -3.15     -3.14    -10.00            -10.00          YES  1.00             5.00            YES
FREQ_OFF[Mhz]: -14       -13       -12      -3600             NA              NO   3600             NA              NO
SNR[dB]      : 18.90     18.90     18.90    7.00              NA              NO   100.00           NA              NO
The CLI command to output the coherent DSP controller PM Engine data is the following:
show controllers coherentDSP 0/0/0/10 pm <current,history> <flex-bin,30-sec,15-min,24-hour> fec
This results in the following output:
RP/0/RP0/CPU0:ron-poc-8201-1#show controllers coherentDSP 0/0/0/10 pm current 30-sec fec
Mon Feb 19 09:58:33.576 PST

g709 FEC in the current interval [09:58:30 - 09:58:33 Mon Feb 19 2024]

FEC current bucket type : Valid
    EC-BITS   : 729415917               Threshold : 111484000000           TCA(enable)  : YES
    UC-WORDS  : 0                       Threshold : 5                      TCA(enable)  : YES

                                      MIN       AVG        MAX      Threshold      TCA     Threshold     TCA
                                                                       (min)     (enable)    (max)     (enable)
PreFEC BER                     :   3.2E-04   3.2E-04   3.2E-04      0E-15        NO       0E-15        NO
PostFEC BER                    :     0E-15     0E-15     0E-15      0E-15        NO       0E-15        NO
Q[dB]                          :     10.60     10.60     10.70      0.00         NO        0.00        NO
Q_Margin[dB]                   :      4.10      4.10      4.10      5.00         YES       0.00        NO
Host-Intf-0-FEC-BER            :     0E-15     0E-15     0E-15      0E-15        NO       0E-15        NO
Host-Intf-0-FEC-FERC           :     0E-15     0E-15     0E-15      0E-15        NO       0E-15        NO
YANG data models for XR PM Engine data retrieval
The following YANG model paths can be used to retrieve all of the data shown in the CLI commands. Interfaces such as NETCONF, gNMI/GRPC, or native Cisco MDT can be used to retrieve the data on demand, on change, or via periodic subscription.
Note the sensor path being used is dependent on whether retrieving current or historical data and the time period/bucket being used for retrieval. In the example given below the parent path is shown and then the path for retrieving the current dataset for the 30 second time period. “second30” can be replaced with minute15, hour24, or flex-bin.
YANG data model for current or historical PM Engine Optical PM data
Cisco-IOS-XR-pmengine-oper:performance-management/optics
Cisco-IOS-XR-pmengine-oper:performance-management-history/global/periodic/optics-history/optics-port-histories
Cisco-IOS-XR-pmengine-oper:performance-management/optics/optics-ports/optics-port/optics-current/optics-second30/optics-second30-optics/optics-second30-optic
YANG data model for current or historical PM Engine Digital PM data
Cisco-IOS-XR-pmengine-oper:performance-management/otu
Cisco-IOS-XR-pmengine-oper:performance-management-history/global/periodic/otu-history
Cisco-IOS-XR-pmengine-oper:performance-management/otu/otu-ports/otu-port/otu-current/otu-second30/otu-second30fecs/otu-second30fec
The data can also be retrieved using the following native YANG models and paths:
Optical PM Engine data native model path
Cisco-IOS-XR-pmengine-oper:performance-management/optics
Digital PM Engine data native model path
Cisco-IOS-XR-pmengine-oper:performance-management/otu/otu-ports/otu-port
The PM Engine data can also be retrieved via the following SNMP MIB
PM Threshold Crossing Alert Overview
User defined TCAs can be set for the metrics the PM infrastructure collects. The TCAs can be set for the min and max values collected. TCAs can be individually set for each time interval. TCA also includes the ability to report when a min or max TCA has been crossed. TCAs are not stored as system alarms, they are recorded in the main system log and also reported as syslog/SNMP traps if the system is configured to report those.
Keep in mind that a TCA alert will be generated every time interval the alert is configured for. If TCA reporting is enabled for a min RX power in the 30s bucket, an alert will be generated every 30s the RX power is below the min threshold.
Performance measurement configuration
Performance measurement for all available metrics is enabled by default on DCO for both the optics controller and coherentdsp controller. See the tables below for a list of all PM metrics collected for each.
Threshold crossing alert configuration
Most metrics collected by the PM infrastructure have pre-defined TCA min/max values, but those can be changed by the user to match their specific deployment.
TCA reporting is not enabled by default on the optics and coherentdsp controller except for the following exception: The coherentDSP controller has two TCAs set by the system,”EC-BITS” and “UC-WORDS.” The EC-BITS is a measurement of error corrected bits over the time interval and UC-WORDS is a measure of the uncorrectable words post-FEC. These are absolute values and not time-series metrics. The EC-BITS is set by the system based on the current rate of the DCO and should not be changed.
Reporting must be enabled for both min and max values for the metric and for specific time intervals.
Optical Controller TCA alert configuration example
This example shows configuring the TCAs via XR CLI, however the TCAs could also be configured using the appropriate YANG models.
The following configuration does the following:
- Enables TCA reporting for crossing the min threshold for opr,cd,osnr,rx-sig-pow
- Enables TCA reporting for crossing the max threshold for opt, opr, cd, osnr,rx-sig-pow
- Changes default optical power receive min threshold to 1 dBm (100*.01)
- Changes default optical power receive max threshold to 10 dBm (1000*.01)
controller Optics0/0/0/10
 pm 30-sec optics report opr min-tca
 pm 30-sec optics report cd min-tca
 pm 30-sec optics report osnr min-tca
 pm 30-sec optics report rx-sig-pow min-tca
 pm 30-sec optics report opt max-tca
 pm 30-sec optics report opr max-tca
 pm 30-sec optics report cd max-tca
 pm 30-sec optics report osnr max-tca
 pm 30-sec optics report rx-sig-pow max-tca
 pm 30-sec optics threshold opr-dbm min 100
 pm 30-sec optics threshold opr-dbm max 1000
You can see below TCAs are now enabled for the appropriate parameters.
RP/0/RP0/CPU0:ron-poc-8201-1#show controllers optics 0/0/0/10 pm current 30-sec optics 1
Thu Feb 22 06:15:22.811 PST

Optics in the current interval [06:15:00 - 06:15:22 Thu Feb 22 2024]

Optics current bucket type : Valid
             MIN       AVG       MAX      Operational      Configured      TCA   Operational      Configured     TCA
                                          Threshold(min)   Threshold(min) (min) Threshold(max)   Threshold(max) (max)
LBC[mA ]     : 273       273       273      0                 NA              NO   524              NA              NO
OPT[dBm]     : -10.01    -10.00    -9.96    -15.09            NA              NO   5.00             NA              YES
OPR[dBm]     : -2.96     -2.93     -2.91    5.00              5.00            YES  8.00             10.00           YES
CD[ps/nm]    : 2         3         4        -160000           NA              YES  160000           NA              YES
DGD[ps ]     : 1.00      1.00      1.00     0.00              NA              NO   80.00            NA              NO
SOPMD[ps^2]  : 43.00     51.22     59.00    0.00              NA              NO   2000.00          NA              NO
OSNR[dB]     : 35.20     35.40     35.60    0.00              NA              YES  40.00            NA              YES
PDL[dB]      : 0.60      0.62      0.70     0.00              NA              NO   7.00             NA              NO
PCR[rad/s]   : 0.00      0.00      0.00     0.00              NA              NO   2500000.00       NA              NO
RX_SIG[dBm]  : -3.14     -3.14     -3.13    -10.00            -10.00          YES  1.00             5.00            YES
FREQ_OFF[Mhz]: -12       -5        -2       -3600             NA              NO   3600             NA              NO
SNR[dB]      : 18.80     18.83     18.90    7.00              NA              NO   100.00           NA              NO
CoherentDSP (Digital) Controller TCA alert configuration example
This example shows configuring the TCAs via XR CLI, however the TCAs could also be configured using the appropriate YANG models.
The following configuration does the following:
- Enables TCA reporting for crossing the min threshold for Q-margin
- Changes default Q-margin min threshold to 5
controller CoherentDSP0/0/0/10
pm 30-sec fec report Q-margin min-tca enable</font>
 pm 30-sec fec threshold Q-margin min 500
You can see below TCA is now enabled for the min threshold for the 30-second bucket.
RP/0/RP0/CPU0:ron-poc-8201-1#show controllers coherentDSP 0/0/0/10 pm current 30-sec fec
Thu Feb 22 06:03:27.771 PST

g709 FEC in the current interval [06:03:00 - 06:03:27 Thu Feb 22 2024]

FEC current bucket type : Valid
    EC-BITS   : 4326181146              Threshold : 111484000000           TCA(enable)  : YES
    UC-WORDS  : 0                       Threshold : 5                      TCA(enable)  : YES

                                      MIN       AVG        MAX      Threshold      TCA     Threshold     TCA
                                                                       (min)     (enable)    (max)     (enable)
PreFEC BER                     :   2.9E-04   3.1E-04   3.2E-04      0E-15        NO       0E-15        NO
PostFEC BER                    :     0E-15     0E-15     0E-15      0E-15        NO       0E-15        NO
Q[dB]                          :     10.60     10.63     10.70      0.00         NO        0.00        NO
Q_Margin[dB]                   :      4.10      4.10      4.10      5.00         YES       0.00        NO
Host-Intf-0-FEC-BER            :     0E-15   8.3E-14   2.3E-10      0E-15        NO       0E-15        NO
Host-Intf-0-FEC-FERC           :     0E-15     0E-15     0E-15      0E-15        NO       0E-15        NO
TCA alert message example
The following will be shown in the system logs when a TCA is crossed. This example is when the Q-Margin has dropped below the min value of 5.0. All PM TCA alarms will use the L1-PMENGINE-4-TCA nomenclature when being logged.
RP/0/RP0/CPU0:2024 Feb 5 08:07:30.185 PST: optics_driver[192]: %L1-PMENGINE-4-TCA : Port CoherentDSP0/0/0/10 reports FEC Q-MARGIN-MIN(NE) PM TCA with current value 4.10, threshold 5.00 in current 30-sec interval window
Monitoring DCO using Cisco Network Automation
Crosswork Hierarchical Controller
Crosswork Hierarchical Controller or HCO has capabilities for monitoring Routed Optical Networking PM for both the IP and Optical Line System layers in the same tool together. HCO’s Link Assurance application presents and end to end multi-layer view of circuits using DCO endpoints and overlays relevant PM data on the view.
Link Assurance with PM Data
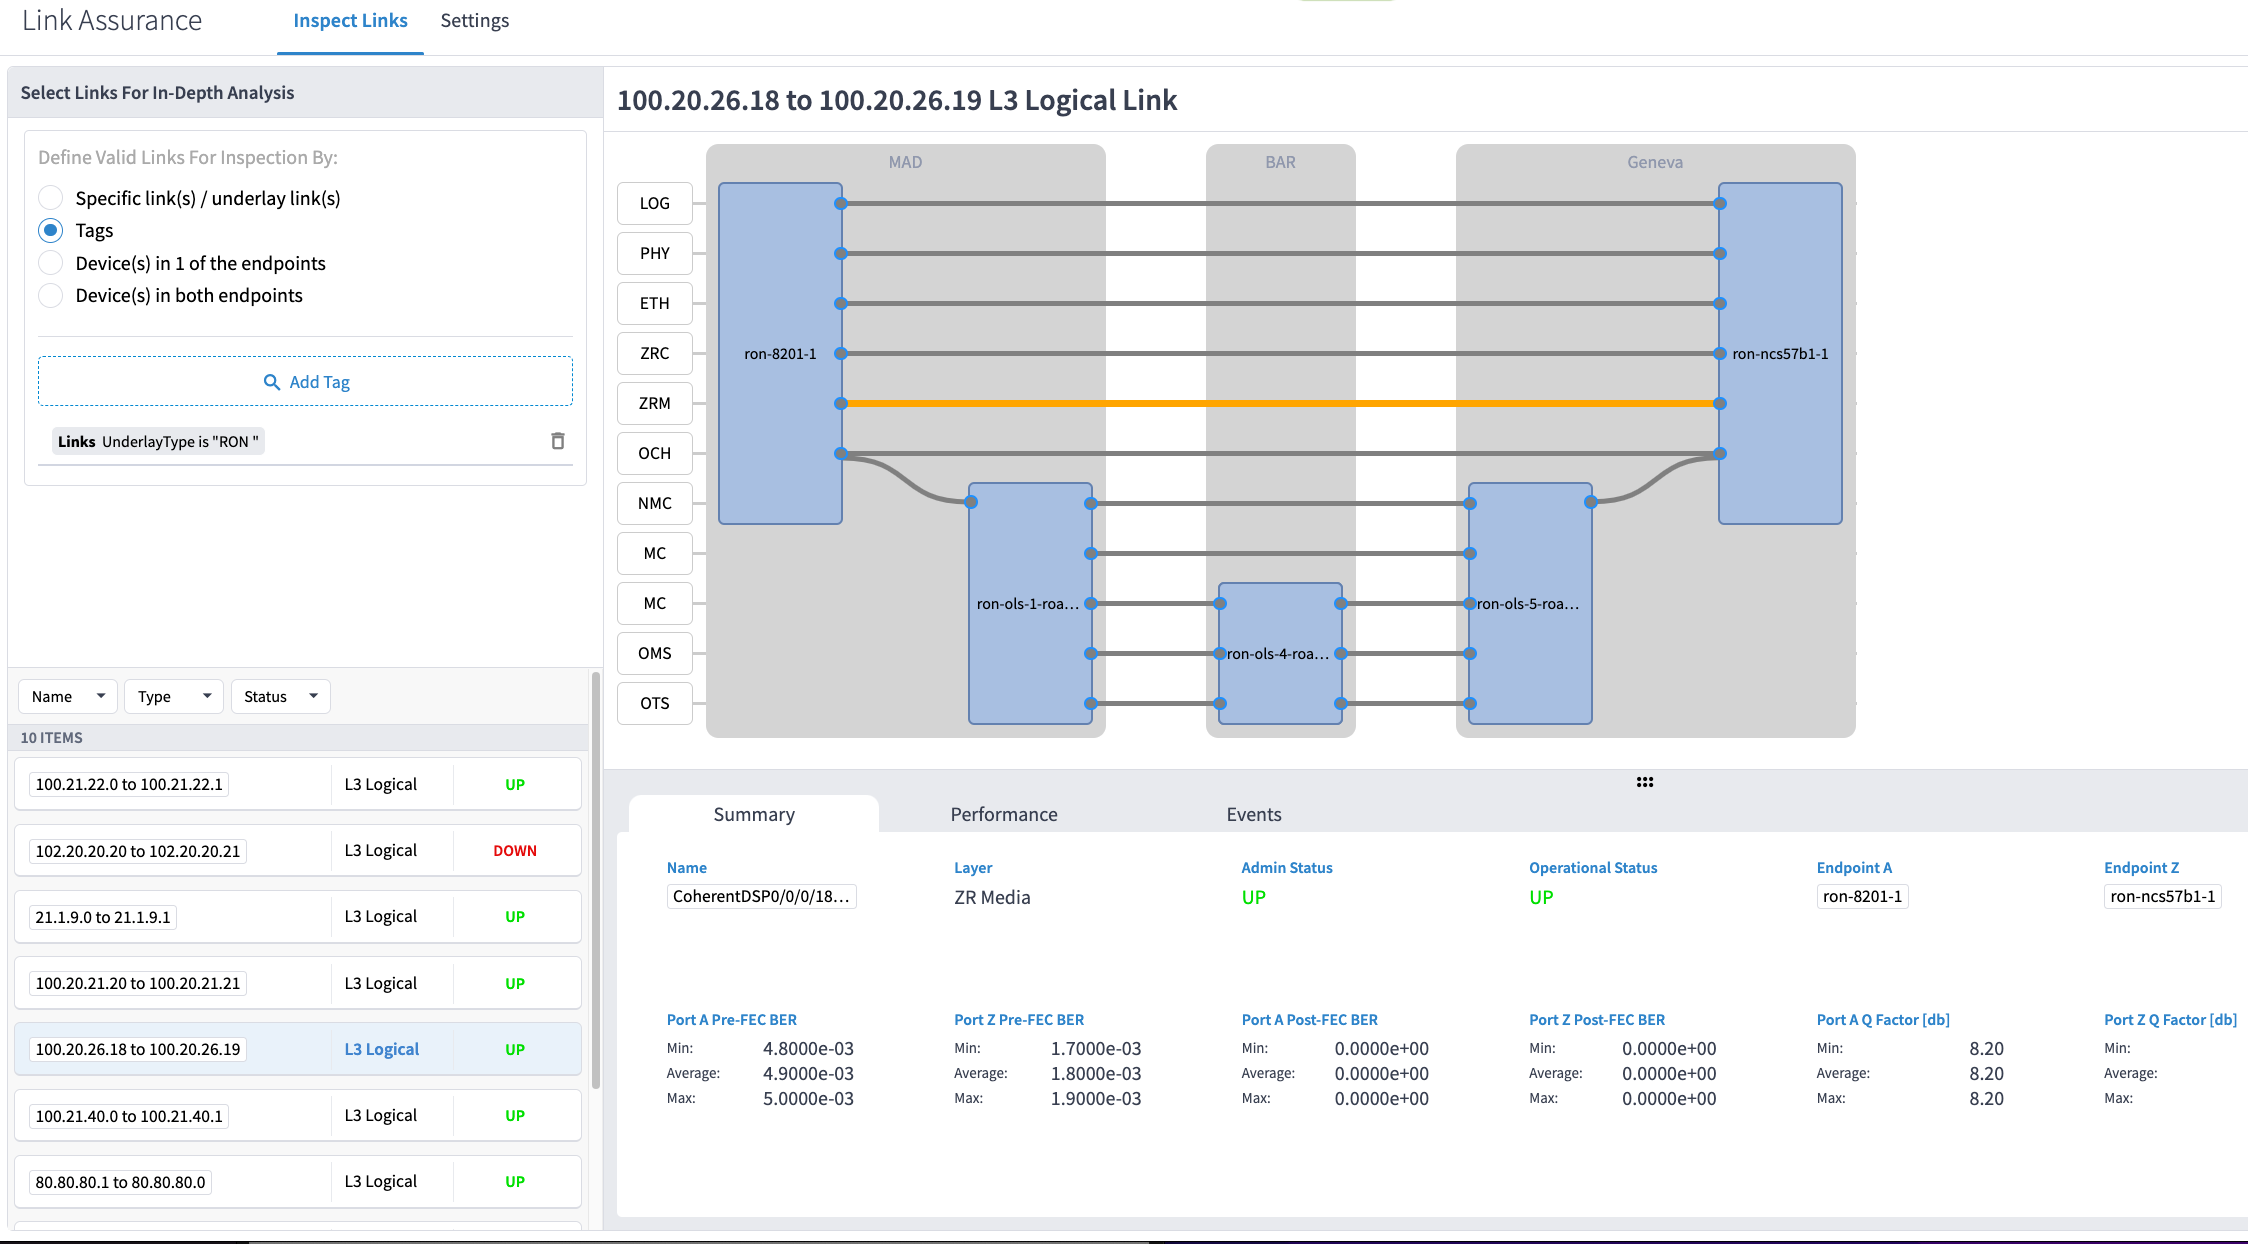
HCO’s Performance application allows the user to explore the PM data at a device and interface level in a tabular format. The user can query based on a device or set of devices. The DCO data is
Crosswork Network Controller Device Level Monitoring
The Health Insights application within CNC can be used to monitor any available telemetry sensor paths including the Optical and Digital PMs we’ve discussed. Health Insights can also be configured to alert based on different criteria such as deviations in measured valued or absolute value changes. The Health Insights documentation located here can be used as a reference:
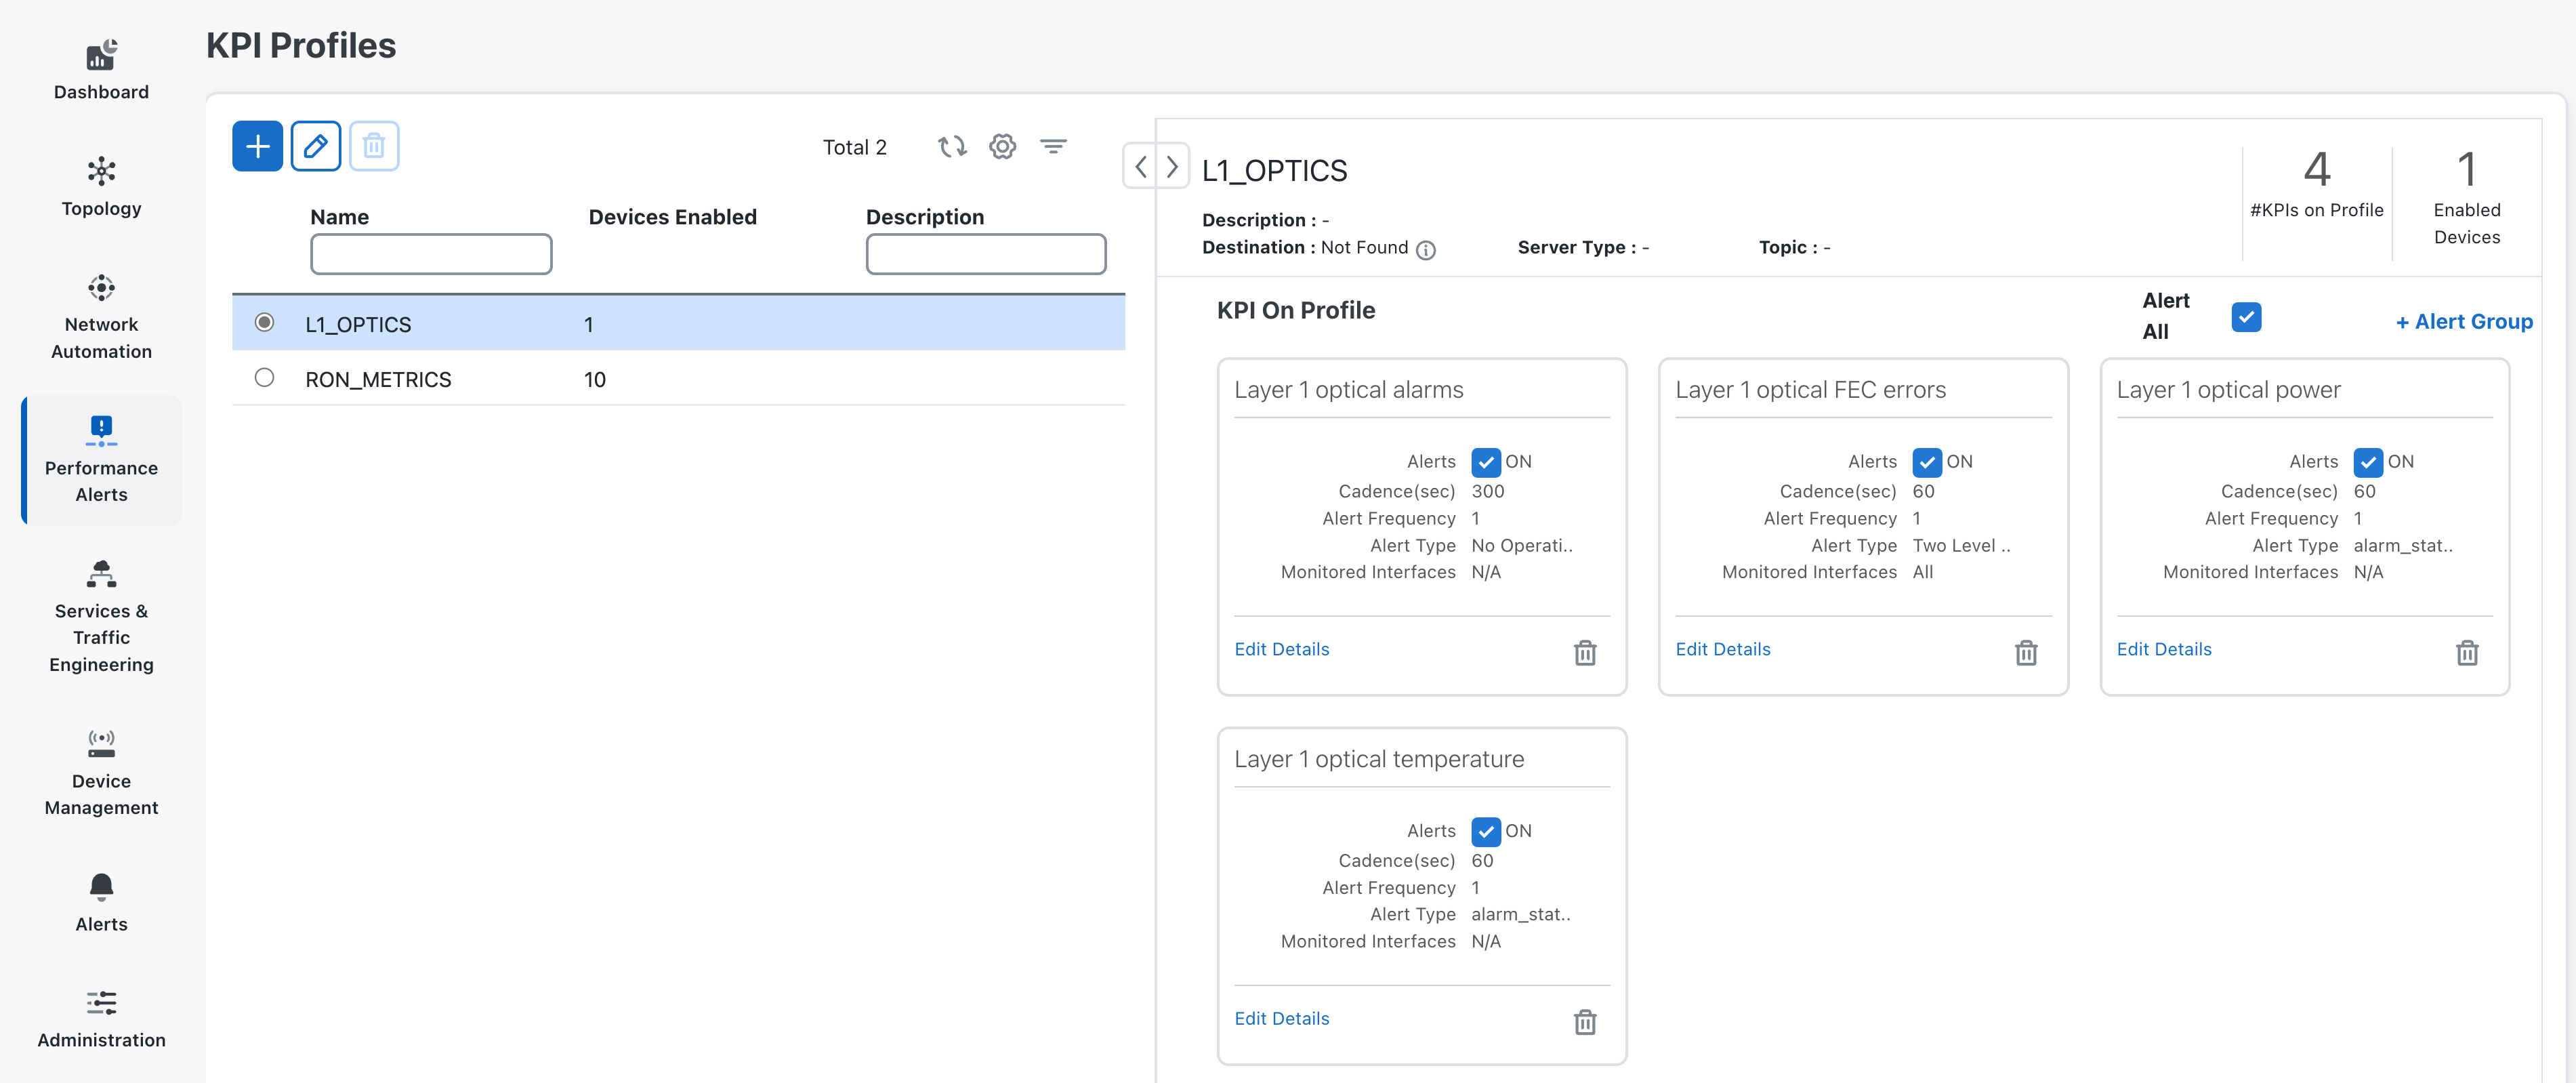
Key Performance Indicators and KPI Profiles
A KPI in Health Insights is used to monitor a specific telemetry sensor PM attribute. In YANG these refer to the YANG operational mode leaf values.
A set of KPIs are grouped together as part of a KPI Profile. This allows the user to have a set of KPIs applied to a set of devices without having to manage per-device individual KPIs. When a KPI is added or removed from an active profile, telemetry collection will start for the devices using the KPI profile.
Health insights includes a built-in set of pre-defined KPIs under the “Layer1-Optics” category. These sensor paths can be used to monitor both DCO and gray optics.
L1 Optics Available PM Metrics
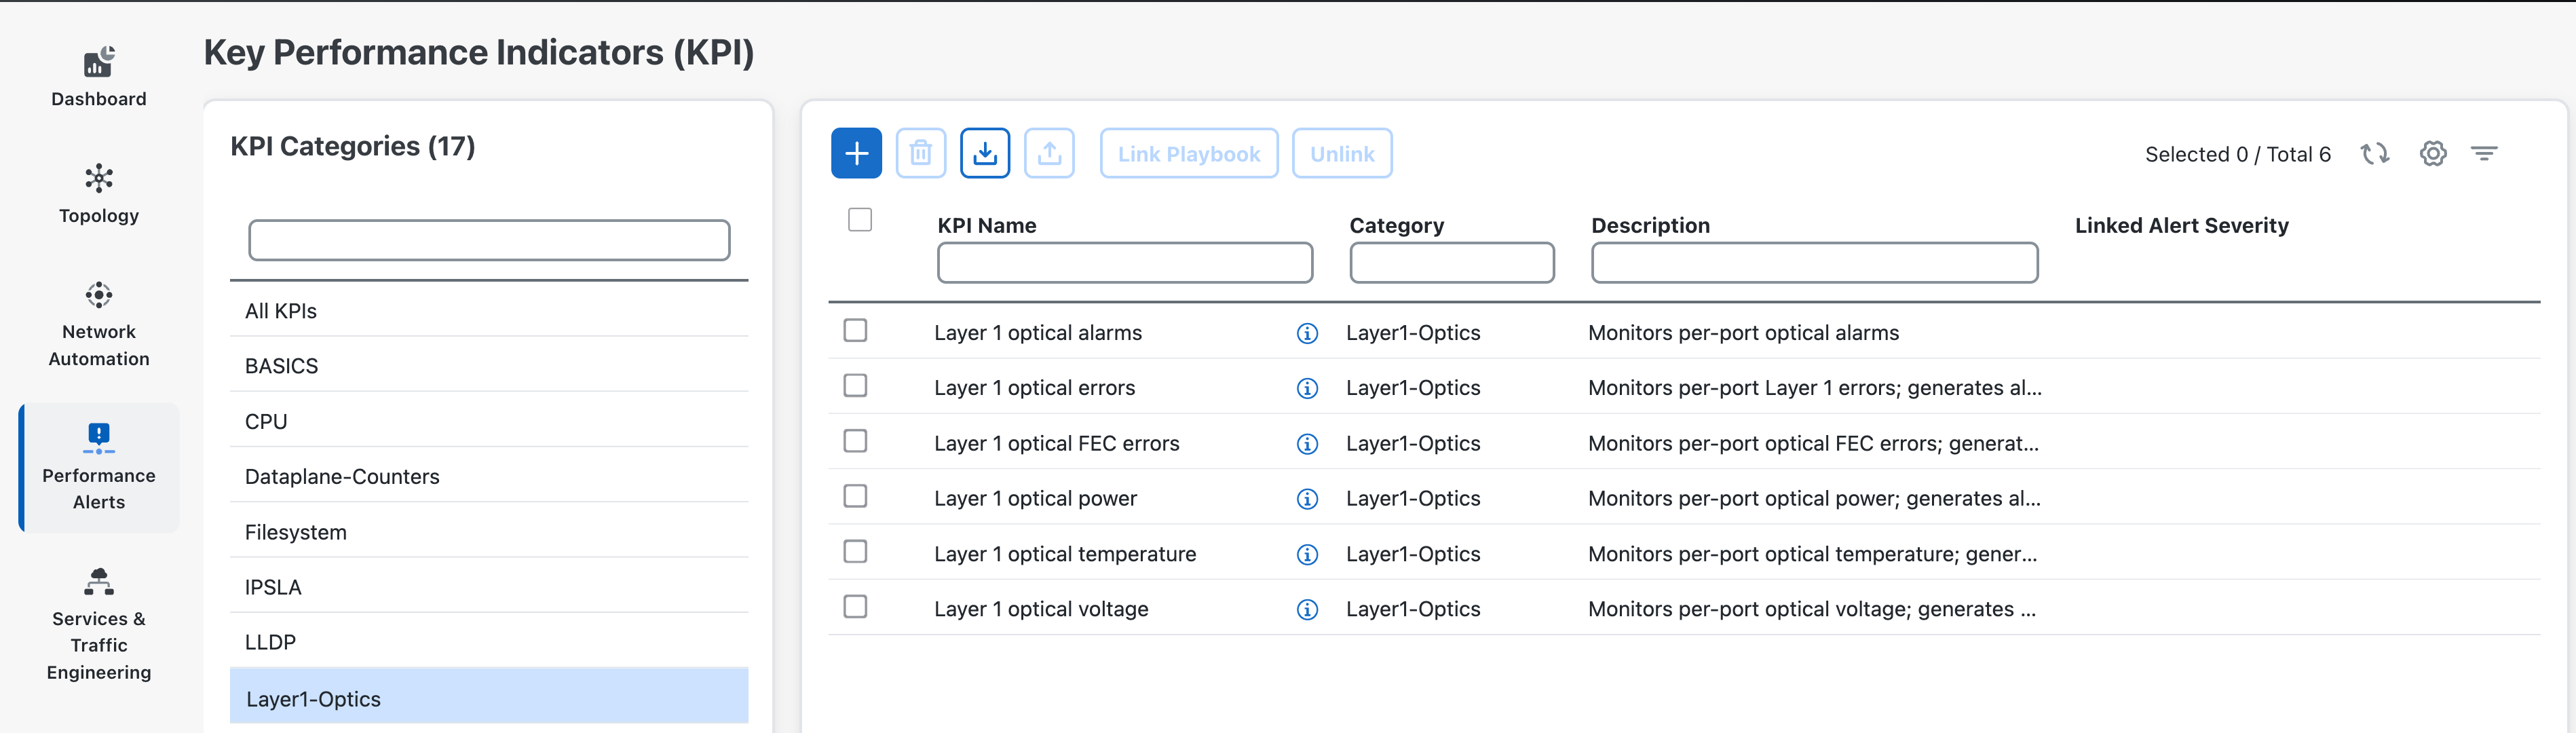
L1 Optics KPI Profile
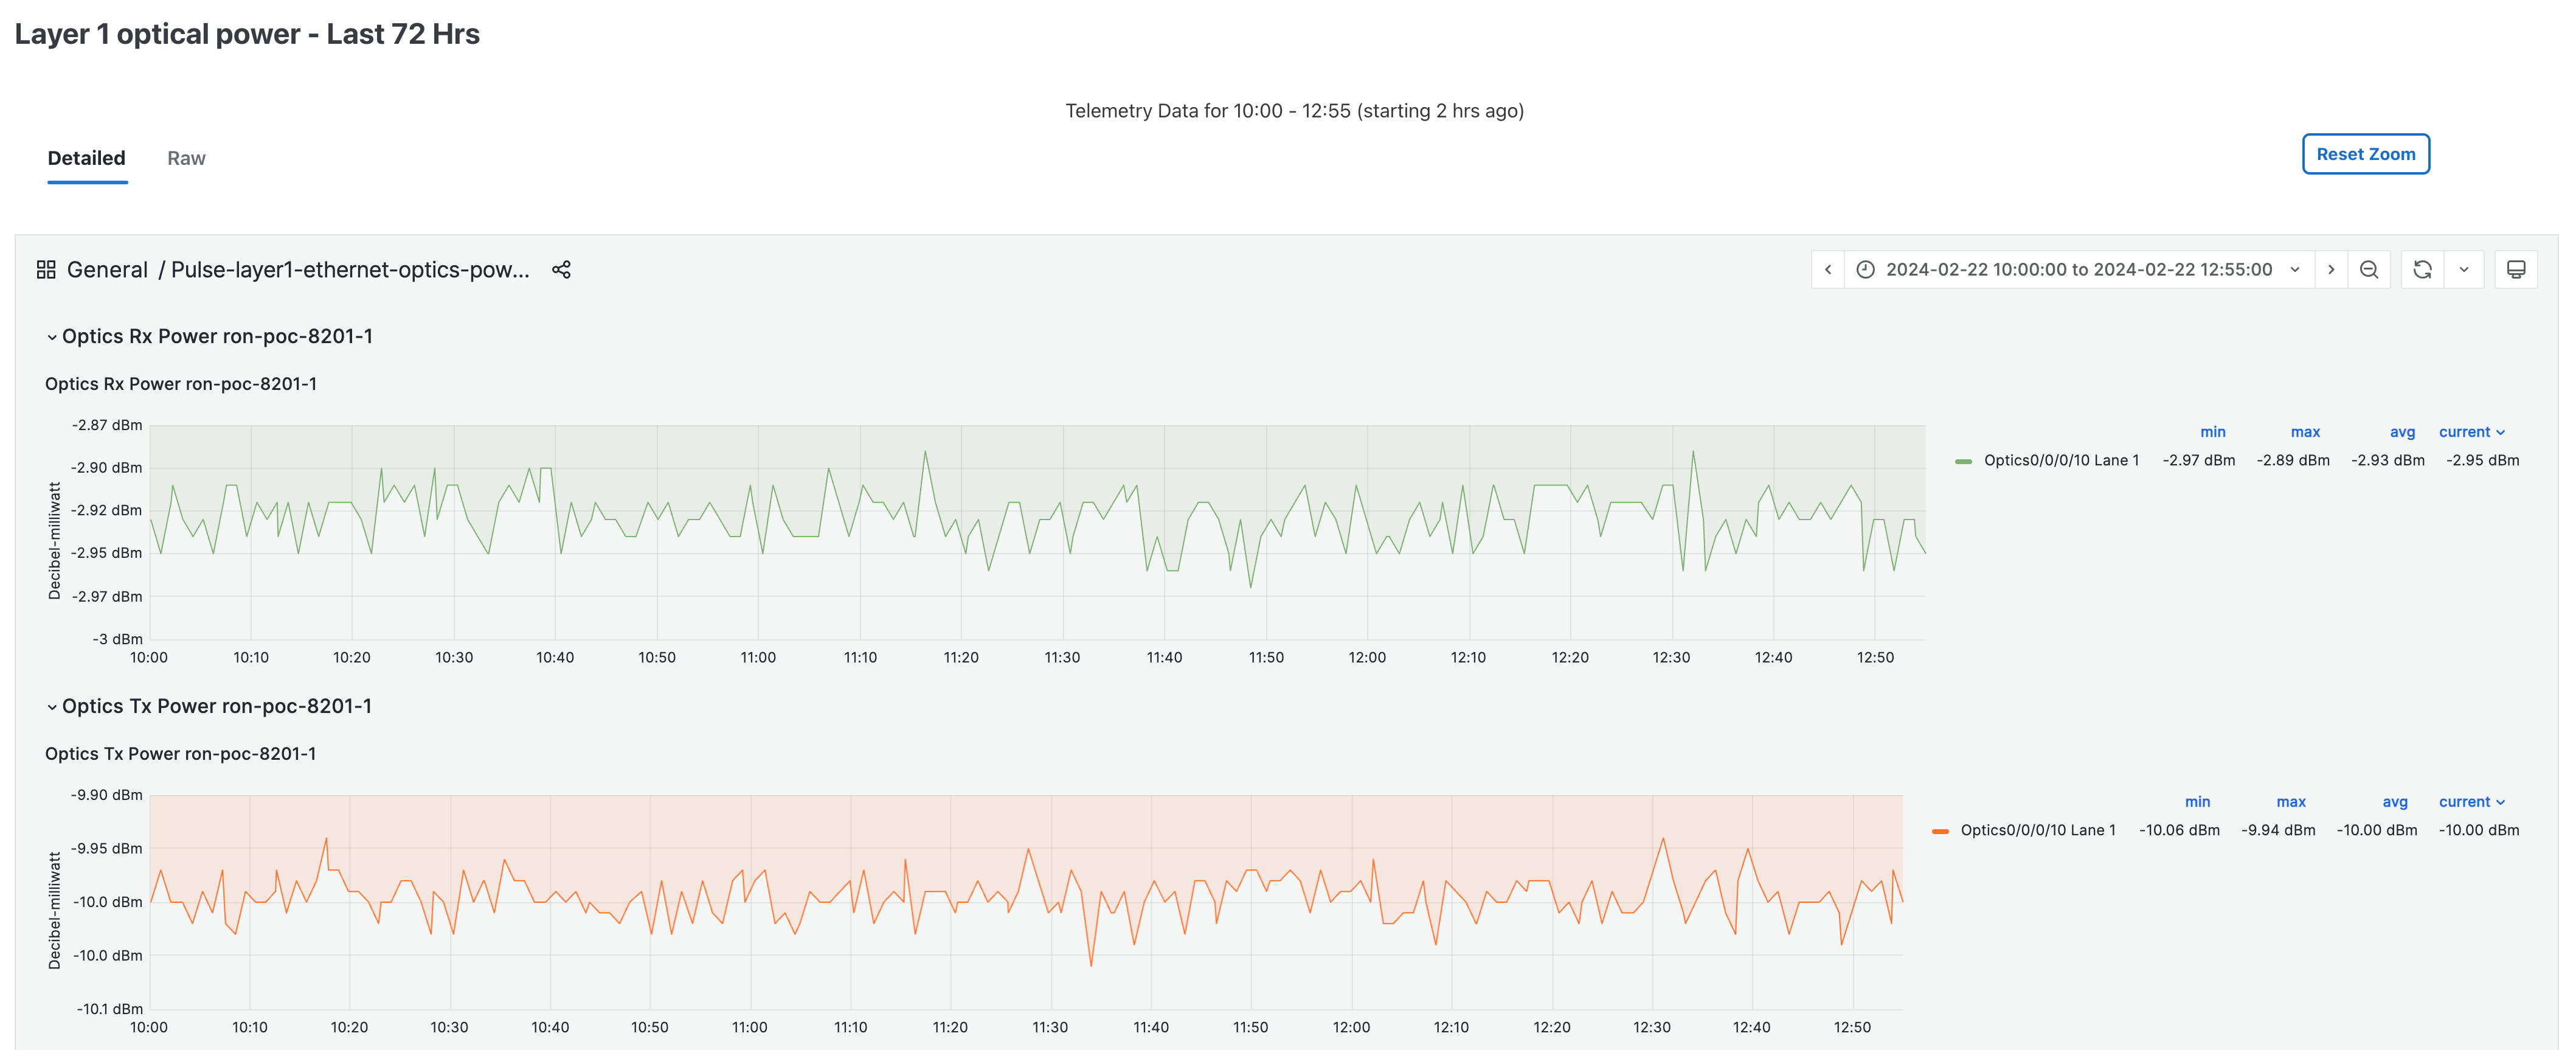
L1 optics power data
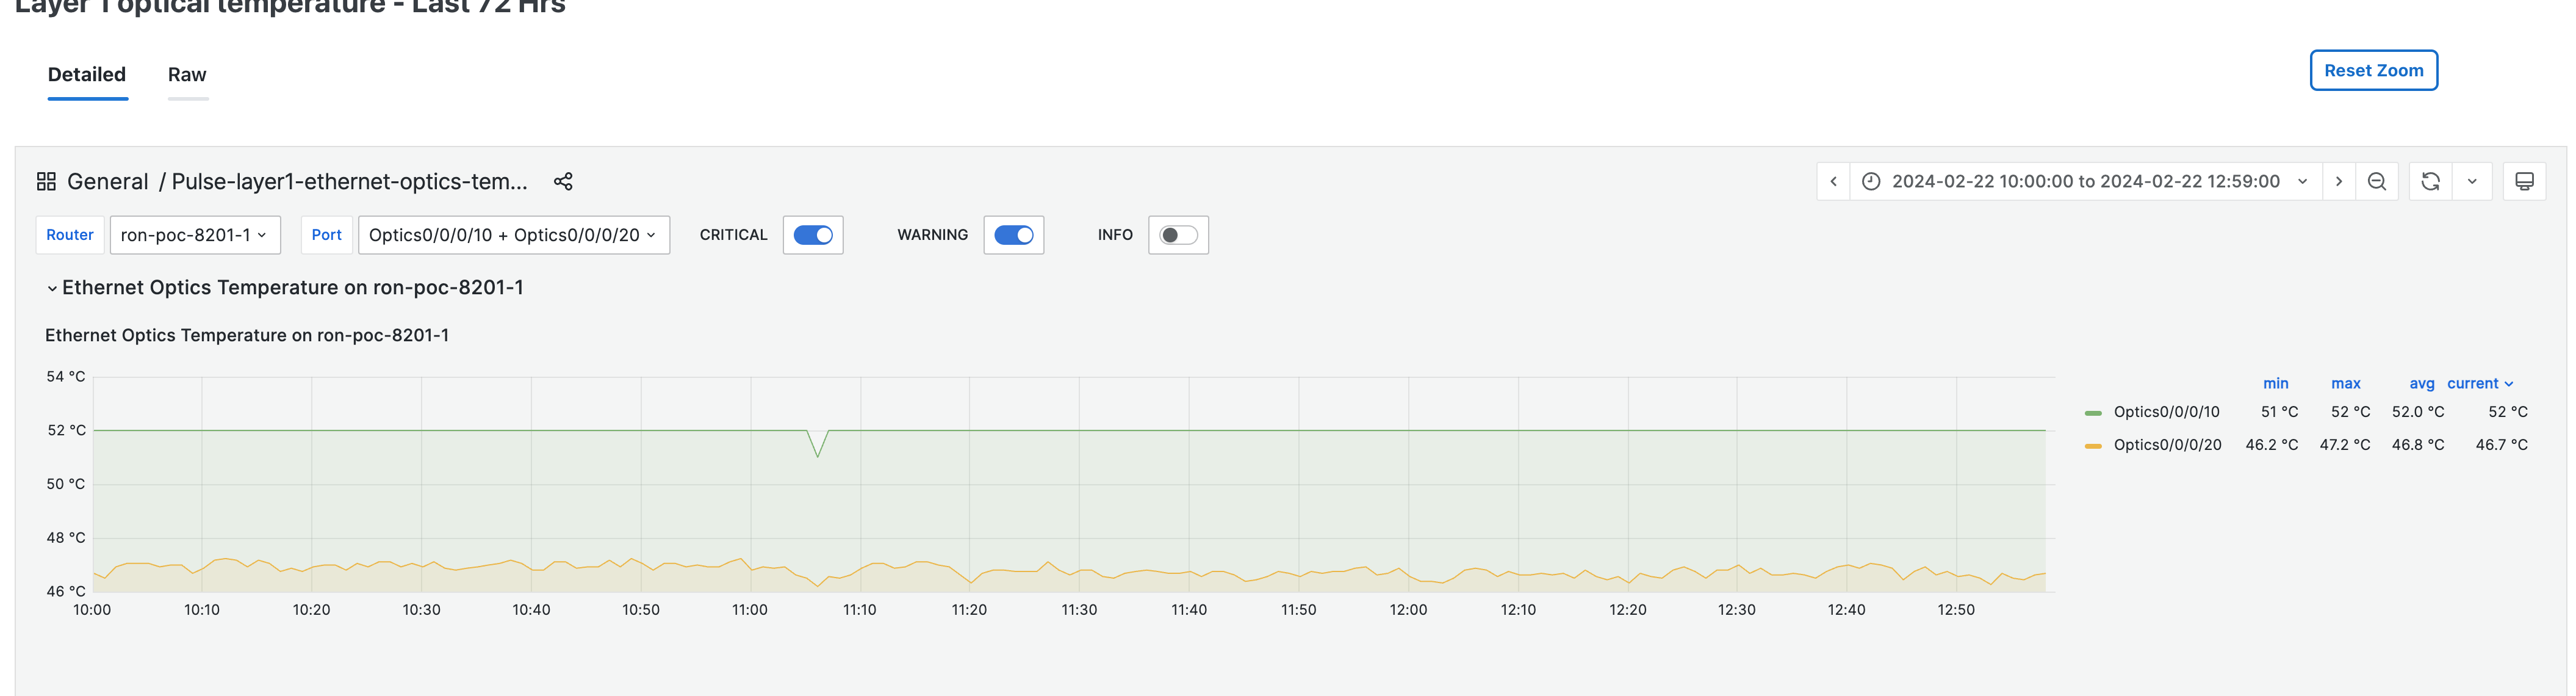
L1 optics temperature data
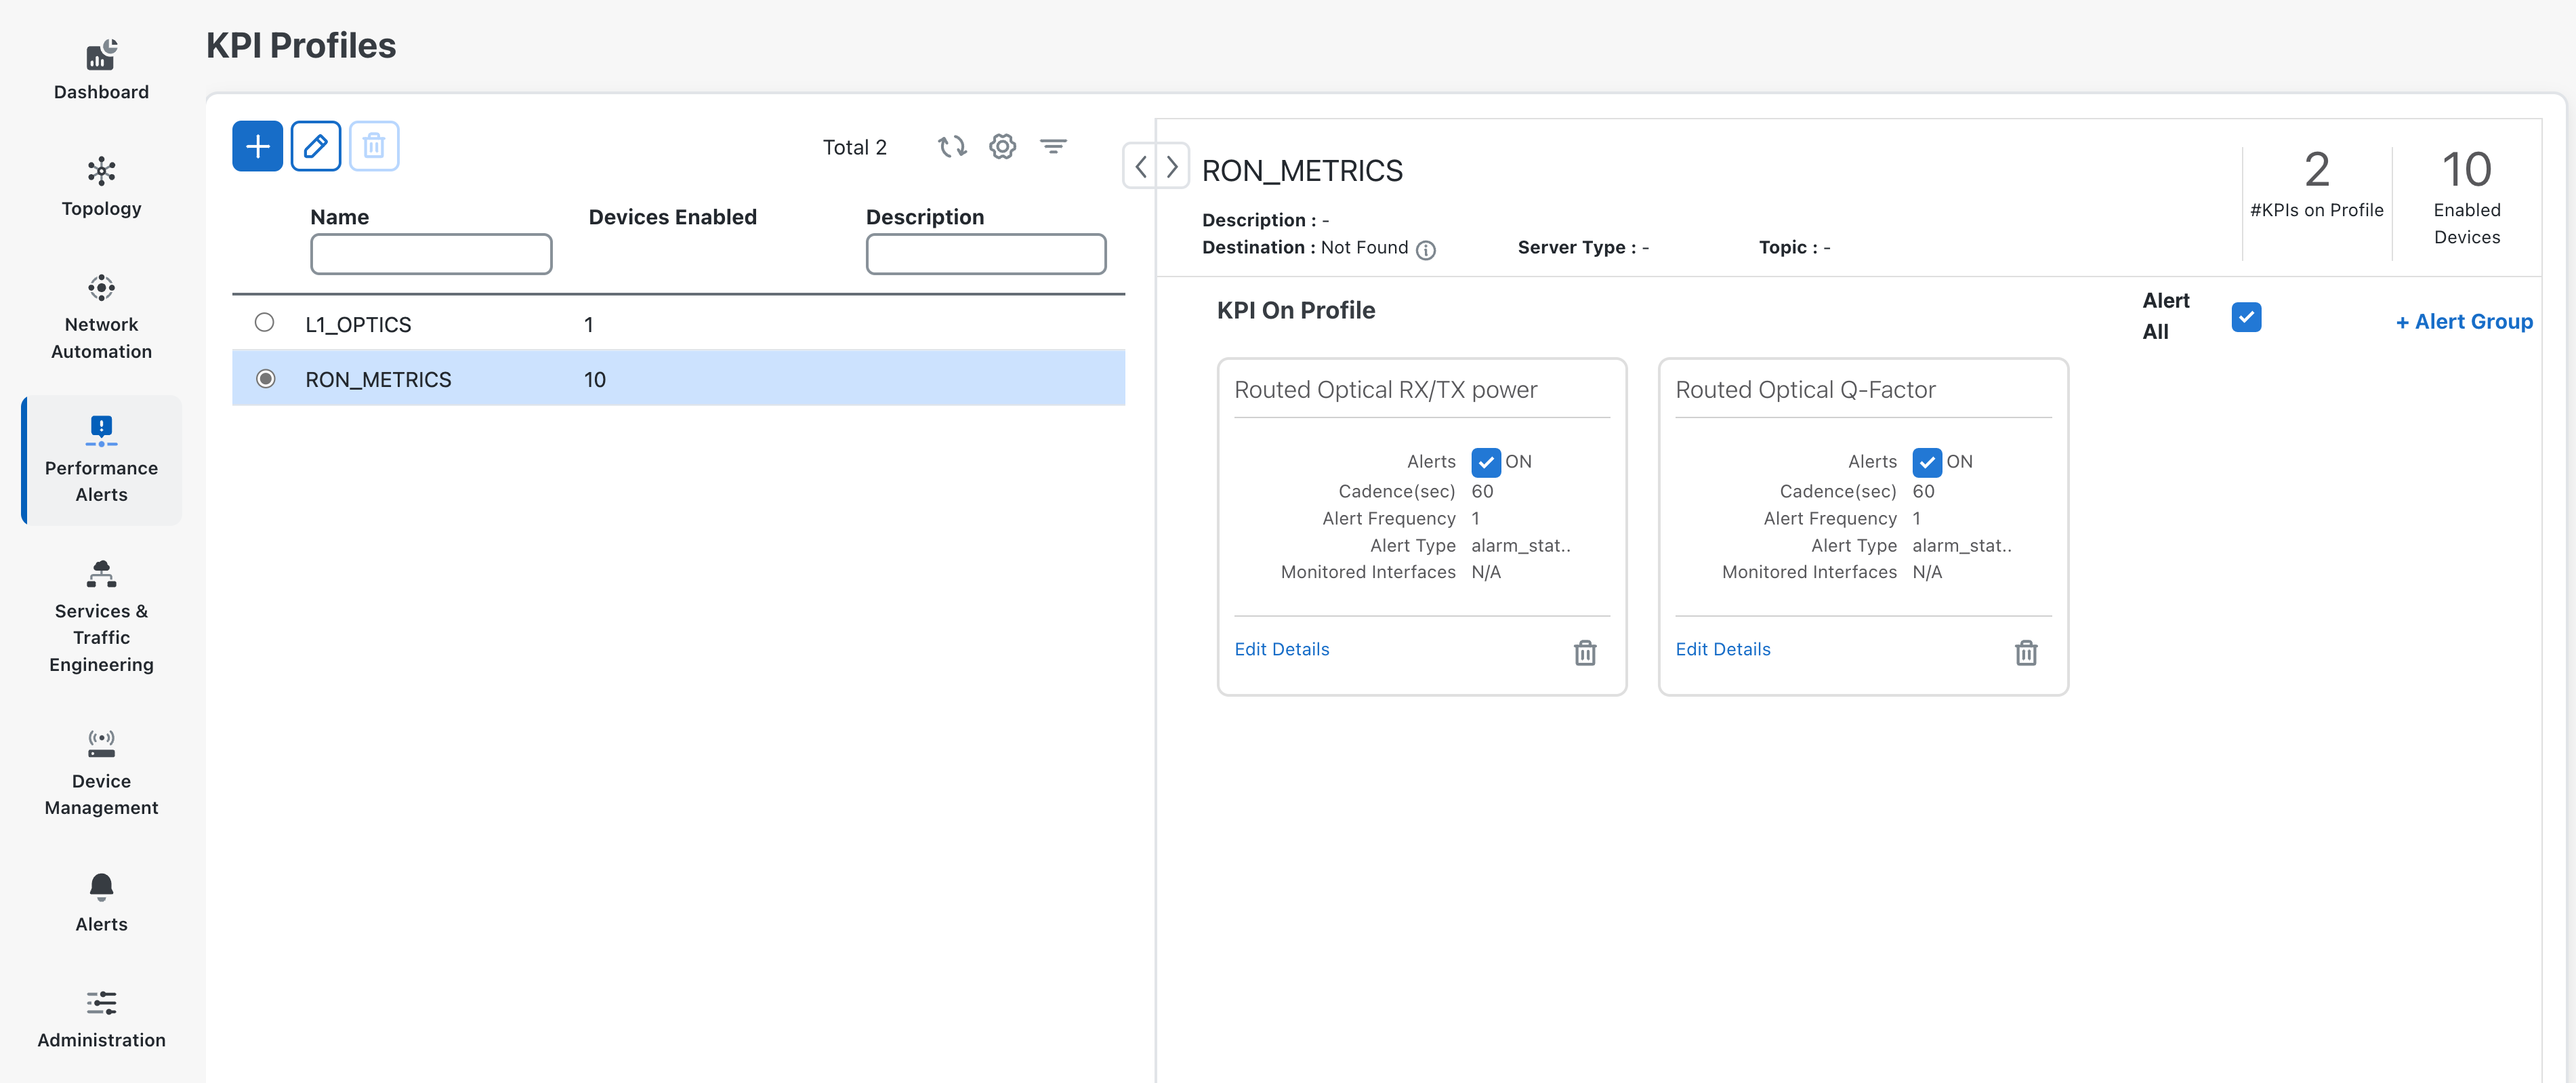
Custom KPIs and KPI Profiles
Health Insights allows the user to customize the KPIs being used and group them into KPI Profiles specific to the application.
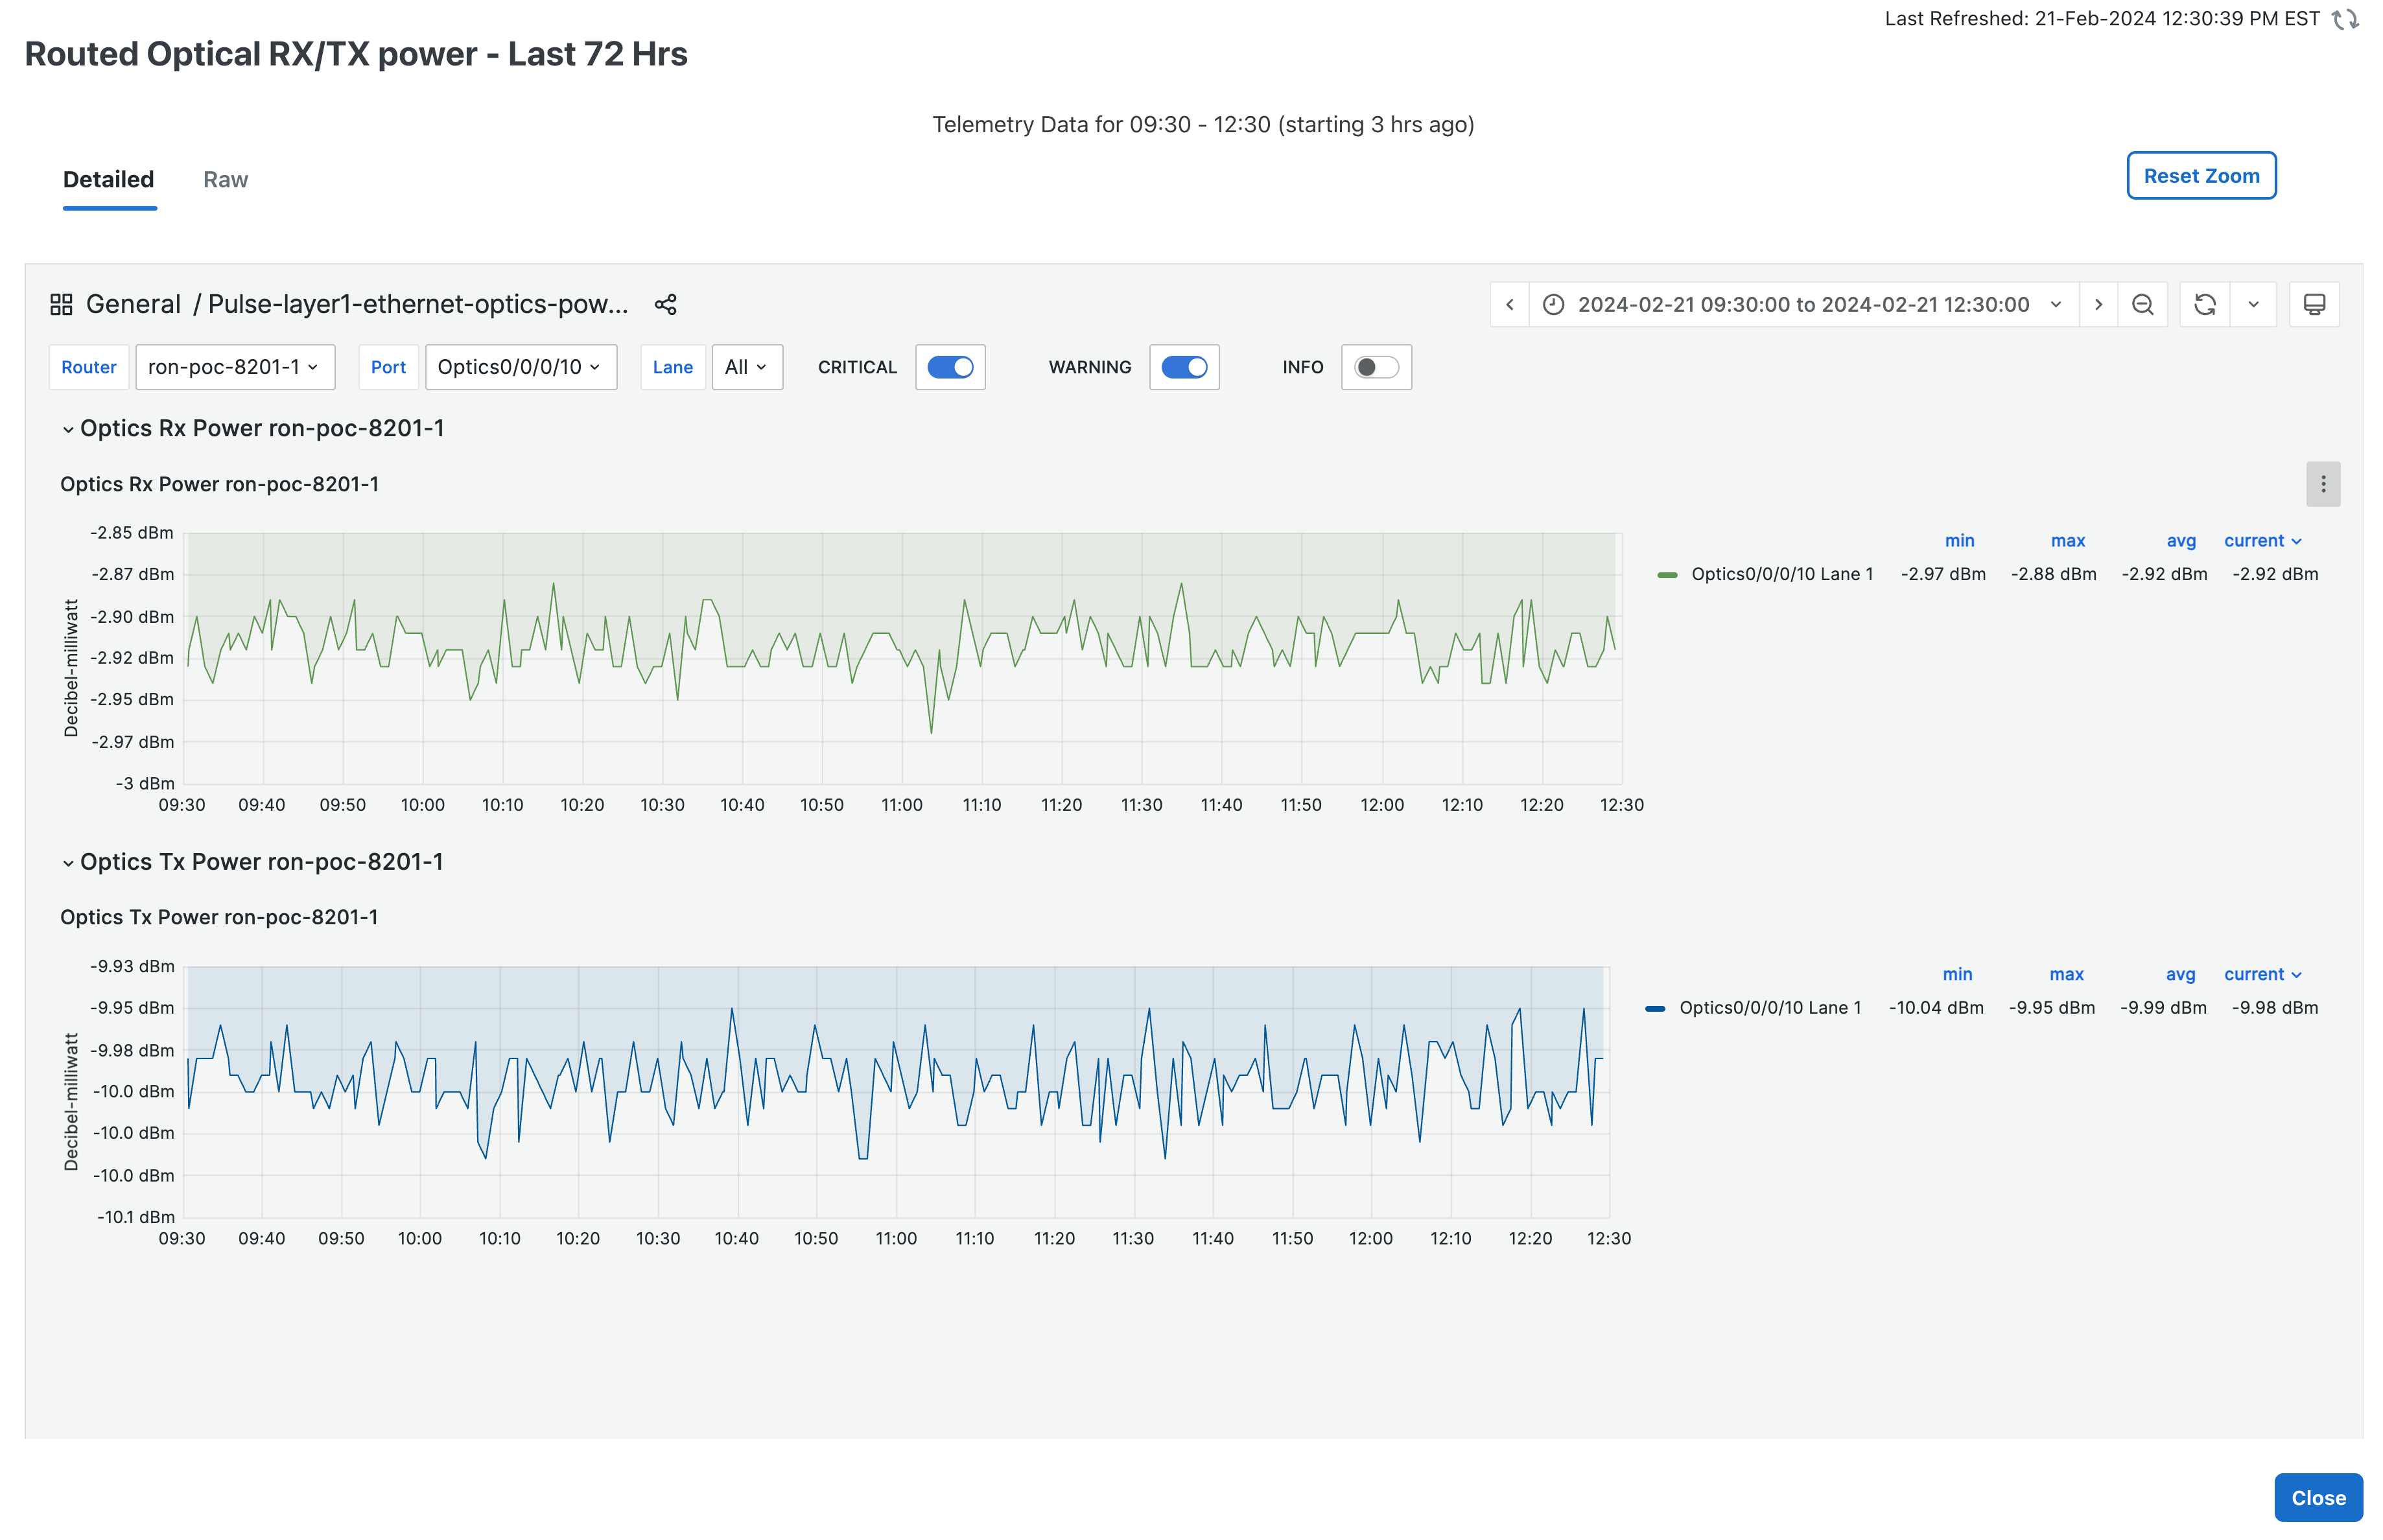
Here we see a KPI Profile being used to monitor RX/TX Power and Q-Margin which can then be applied to devices with DCO.
KPI graph being used specifically for DCO monitoring. Any sensor path leaf returning data as numeric data can be graphed. If the data is non-numeric it cannot be graphed but can be shown in a tabular format.
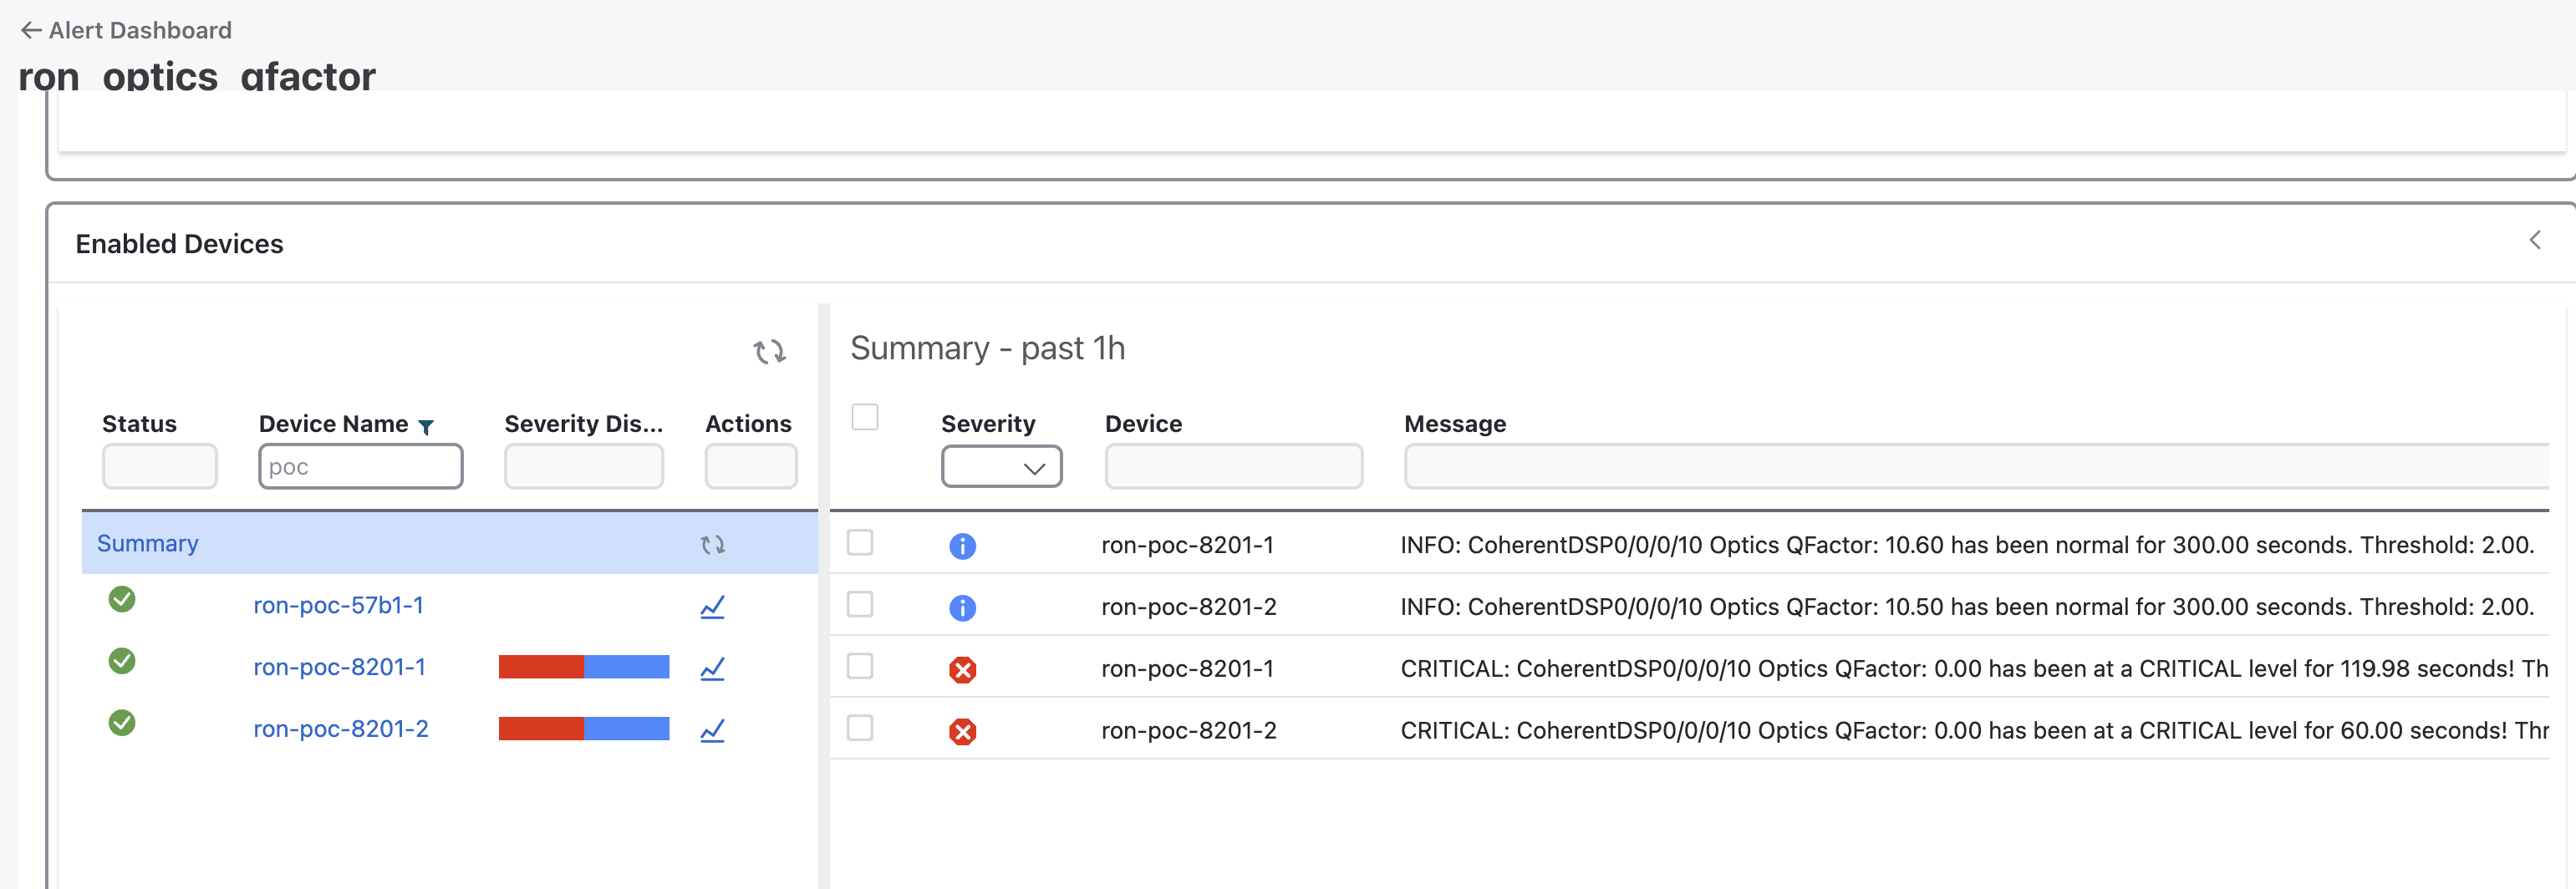
The following shows alerts triggered by our custom KPIs. A critical alarm is raised when the Q-Factor of the DCO drops below .5 for a specific amount of time, and clears when the Q-Factor returns to a nominal value.
Additional Resources
Routed Optical Networking Design Guide
https://xrdocs.io/design/blogs/latest-routed-optical-networking-hld
Routed Optical Networking Landing Page
https://www.cisco.com/site/us/en/solutions/routed-optical-networking/index.html
Leave a Comment